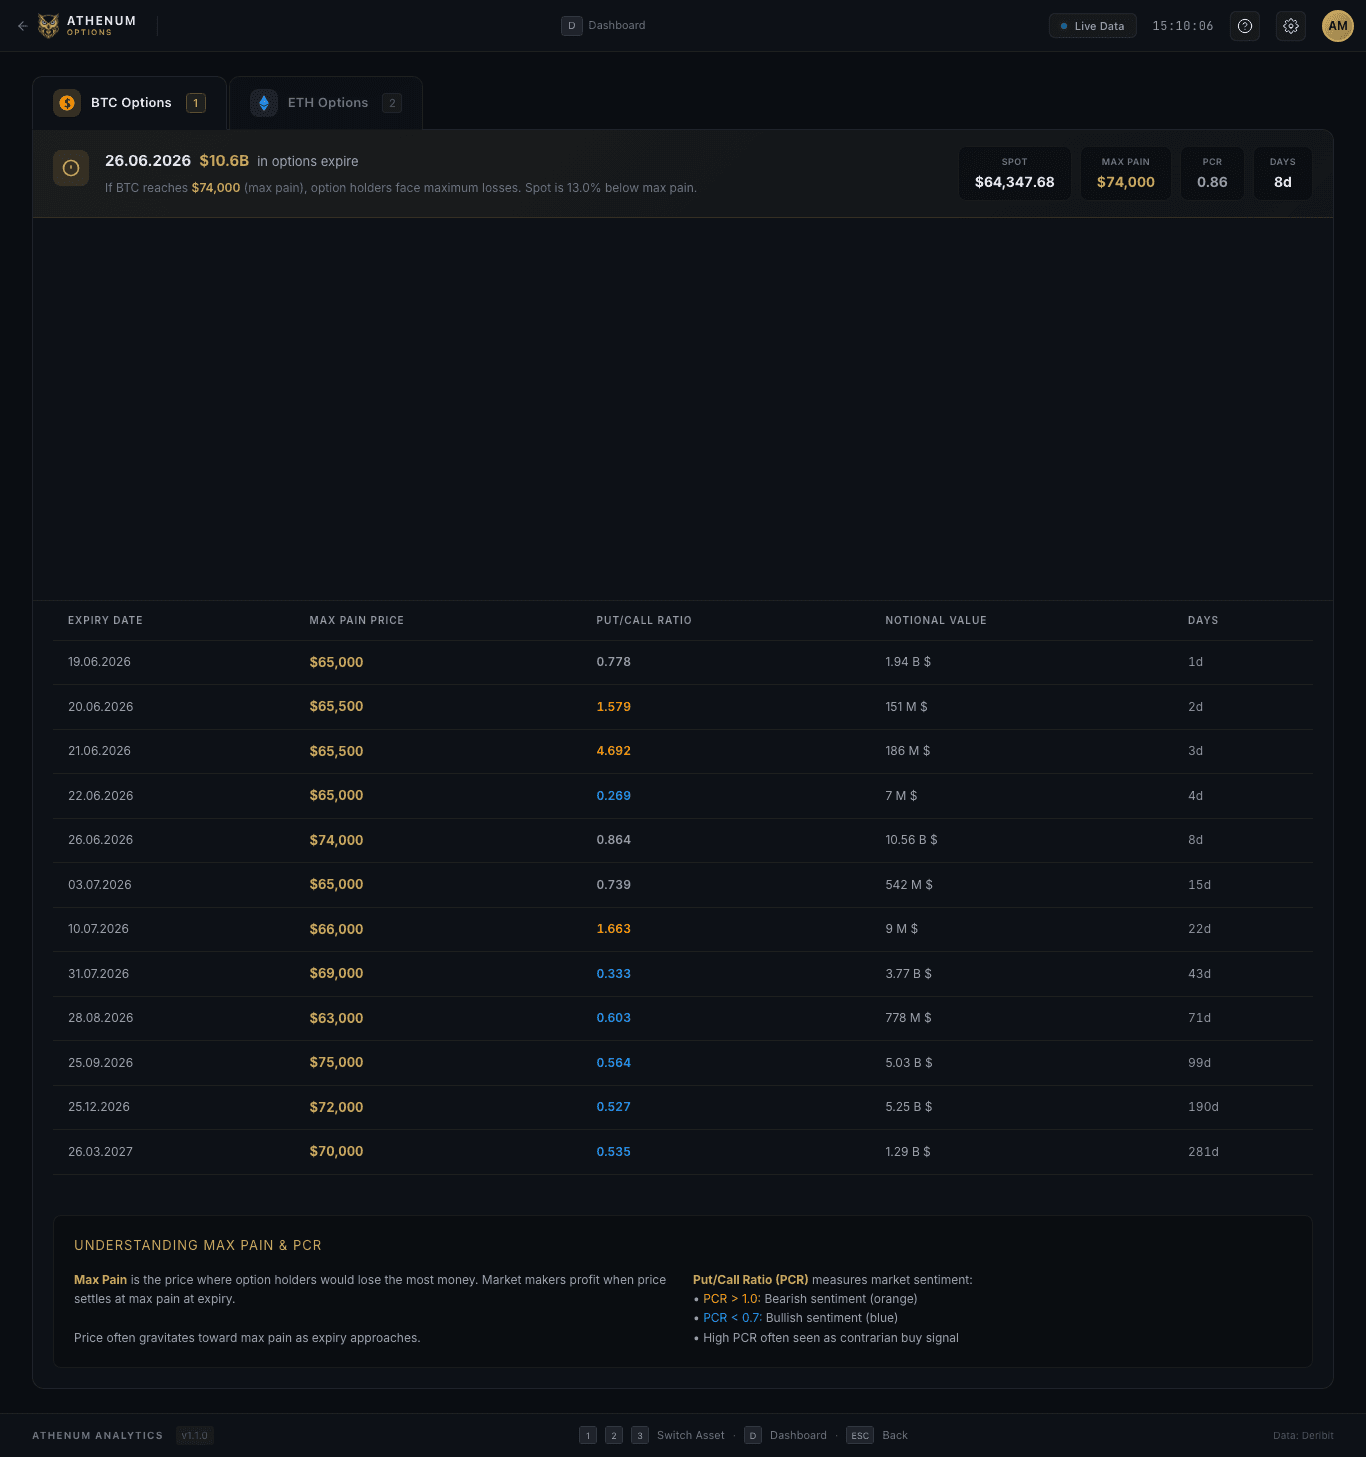
The implied volatility (IV) term structure is implied volatility plotted across option expiries, from the front-month contract out to the back-month. When it slopes upward, the market is pricing calm now and more uncertainty later, a state called contango. When it inverts, with near-dated options richer than longer-dated ones, that is backwardation, and it usually shows up in selloffs or right before a known catalyst. The shape, and how it moves, is a read on where the market expects turbulence to land in time.
What is the implied volatility term structure?
Every listed option carries an implied volatility, the level of future price movement the market is pricing into that contract. Group options by expiry, take a representative IV for each one, and plot those points along a time axis. The line you get is the term structure.
Read left to right, it answers a single question: how does the market's expected volatility change as you look further into the future? The front of the curve reflects what traders expect over the next days or weeks. The back reflects months out. The slope between them is the signal. A steep upward slope says near-term conditions look quiet relative to the longer horizon. A flat or downward slope says the near term is where the market expects the action.
This is distinct from the price of the underlying. The term structure is about the price of uncertainty, expressed in volatility terms, across calendar time.
What do contango and backwardation in the IV curve mean?
Contango is the normal, upward-sloping state. Near-term IV sits below longer-dated IV. The intuition is that the immediate future is somewhat knowable, while a longer horizon carries more room for the unexpected, so options that cover more time command a higher volatility premium. A market drifting through a quiet stretch typically shows contango.
Backwardation is the inverted state. Near-term IV trades richer than longer-dated IV, so the curve slopes down. This tells you the market is paying up for protection or exposure right now. Backwardation tends to appear during active selloffs, when traders scramble for short-dated hedges, or in the run-up to a scheduled event whose outcome lands soon. The market is effectively saying the next stretch is more dangerous than the months beyond it.
The practical takeaway is directional in time, not in price. Contango points stress outward. Backwardation pulls it forward.
Why does the IV curve change shape?
The curve is not static. It reprices as the balance of fear and complacency shifts across horizons.
A common and revealing distortion is the event hump. When a single dated catalyst is approaching, a scheduled FOMC meeting, a major token unlock, a protocol upgrade, the one expiry that captures that event gets bid up relative to the expiries on either side of it. The result is a localized bulge in the curve rather than a smooth slope. The hump is the market pricing a discrete, calendar-pinned source of uncertainty, and it often deflates quickly once the event passes and that uncertainty resolves.
Broader shifts happen too. A sharp drawdown can flip a contango curve into backwardation within hours as short-dated demand spikes. As conditions settle, the front end tends to soften first and the curve eases back toward its upward slope. Watching the whole curve move, rather than a single IV number, is where the information lives.
How is the term structure different from volatility skew?
These two are easy to confuse because both are curves built from option IVs, but they cut along different axes.
Skew is implied volatility across strikes at a single expiry. It compares, for one expiry date, how much more the market pays for downside protection (puts) versus upside (calls). Skew is about which direction the market fears at a given horizon.
The term structure is implied volatility across expiries. It holds the strike concept roughly constant and asks how IV changes as the expiry date moves further out. It is about when the market expects movement, not which way.
It also helps to separate both of these from the realized-versus-implied comparison, which is about the level of volatility: how much the market is pricing (implied) against how much actually occurred (realized). Level, direction, and time are three different lenses. Skew is direction across strikes. Realized-versus-implied is level. The term structure is time across expiries.
How do you use the IV term structure in practice?
Traders typically start with shape. Is the curve in contango or backwardation, and is there an event hump sitting on a specific expiry? That single glance frames how the market is positioned in time. From there, the more useful signal is the shift: a curve sliding from contango toward backwardation flags rising near-term stress, while a deflating event hump marks a catalyst the market has now digested.
The caveats matter. Back-month liquidity often thins out, so longer-dated IV points can be noisier and less reliable than the front of the curve. And the term structure is a snapshot. It tells you what the market is pricing at one moment, not what will happen. It is best read repeatedly over time and cross-checked against other signals rather than treated as a forecast.
That cross-checking is where it earns its keep. The term structure tells you how volatility is distributed across time, but it does not tell you who is positioned and where the leverage sits. Pairing curve shape with live positioning, open interest, funding, and order flow turns a static read into context. Athenum's derivatives intelligence layer brings options flow, max pain, funding-rate analytics, and CVD into one terminal alongside macro inputs like the FOMC calendar, so the volatility picture can be read next to the positioning and catalysts that move it.
Practitioner takeaway
The IV term structure is volatility across expiries, not across strikes (that is skew) and not a level comparison (that is realized versus implied). Contango is the calm, upward-sloping default. Backwardation is the inverted, stress or pre-catalyst state. Event humps mark a single dated catalyst priced into one expiry. Read the shape, watch the shifts, respect thin back-month liquidity, and treat the whole thing as a snapshot to be cross-checked against positioning rather than a standalone forecast.
One terminal. All the data.
Liquidations, orderbook depth, whale walls & open interest from 4 exchanges, all real-time, in one place.
No credit card required

Athenum Analytics
Athenum Analytics is our three-person editorial team covering crypto derivatives, market data and macroeconomic context.