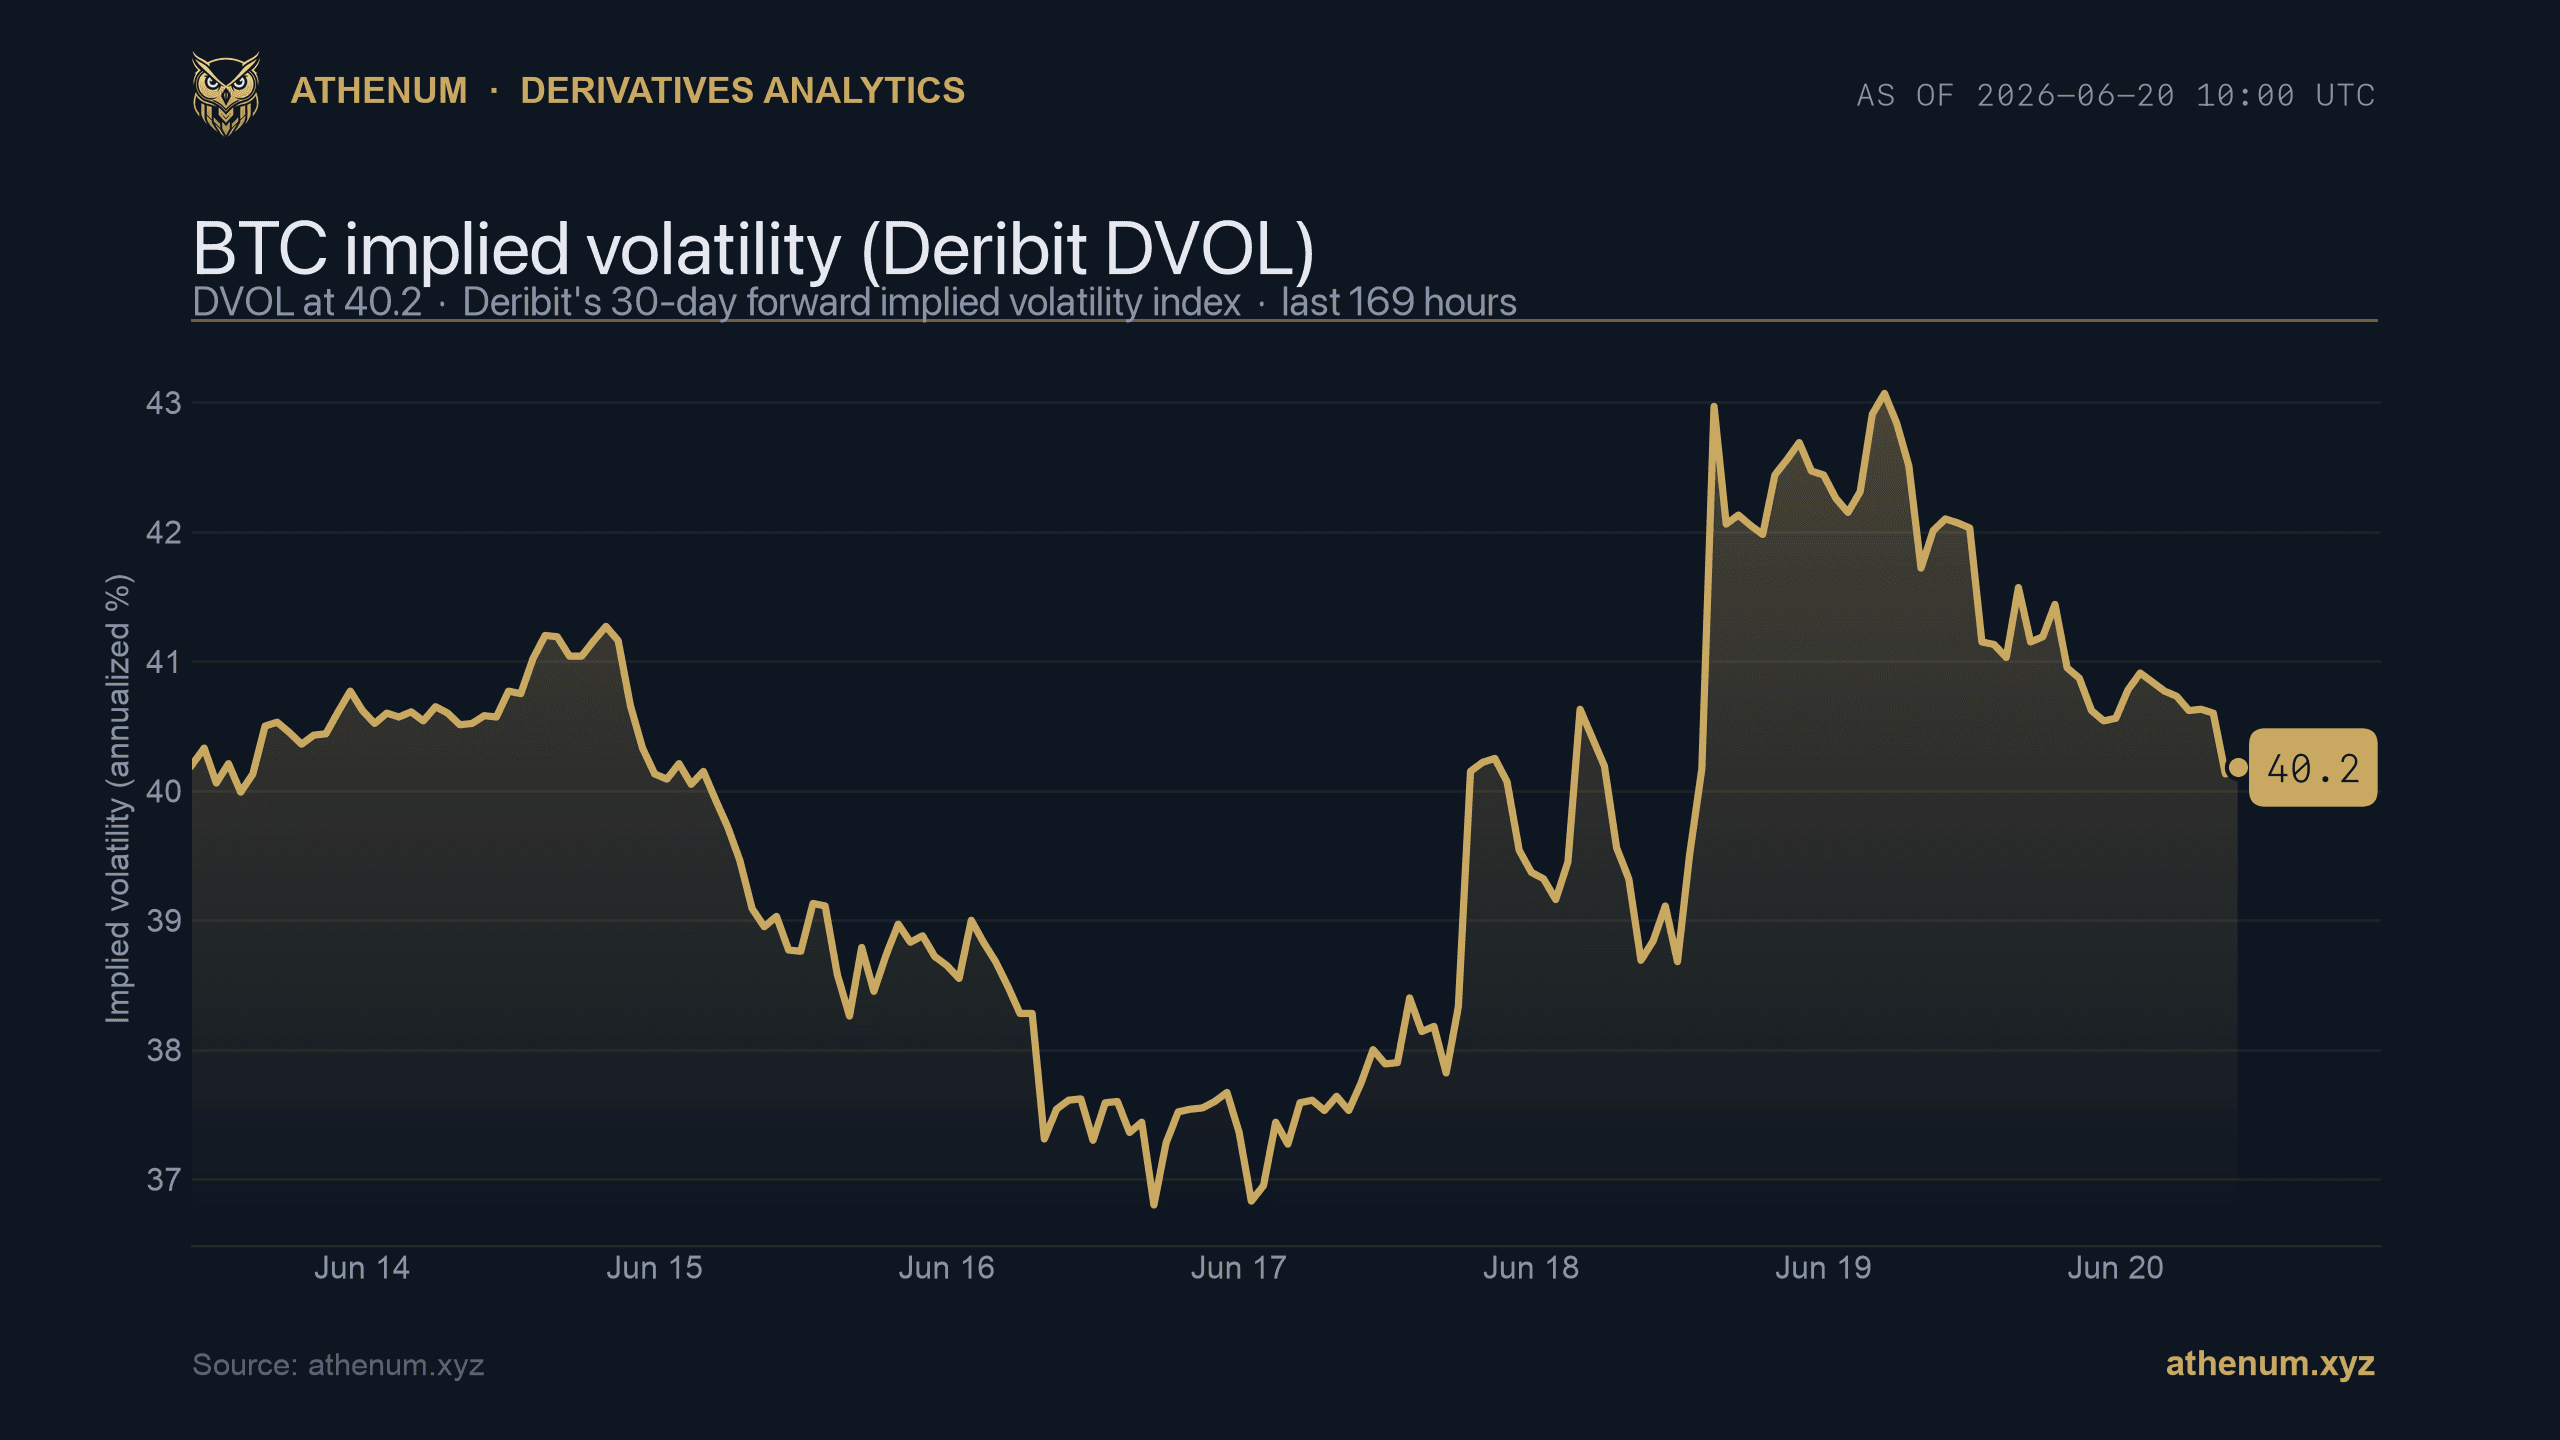
TL;DR: DVOL is Deribit's Bitcoin volatility index, the closest thing crypto has to the equity VIX. It reads the whole BTC options surface to produce one number: the market's 30-day forward-looking, annualized expected volatility, quoted in percent. It is a fear-and-uncertainty gauge, not a price forecast and not a directional signal.
What is DVOL?
DVOL is an implied-volatility index published by Deribit, the dominant venue for crypto options and now part of Coinbase following its 2025 acquisition. It distills the prices of Bitcoin options into a single number that represents the volatility the market is pricing in over the next 30 days, expressed on an annualized basis in percent.
The mental model is the same one equity traders use for the VIX. When option premiums are rich, traders are paying up for protection or for exposure to large moves, and DVOL rises. When premiums compress, DVOL falls. A reading of 60 means the options market is pricing roughly 60 percent annualized volatility for BTC over the coming month. There is also an ETH DVOL built the same way for Ether, so you can compare how much uncertainty the market assigns to each asset.
How is DVOL constructed?
The key detail is that DVOL is model-free. It does not take a single at-the-money quote and call that "the" implied volatility. Instead it integrates across the strike surface, a method borrowed from variance-swap pricing, so out-of-the-money puts and calls all contribute.
In practice Deribit selects the two listed expiries that bracket the 30-day horizon, one nearer and one further out, and uses the bids and asks across strikes for each. It discards in-the-money options and the deepest out-of-the-money tails (options with delta below roughly 5 percent), because those quotes are noisy and add little signal. The variance from each expiry is computed in variance-swap style, weighting out-of-the-money options by the inverse of the strike squared, then interpolated to a constant 30-day point and annualized. The output is one volatility number.
Why does the surface matter rather than a single quote? Because the shape of the surface carries information. Skew (puts pricing higher than calls, or the reverse) and the convexity of the smile tell you where the market expects risk. A model-free index captures the full distribution the options are pricing, not just the center.
How do you read DVOL levels and spikes?
Read DVOL in three ways: level, change, and term context.
Level tells you the regime. Persistently low readings describe a quiet, range-bound tape where carry and premium-selling strategies feel comfortable. Elevated readings describe a market bracing for or living through stress.
Change matters more than the absolute number for timing. A fast jump, where DVOL gaps higher in hours, usually coincides with a liquidation cascade, a macro shock, or a sharp directional break. Those spikes tend to mean-revert, which is exactly why a volatility index is useful: it flags when fear is being repriced in real time.
A practical rule of thumb: because crypto trades every day, divide DVOL by the square root of 365 (about 19) to approximate the expected daily move. A DVOL of about 60 implies a typical daily swing on the order of 3 percent. That keeps the number grounded in something you can feel on the chart.

BTC implied volatility, the Deribit DVOL index. Source: Athenum.
DVOL versus realized volatility: what is the variance risk premium?
DVOL is implied (forward-looking, derived from option prices). Realized volatility is backward-looking, computed from how much BTC actually moved. The gap between them is the variance risk premium.
Most of the time implied sits above realized, because option sellers demand compensation for tail risk, so buyers of protection pay a premium on average. Watching DVOL against trailing realized vol tells you whether options are rich or cheap relative to what the market has actually been delivering. When implied collapses toward or below realized, the cushion that usually rewards option sellers thins out, and the risk-reward of selling premium shifts.
Where does DVOL mislead?
DVOL is an expectation, not a prophecy. It tells you what the options market is pricing, which is not the same as what will happen. Three limits matter. First, it is direction-blind: high DVOL says "big moves expected," not "up" or "down." Second, it can stay elevated for long stretches in a genuinely turbulent regime, so a high reading is not automatically a fade. Third, it reflects the options market specifically, concentrated on Deribit, so it inherits that venue's positioning and liquidity rather than the whole spot market.
How does this fit a full derivatives workflow?
Implied vol is one input. It reads cleanest next to the rest of the positioning picture: funding rates, open interest, liquidation levels, options skew and gamma, and order-book depth. A vol spike that lines up with crowded funding and stacked liquidations is a very different setup from a vol spike on a clean book.
Athenum's derivatives terminal brings options IV, skew and gamma together with funding, open interest, liquidations and macro context across 14 exchanges, so you can see volatility in the context that produced it. Everything there is data and context; the terminal makes no buy or sell calls. Free calculators and a 7-day Pro+ trial (no card required) are there if you want to try the workflow first.
One terminal. All the data.
Liquidations, orderbook depth, whale walls & open interest from 4 exchanges, all real-time, in one place.
No credit card required

Athenum Analytics
Athenum Analytics is our three-person editorial team covering crypto derivatives, market data and macroeconomic context.