TLDR: There is no single best crypto derivatives analytics tool, only the right one for what you trade. Coinglass leads on liquidation heatmaps and funding; orderflow specialists like Tensorcharts and Aggr own the tape; Laevitas goes deep on options; Hyblock and Velo bundle liquidity and positioning. The real question is how many tabs you are willing to run, because few mainstream tools combine order flow, derivatives positioning, and macro context in one view.
Most traders do not pick one analytics tool. They pick five. Industry coverage in 2026 consistently describes professional crypto traders running three or more analytics platforms at once, and it is common to see active traders running half a dozen or more browser tabs at once. Task-switching between them is not free: it slows decisions and produces analysis that is correct but arrives too late to act on. So the useful question is not "which single tool wins," but "what do I actually need to see together, and how do I stop tab-hopping between them."
This is a fair, mechanics-first map of the main options and where each fits. No tool here is bad. They are built for different jobs.
What does Coinglass do well, and what is the trade-off?
Coinglass is the category reference for derivatives positioning. Its liquidation heatmap, funding-rate views, open interest, long/short ratios, and options max pain are widely used and genuinely useful, and it offers a capable free tier plus dedicated landing pages per metric. If your workflow centers on liquidation levels and funding across exchanges, it is a natural default.
Coinglass is strongest as a cross-exchange derivatives positioning reference, and it has expanded into order flow too: its Legend and Supercharts environment now adds footprint charts, cumulative volume delta (CVD), large-trade detection, and order-book depth alongside the liquidation and funding views. The trade-off is breadth of context rather than a missing feature. Traders who want positioning, order flow, options, and macro lined up in one view still tend to assemble that picture across more than one tool.
What do the other tools cover?
Each of these is strong at a specific job:
- Velo Data packs a slick, multi-panel dashboard for derivatives positioning and a broad market table, free to use. It is built for fast scanning of funding, OI, and basis rather than live tape. - Coinalyze has offered free, customizable derivatives metrics since 2017, including a custom-metric builder, and publishes educational material. A solid free generalist for funding, OI, and liquidations. - Hyblock Capital bundles estimated liquidation heatmaps, volume delta, open interest, funding, and screeners across many exchanges, with an education academy. Strong on liquidity and positioning. - Laevitas is the options-depth specialist: option chains, implied volatility, Greeks, term structure, and strategy tooling across many venues. The go-to if options are your core market. - Tensorcharts and Aggr.trade are orderflow and tape specialists: heatmaps, footprint, large-trade detection, and aggregated live trade tape. Excellent for microstructure, narrower on derivatives positioning and macro.
The pattern across all of them: deep in one lane. Positioning, or options, or tape. Pricing for the paid tiers changes often, so check each vendor's current page rather than trusting a number in any comparison article, including this one.
How do you choose the right one?
Match the tool to the decision you are actually making:
- If you trade off liquidation levels and funding, a positioning aggregator is your anchor. - If you scalp and need to read the tape, an orderflow specialist matters more than another funding screen. - If you trade options, depth on chains, IV, and Greeks beats a generalist. - If your edge comes from context (how funding, OI, CVD, options, ETF flows, and the macro backdrop line up), the binding constraint is not any single feature. It is how many tabs you can watch before the moment passes.
That last case is the one most under-served by single-lane tools, and it is the reason traders end up with a wall of open tabs.
Where does Athenum fit?
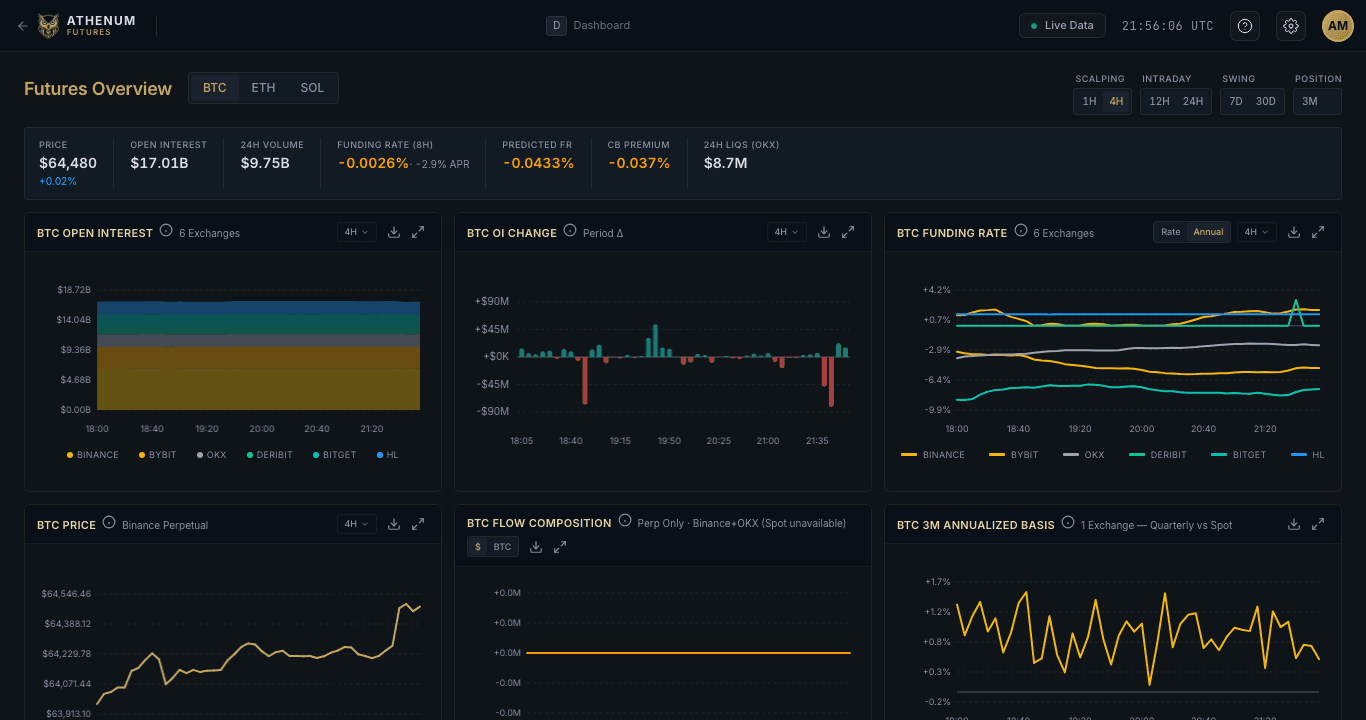
Athenum is built for the context problem. It aggregates public market data across 14 exchanges and puts order flow and depth (whale walls, aggregated orderbook depth, real-time trade feed, OI heatmaps), derivatives intelligence (funding analytics, CVD and range analysis, options flow and max pain, CME basis tracking), and a macro and institutional layer (FRED indicators, the FOMC calendar, ETF flow tracking, SEC filings, and a geopolitical World Map) in one customizable terminal. Few mainstream tools combine all three layers in a single view, which is the specific gap that creates the multi-tab habit.

The free layer on 2026-08-03: 34 calculators covering leverage, PnL, funding, options and DeFi yield, reachable without an account. The paid terminal is a separate decision from the calculators.
You can compare what a given funding rate costs over a holding period with the free funding rate calculator, then read that number next to live OI, CVD, and liquidations on the same screen.
It is live and self-serve. The free tier gives delayed data across 3 exchanges with 7 days of history at no cost, and a 7-day Pro+ trial opens full access with no credit card. Sign up with email, an Ethereum wallet, or a Solana wallet, with no API keys, at https://app.athenum.xyz/auth .
None of this is a verdict on any other tool. If your work fits a single lane, a specialist may serve you better. If you keep opening tabs to assemble the whole picture, that is the problem Athenum was built to remove.
One terminal. All the data.
Liquidations, orderbook depth, whale walls & open interest from 4 exchanges, all real-time, in one place.
No credit card required

Athenum Analytics
Athenum Analytics is our three-person editorial team covering crypto derivatives, market data and macroeconomic context.