Research data · Version 1 · 24 September 2026
Bitcoin return baselines: a reproducible hourly study
A return measured since midnight can have the opposite sign to a trailing 24-hour return. We independently recalculated the annual hourly study in our Bitcoin baseline article using Binance's public BTCUSDT perpetual candles.
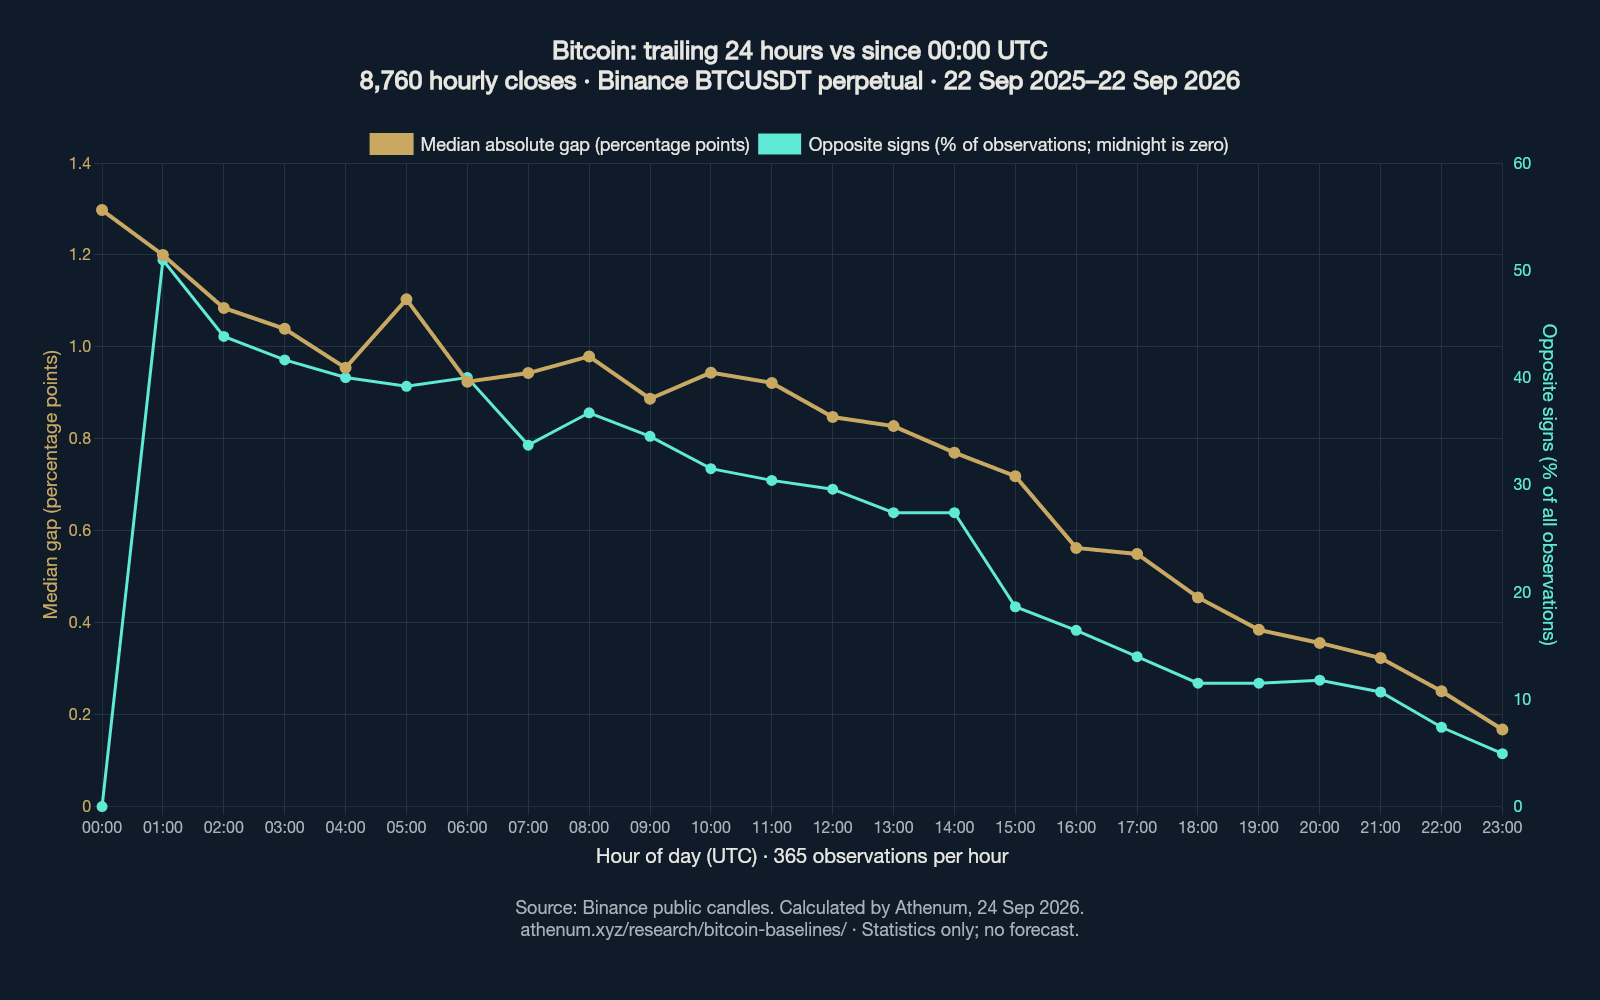
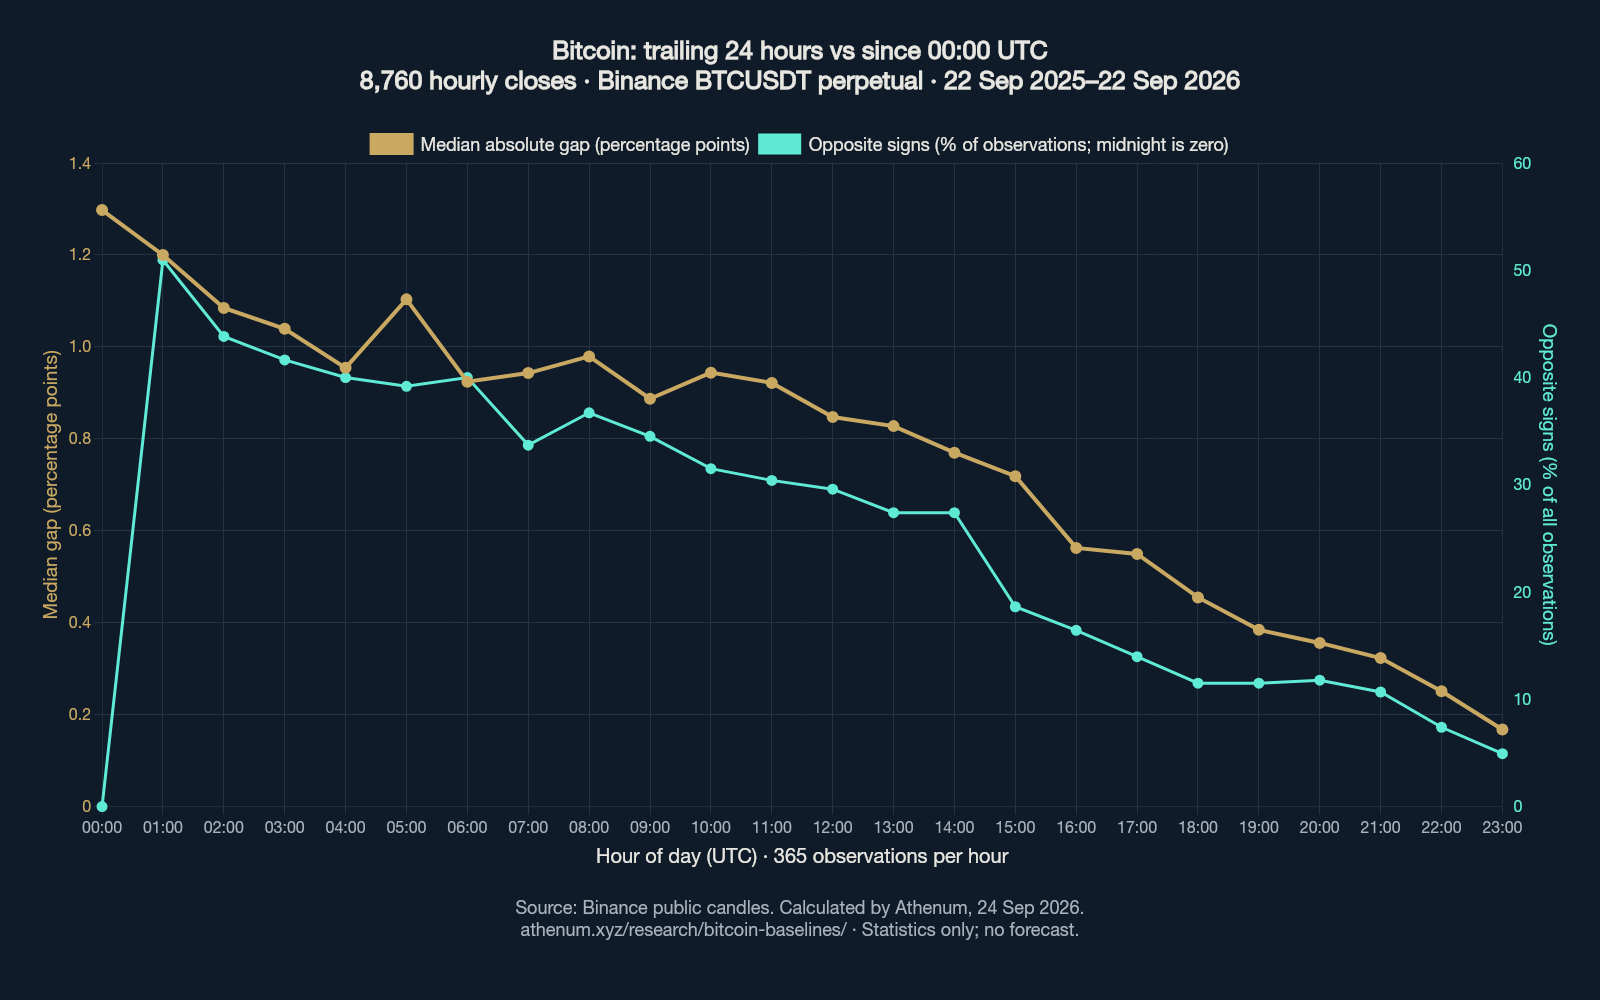
The re-run contains 8,760 complete hourly observations, from 22 September 2025 at 09:00 UTC through 22 September 2026 at 08:00 UTC. Both returns have opposite signs at 2,240 observations (25.5708%). The median absolute gap is 0.662510 percentage points; 3,251 observations exceed one point and 1,427 exceed two points.
Download and cite
- CSV: statistics for each UTC hour (24 rows)
- JSON: overall findings, exact source requests and source hash
- Node 22 calculation code
- Citable chart (PNG, 1600 × 1000)
Suggested citation: Athenum Analytics (2026), Bitcoin return baselines — statistics by UTC hour, version 1, 24 September 2026, https://www.athenum.xyz/research/bitcoin-baselines/. Credit the source candles to Binance.
Reproduce the calculation
node reproduce.mjs ./resultsThe script requires Node 22 and internet access, downloads the source candles directly from Binance, checks timestamps and duplicates, and stops if any of the three required prices is missing. It writes the aggregate CSV and summary JSON. The source hash records the exact returned candle payload; a later vendor revision can change the hash and results.
For each hour boundary t, let P(t) be the close of the preceding one-hour candle. Binance labels candles with their opening timestamp; we add one hour to locate the close. The trailing return is 100 × (P(t) / P(t − 24h) − 1). The calendar return is 100 × (P(t) / P(last 00:00 UTC) − 1). The absolute gap is measured in percentage points, not percent of the return.
Opposite signs require the product of the two returns to be strictly negative. A zero return has no sign. There are 367 zero calendar returns, including all 365 midnights. Excluding these leaves 2,240 / 8,393 = 26.6889%; the headline uses all 8,760 observations. Quantiles use linear interpolation at (n − 1) × q. Every UTC-hour group contains 365 readings.
CSV column dictionary
| Column | Meaning / unit |
|---|---|
utc_hour | Hour of the observation boundary, 0–23, UTC |
period_start_utc / period_end_utc | Inclusive study endpoints in ISO 8601 UTC |
observations | Number of hourly readings in this group |
calendar_zero_count | Calendar returns exactly equal to zero |
opposite_sign_count | Strictly opposite-sign return pairs |
opposite_sign_pct_all | 100 × opposite_sign_count / observations; includes zero-return observations in the denominator |
gap_median_pp | Median absolute difference, percentage points |
gap_p25_pp / gap_p75_pp / gap_p90_pp | 25th, 75th and 90th percentiles of the absolute gap, percentage points |
Scope, limitations and reuse
This download contains our calculated statistical findings and chart. It does not redistribute the underlying candle/price feed or grant a licence to Binance data. Obtain source observations from Binance's documented public endpoint and observe its applicable terms. You may cite, share and reproduce the published Athenum statistics, chart and calculation code with attribution to Athenum Analytics and the Binance source.
This is one instrument on one venue. USDT quotes are not a universal Bitcoin USD price. Adjacent hourly returns overlap, so the observations are serially dependent, not 8,760 independent experiments. The result describes baseline arithmetic during this period; it is not a trading signal or a forecast.
The article also contains a five-venue minute-by-minute capture and a cross-venue open-interest example from 22 September 2026. Their original raw captures were not available for this re-run. They are outside this downloadable dataset and are not claimed as independently reproduced.
Data and method rechecked on 24 September 2026. For current observations, see Bitcoin funding and Bitcoin open interest.