Table of Contents8 sections
- What does a 24 hour change on a crypto exchange actually measure?
- How far apart do the two baselines drift?
- How often do the two baselines disagree on the direction?
- Do exchanges that use the same definition agree with each other?
- Does the same split appear in metrics other than price?
- Is this the same as asking where to cut the trading day?
- How do you check which baseline a number is using?
- What this does not show
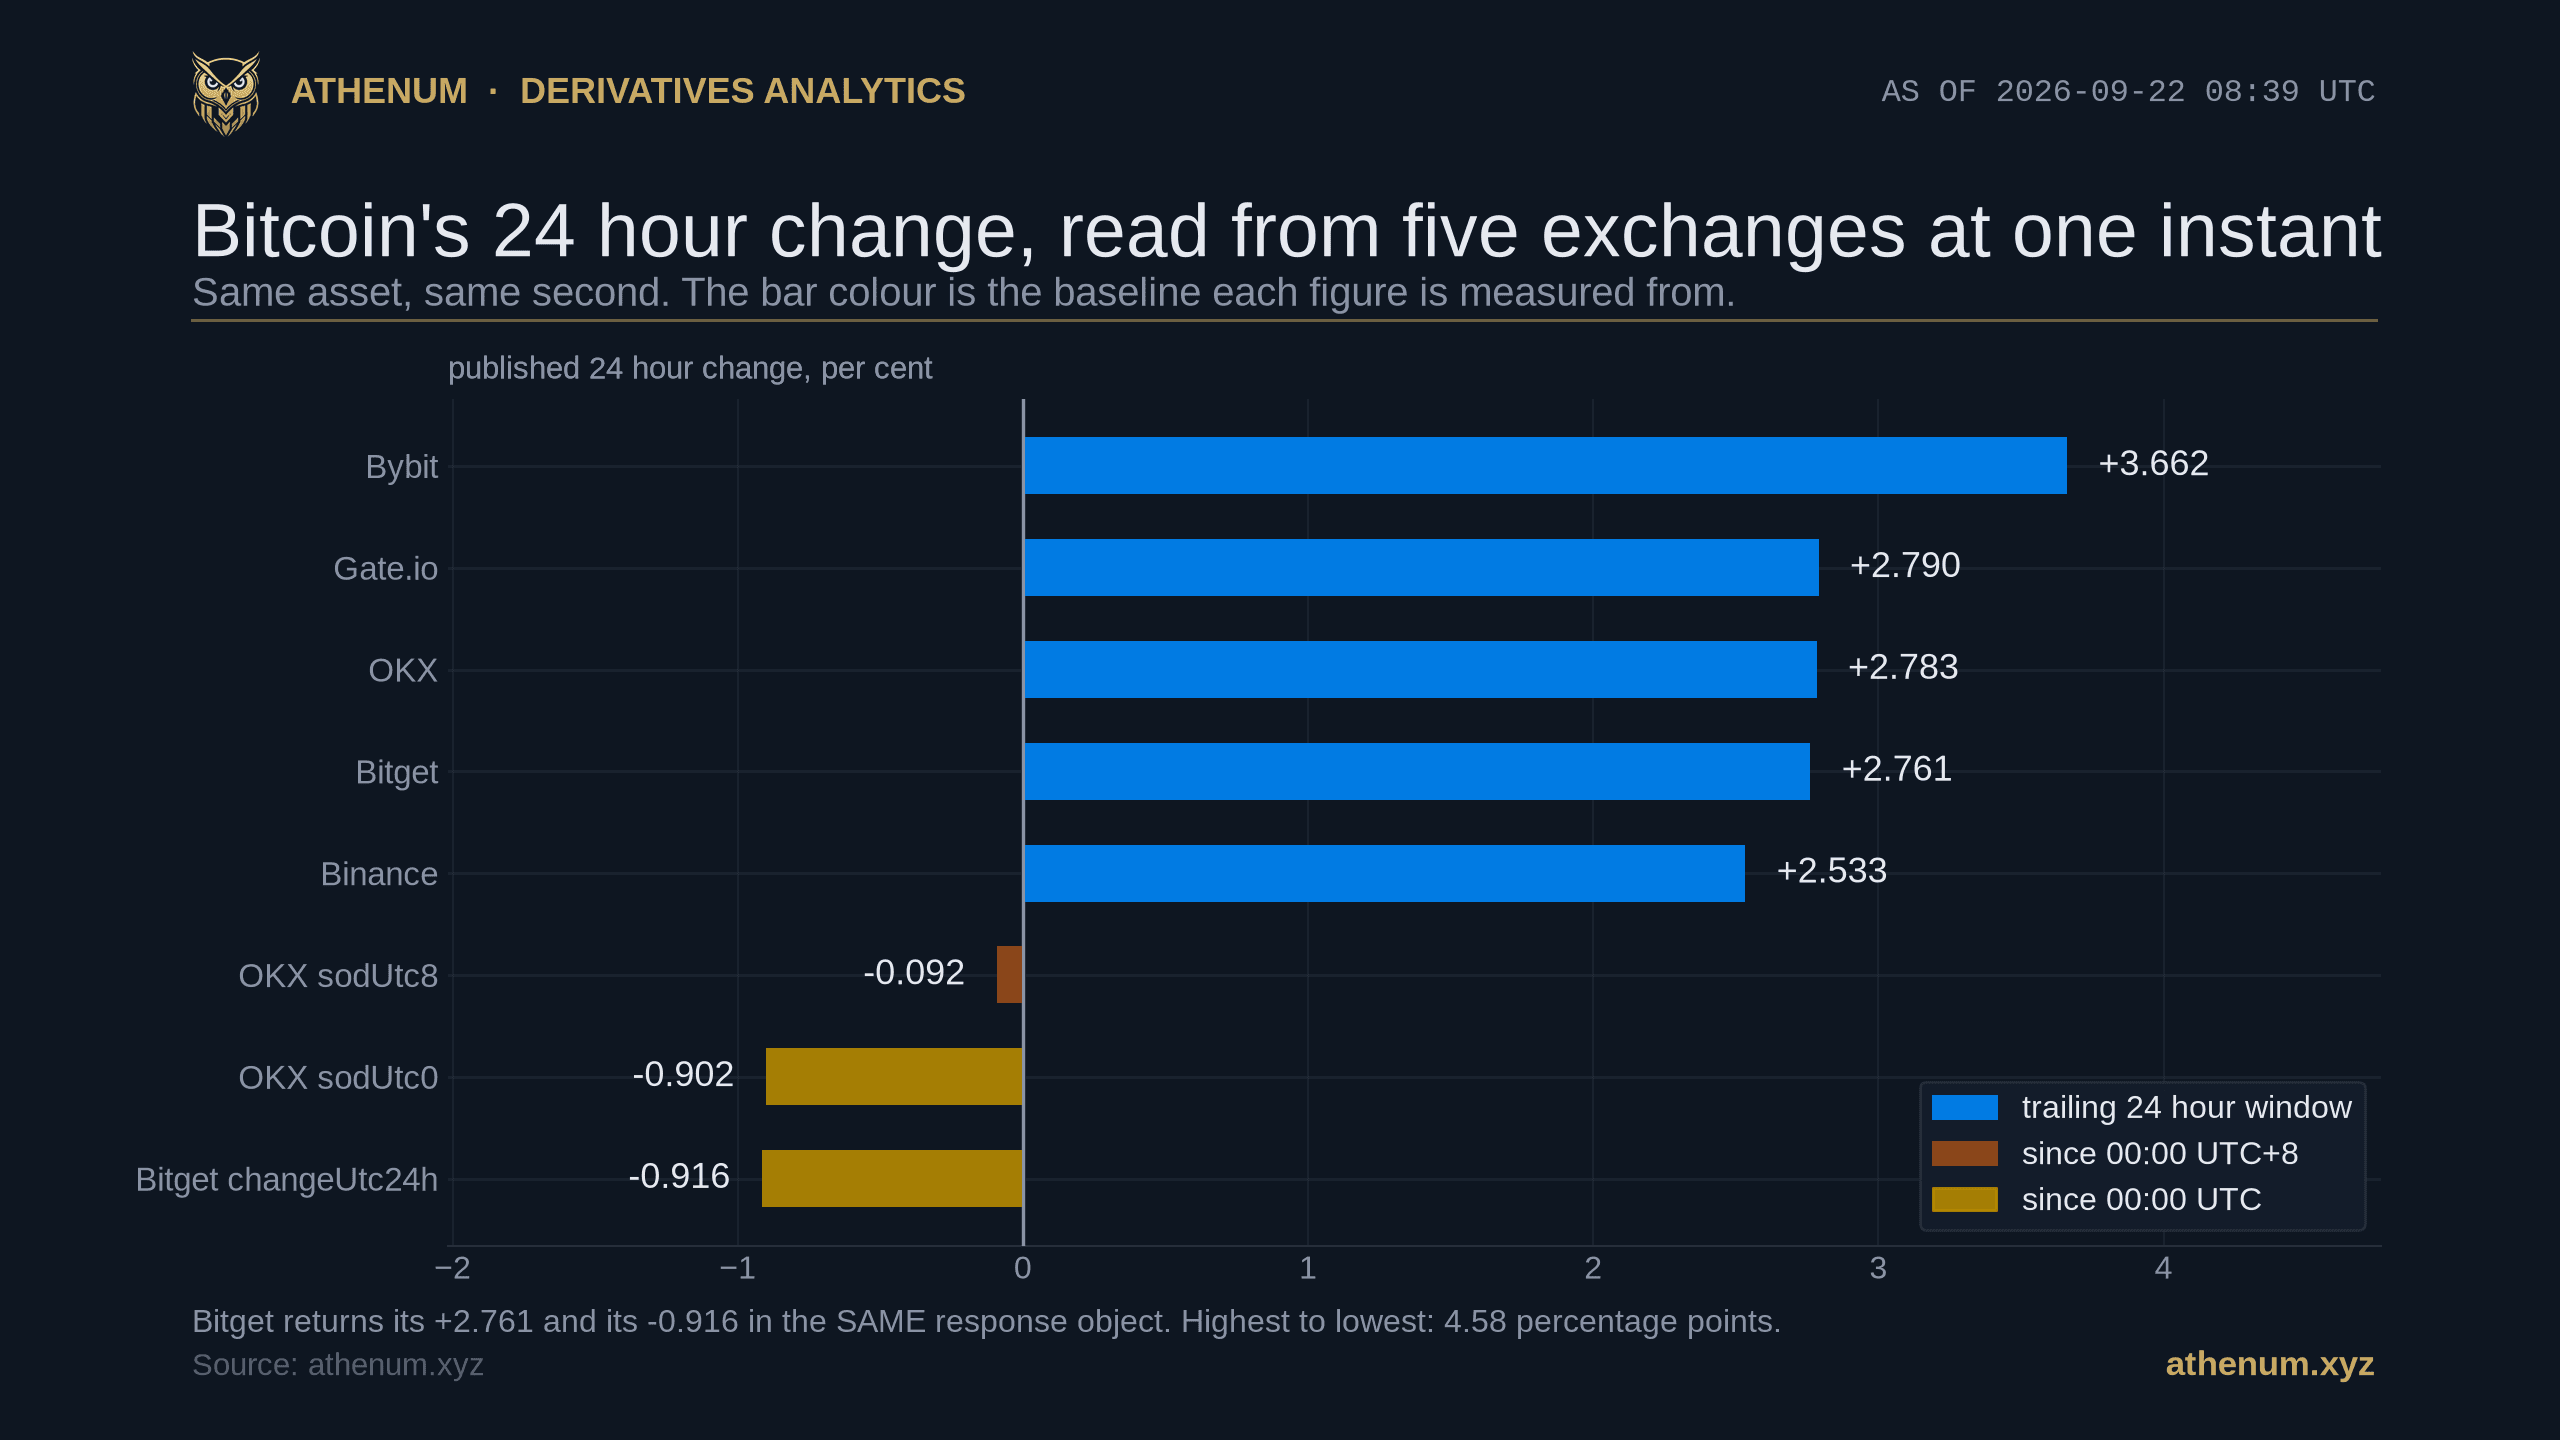
TLDR. A Bitcoin 24 hour change is a two point statement, and exchanges disagree about the first point. Some measure from a trailing 24 hour window, some from the price at 00:00 UTC, and OKX also publishes one from 00:00 UTC+8. Read at 2026-09-22 08:39:25 UTC in a 3.0 second capture, the BTC/USDT perpetual carried +3.662 per cent on Bybit and -0.916 per cent in Bitget's since-midnight field, a spread of 4.58 percentage points on the same asset at the same second, with Bitget returning both of its figures in one response object. This is not an edge case. Over the 8,760 hourly readings from 2025-09-22 09:00 UTC to 2026-09-22 08:00 UTC the two baselines differed by a median 0.663 percentage points, by more than 1 point at 37.1 per cent of readings and by more than 2 at 16.3 per cent, and they carried OPPOSITE SIGNS at 2,240 of 8,760, or 25.6 per cent. The disagreement is strongly patterned by the clock: at 01:00 UTC the two figures pointed opposite ways on 51.0 per cent of days, at 23:00 UTC on 4.9 per cent. The same split runs through metrics other than price. Athenum's own cross-venue Bitcoin perpetual open interest at 2026-09-22 07:00 UTC reads +6.96 per cent against 24 hours earlier and -0.81 per cent against 00:00 UTC, from one series at one stamp.
What does a 24 hour change on a crypto exchange actually measure?
It measures the distance from now to a baseline, and the exchange chooses the baseline. Two conventions are in wide use and both are defensible. A TRAILING WINDOW compares the current price to the price 24 hours ago, so the window moves with every tick. A CALENDAR BASELINE compares the current price to the price at the last 00:00 UTC, so the window grows through the day and resets at midnight. The figures are not variants of one number. They answer different questions, and on most days they answer them differently.
Here is the same instrument read at one instant. The capture took 3.0 seconds across all five venues, which matters because a mark and a reference read minutes apart can manufacture a spread on their own.
Venue | Field | Baseline | Reading at 2026-09-22 08:39:25 UTC |
|---|---|---|---|
Bybit | price24hPcnt | trailing 24 hour window | +3.662 per cent |
Gate.io | change_percentage | trailing 24 hour window | +2.790 per cent |
OKX | last against open24h | trailing 24 hour window | +2.783 per cent |
Bitget | change24h | trailing 24 hour window | +2.761 per cent |
Binance | priceChangePercent | trailing 24 hour window | +2.533 per cent |
OKX | last against sodUtc8 | since 00:00 UTC+8 | -0.092 per cent |
OKX | last against sodUtc0 | since 00:00 UTC | -0.902 per cent |
Bitget | changeUtc24h | since 00:00 UTC | -0.916 per cent |
The highest and the lowest figure in that table are 4.58 percentage points apart, and the gap is not an error anywhere. Every field matches the reference price it ships alongside. What the venues do not do equally is SAY which baseline they used. Binance documents a rolling 24 hour window. OKX names all three of its references in the field descriptions. Bybit describes its percentage only as relative to 24 hours, though it does call the reference price itself the market price 24 hours ago. Bitget ships the clearest field NAMES of the five, openUtc and changeUtc24h, and its current ticker reference does not define them. Gate.io states no window on its change percentage and names one only on the companion change amount. Bitget's response object carries change24h at +2.761 per cent next to changeUtc24h at -0.916 per cent, a difference of 3.677 points from one venue in one payload, because its open24h reference sat at 83,483.20 dollars and its openUtc reference at 86,581.40. OKX ships three references in one ticker: open24h, sodUtc0 at 86,589.10 dollars and sodUtc8 at 85,887.70.
We have found this shape before and it is worth saying so rather than presenting it as new. Our Athenum measurement of Bybit's open interest field found the same exchange publishing two values of one quantity in one response, and our reading of ten published Bitcoin long short ratios found four numbers for one contract on a single venue. What is new here is the size of the effect over a year and the fact that it is driven by a clock rather than by a counting convention, which makes it predictable.
How far apart do the two baselines drift?
By a median 0.663 percentage points, and the middle half of readings runs from 0.261 to 1.498. To measure that without resting on today's tape, take Binance's BTCUSDT perpetual hourly closes and compute both figures at every one of the 8,760 hourly instants from 2025-09-22 09:00 UTC to 2026-09-22 08:00 UTC: the trailing figure against the close 24 hours earlier, the calendar figure against the close at the last 00:00 UTC. The window is gap free: all three references exist for every one of the 8,760 instants, and each hour of the UTC day carries exactly 365 of them. The gap exceeded 1 point at 3,251 of those instants (37.1 per cent), 2 points at 1,427 (16.3 per cent), and 5 points at 172 (2.0 per cent). Its largest value was 14.041 points, at 2026-02-06 00:00 UTC, where the trailing figure read -14.04 per cent while the calendar figure was exactly zero because the instant was midnight itself.

The gap is largest just after midnight, when the calendar baseline is minutes old and the trailing baseline is a day old, and smallest just before it, when the two nearly coincide. Median 1.298 points at 00:00 against 0.168 at 23:00. The band is the middle half of 365 days, and at 00:00 it alone spans 0.527 to 2.255 points.
The shape is not a discovery, it is arithmetic, and that is exactly why it is useful. At 00:00 UTC the calendar baseline is the current price, so the calendar figure is zero and the whole of the trailing figure is gap. Twenty three hours later the calendar baseline has aged to within an hour of the trailing one and the two nearly agree. Between those points the median drift falls steadily rather than monotonically: 1.298 points at 00:00, 0.848 at 12:00, 0.168 at 23:00, with four small reversals along the way that all sit well inside the middle-half band.
Read the band before the line. At 00:00 the middle half of days spans 0.527 to 2.255 points and the 90th percentile is 3.731, so the median is the centre of a wide distribution rather than a number you can subtract. At 23:00 the middle half has closed to 0.075 to 0.354. What the hour of day predicts well is the TYPICAL size of the gap; what it does not predict is the gap on any particular day, because that depends on where Bitcoin went in the hours the two windows do not share.
How often do the two baselines disagree on the direction?
At 2,240 of 8,760 hourly instants, which is 25.6 per cent, one figure was positive while the other was negative. That is the part worth carrying away, because the sign is what most readers take from a change figure. It is not a claim about rare days. In a year, roughly one hourly reading in four described Bitcoin as up on the day and down on the day at the same moment, on one venue's tape, depending only on which of the two conventions the figure used.

Direction disagreement tracks the clock. At 01:00 UTC the two figures pointed opposite ways on 186 of 365 days, at 23:00 on 18 of 365. The 00:00 bucket is left empty rather than scored as agreement, because the since-midnight figure is exactly zero at midnight and a zero has no sign.
The honest denominator matters here. At exactly 00:00 UTC the calendar figure is zero, which has no sign, so those instants cannot disagree and should not be counted as agreeing either. Dropping the 367 instants where the calendar figure was exactly zero, which is the 365 midnights plus two hours whose close happened to equal that day's 00:00 close exactly, leaves 2,240 disagreements out of 8,393, or 26.7 per cent, so the headline is unchanged either way. Within the day the gradient is steep: 51.0 per cent at 01:00 UTC against 4.9 per cent at 23:00. A reader who compares a since-midnight figure to a trailing one in the European morning sits in the upper half of that curve, between 33.8 and 40.0 per cent, rather than at its peak, which falls at 01:00 UTC in the middle of the European night.
Do exchanges that use the same definition agree with each other?
Not exactly, and the residual disagreement is a second, smaller effect that is easy to mistake for the first. All five of the trailing-window figures above should in principle be the same number. Sampled once a minute from 08:35 to 09:03 UTC on 2026-09-22, across 28 readings with a maximum capture span of 3.6 seconds, the gap between the highest and the lowest of the five ran from 0.026 to 1.292 percentage points with a median of 0.166 and a middle half of 0.078 to 0.350.

Five figures that all use a trailing window, read once a minute over 28 samples. The lower panel is the spread between them: median 0.166 percentage points, ranging from 0.026 to 1.292. It widens whenever the window edge rolls across a minute in which Bitcoin moved.
The instant on the cover chart sits near the WIDE end of that distribution: its five trailing figures spanned 1.129 points against a median of 0.166, because the window edge had just crossed a minute in which Bitcoin had moved. Quoting that instant as typical would be a smaller version of the error this whole post is about, which is why the range is above and not just the reading.
That residual is not venue price disagreement, and the same 28 readings decide it. Split each reading into its two ends. The five venues' LAST prices sat a median 2.51 basis points apart, from 1.06 to 5.26. Their BASELINE prices sat a median 14.58 basis points apart, from 1.97 to 124.83. Compared reading by reading, the far end was wider than the near end at all 28 of the 28 readings, by a median factor of 6.5, by as little as 1.1 and by as much as 45.7. Our Athenum study of the Bitcoin index price found the same thing about the near end from a different direction, putting the disagreement among three venues' USDT-quoted index prices at a median of 1.19 basis points.
What produces the spread is therefore the OTHER end of the window, the reference price, and that is the end the venues document least. Binance is the only one of the five that hands you the window's start and end instants: it returns openTime and closeTime with the figure, and in this capture they were 86,419 seconds apart. Bybit, OKX and Bitget return a reference price with no timestamp on it, so a reader cannot tell which minute that price belongs to. Gate.io does not return a reference price at all: it publishes a change amount, and you recover the baseline by subtracting that from the last price.
You can watch the effect inside a single venue. Across the 27 minute-boundary transitions in the sample, Binance's own printed figure moved by a median 0.066 percentage points from one minute to the next and by as much as 0.940 points. That largest move, between 08:38:22 and 08:39:25 UTC, came with a last price 51.20 dollars lower and a reference price 711.00 dollars higher: the window edge had dropped a minute in which Bitcoin had jumped, and almost none of those 0.940 points was current price action. A figure that can move that far while the price barely moves is a figure whose second decimal is not information.
Does the same split appear in metrics other than price?
Yes, and it is worth checking on a number that no single exchange publishes. Athenum reads Bitcoin perpetual open interest from Binance, Bybit, OKX, Bitget, Hyperliquid and Deribit into one normalized hourly series. At 2026-09-22 07:00 UTC, the last complete hour, those six venues summed to $24.67B. Every figure below is that sum and its parts, so the dollar column re-adds to the total and the shares to within a rounding step of a hundred. Against the same series 24 hours earlier at 2026-09-21 07:00 UTC, which read $23.06B, the change is +6.96 per cent. Against the 2026-09-22 00:00 UTC reading of $24.87B it is -0.81 per cent. One series, one stamp, two baselines, 7.77 points apart and opposite in sign.

Bitcoin perpetual open interest at 2026-09-22 07:00 UTC, $24.67B summed across the six venues shown. The same series reads +6.96 per cent against 24 hours earlier and -0.81 per cent against 00:00 UTC. Four of the six venues flip sign between the two baselines, Deribit most widely at +6.02 against -7.04 per cent; OKX and Bitget keep their sign and lose most of their size.
The venue level makes the point harder to dismiss as an aggregation artifact, and it also shows the limit of it. Four of the six venues carried a positive trailing figure and a negative calendar figure at that stamp: Deribit at +6.02 against -7.04, Bybit at +10.22 against -2.66, Hyperliquid at +5.87 against -0.78, Binance at +5.02 against -0.09 per cent. Read those four with their sizes rather than as four equal cases. Deribit and Bybit flipped by 7.04 and 2.66 points, which is a real reversal; Binance flipped by 0.09 points, which is a sign change and nothing more, and it is invisible in the lower panel. The other two kept their sign and lost most of their size: OKX read +4.31 per cent against +1.53, Bitget +12.05 against +0.07. So the baseline moved the MAGNITUDE on all six, and of the four direction changes, three were worth more than half a point and the fourth was 0.09. One caveat belongs next to those numbers: each hourly row of this series is an average of within-hour samples rather than an instantaneous reading, so both baselines are hour-averaged in the same way and the comparison between them is like for like, but neither is a close.
Is this the same as asking where to cut the trading day?
No, and the difference decides whether the effect is real or noise. Our Athenum study of Bitcoin realized volatility asked what happens when you move the daily boundary, found a 6.42 point swing across the 24 possible cut points, and then inverted its own striking reading: reshuffling the order of the returns produced a median spread of 6.14 points from noise alone, with 44 per cent of the draws at or above the observed 6.42, and a block bootstrap on the same page put the null higher still, so the boundary effect was indistinguishable from the estimator's own noise.
A percentage change is a different object. Volatility is a statistic estimated from a sample, and re-cutting the sample moves the estimate for reasons that include chance. A change figure is not estimated. It is a comparison of two prices, both of them observed, and moving the baseline swaps one observed price for another by a known amount. There is no estimator and therefore no estimator noise to hide behind: if the calendar baseline is 86,581.40 dollars and the trailing baseline is 83,483.20, then the two figures differ, exactly and repeatably. That is why this post reports a gap distribution and a sign-flip rate rather than a significance test. Testing whether the gap is non-zero would be testing whether subtraction works.
Our own corpus is not clean on this point either. The Athenum Coinbase premium post from 2026-05-14 carries a metrics table with a bare "24h Change" column and no statement of which baseline it uses. On the evidence above that column is under-specified, and naming it here is cheaper than leaving a reader to find it.
How do you check which baseline a number is using?
Five steps, all on keyless public endpoints, and the whole check takes about a minute.
1. Re-derive the baseline instead of trusting the label. Divide the last price by one plus the change, and you have the reference price the venue used: 85,763.20 dollars against +2.533 per cent implies 83,644.49, within a rounding step of the 83,644.70 Binance publishes as openPrice. The 21 cent miss is the printed percentage being rounded to three decimals, which is the same point as step 4.
2. Compare that reference to the price at the last 00:00 UTC and to the price 24 hours before your read. Whichever it matches is the convention. On the venues that publish both, the labels do the work for you: OKX names sodUtc0 and sodUtc8, Bitget names openUtc.
3. Note the time of day before comparing two venues. If you are reading at 02:00 UTC, a calendar figure covers two hours and a trailing figure covers twenty four, and they are not comparable at all. If you are reading at 23:00 UTC they nearly are.
4. Look for a published window. Binance returns openTime and closeTime with the figure. If a venue gives you a reference price with no timestamp, or no reference price at all, treat the second decimal as unknown rather than as zero.
5. Capture every venue in one pass and record how long the pass took. A capture spread over minutes will manufacture a cross-venue difference that looks exactly like this one. Each of the 28 captures behind this post took between 2.2 and 3.6 seconds.
If you want to run the subtraction rather than read it off a screen, the Athenum ROI calculator does the two-point version and the Athenum CAGR calculator does the annualized one. Both are free to use and neither puts the calculation behind an account.
What this does not show
Seven limits, stated rather than buried. The year-long measurement is Binance's BTCUSDT perpetual only, so the sizes above are one venue's tape and another venue's history would give slightly different quantiles; the STRUCTURE, which is arithmetic, would not change. The cross-venue sampling window is 28 readings over 28 minutes on one day, so the 0.166 point median spread describes that window and is not an estimate of a long-run average. The asset is Bitcoin, and a thinner market will drift further between two baselines, not less. The hourly closes behind the year-long measurement are Binance's own, so that history inherits one venue's clock and one venue's idea of where an hour ends. Nothing here tests spot venues, only perpetuals, and a spot ticker can use a third convention again. The open interest figures are the sum of the six venues named, and the feed also carries a total field that runs about 169 million dollars above that sum; this post quotes the sum it can show and makes no claim about the difference. And no claim is made about which convention is correct: a trailing window and a calendar day are both honest answers to different questions, and the defect is only ever in comparing one to the other.
What survives is narrow and checkable. Across 8,760 hourly readings of one Bitcoin perpetual over a year, the trailing and the calendar version of the same 24 hour change differed by a median 0.663 percentage points, by more than 2 points at 16.3 per cent of readings, and disagreed on the direction at 25.6 per cent, with the disagreement rate falling from 51.0 per cent at 01:00 UTC to 4.9 per cent at 23:00. On 2026-09-22 the two conventions put the same Bitcoin perpetual 4.58 points apart at one second, and the same split ran through the six-venue open interest sum at +6.96 per cent against -0.81.
Athenum reads live derivatives data from Binance, Bybit, OKX, Bitget, Hyperliquid and Deribit onto one clock, which is what keeps a comparison like this one honest, and the 34 free calculators beside that feed ask for no account, no email, and impose no usage limits. If you want the cross-venue view the open interest numbers here came from, start a free 7 day Pro+ trial.
One terminal. All the data.
Liquidations, orderbook depth, whale walls & open interest from 4 exchanges, all real-time, in one place.
No credit card required
