Table of Contents7 sections
- What is the Bitcoin index price, and can you check it yourself?
- How often does Binance republish the index recipe?
- Why does the same arithmetic close on OKX and not on Binance?
- How far apart are four venues' Bitcoin prices at the same instant?
- What does a normalized cross-venue feed add to this?
- How can you check this yourself?
- Limits
Practise with worked lessons
- Align a stop trigger with the price series that actually activates it
Last trade, mark and index price can differ at the same moment. Compare all three triggers on one timeline and separate stop activation from execution.
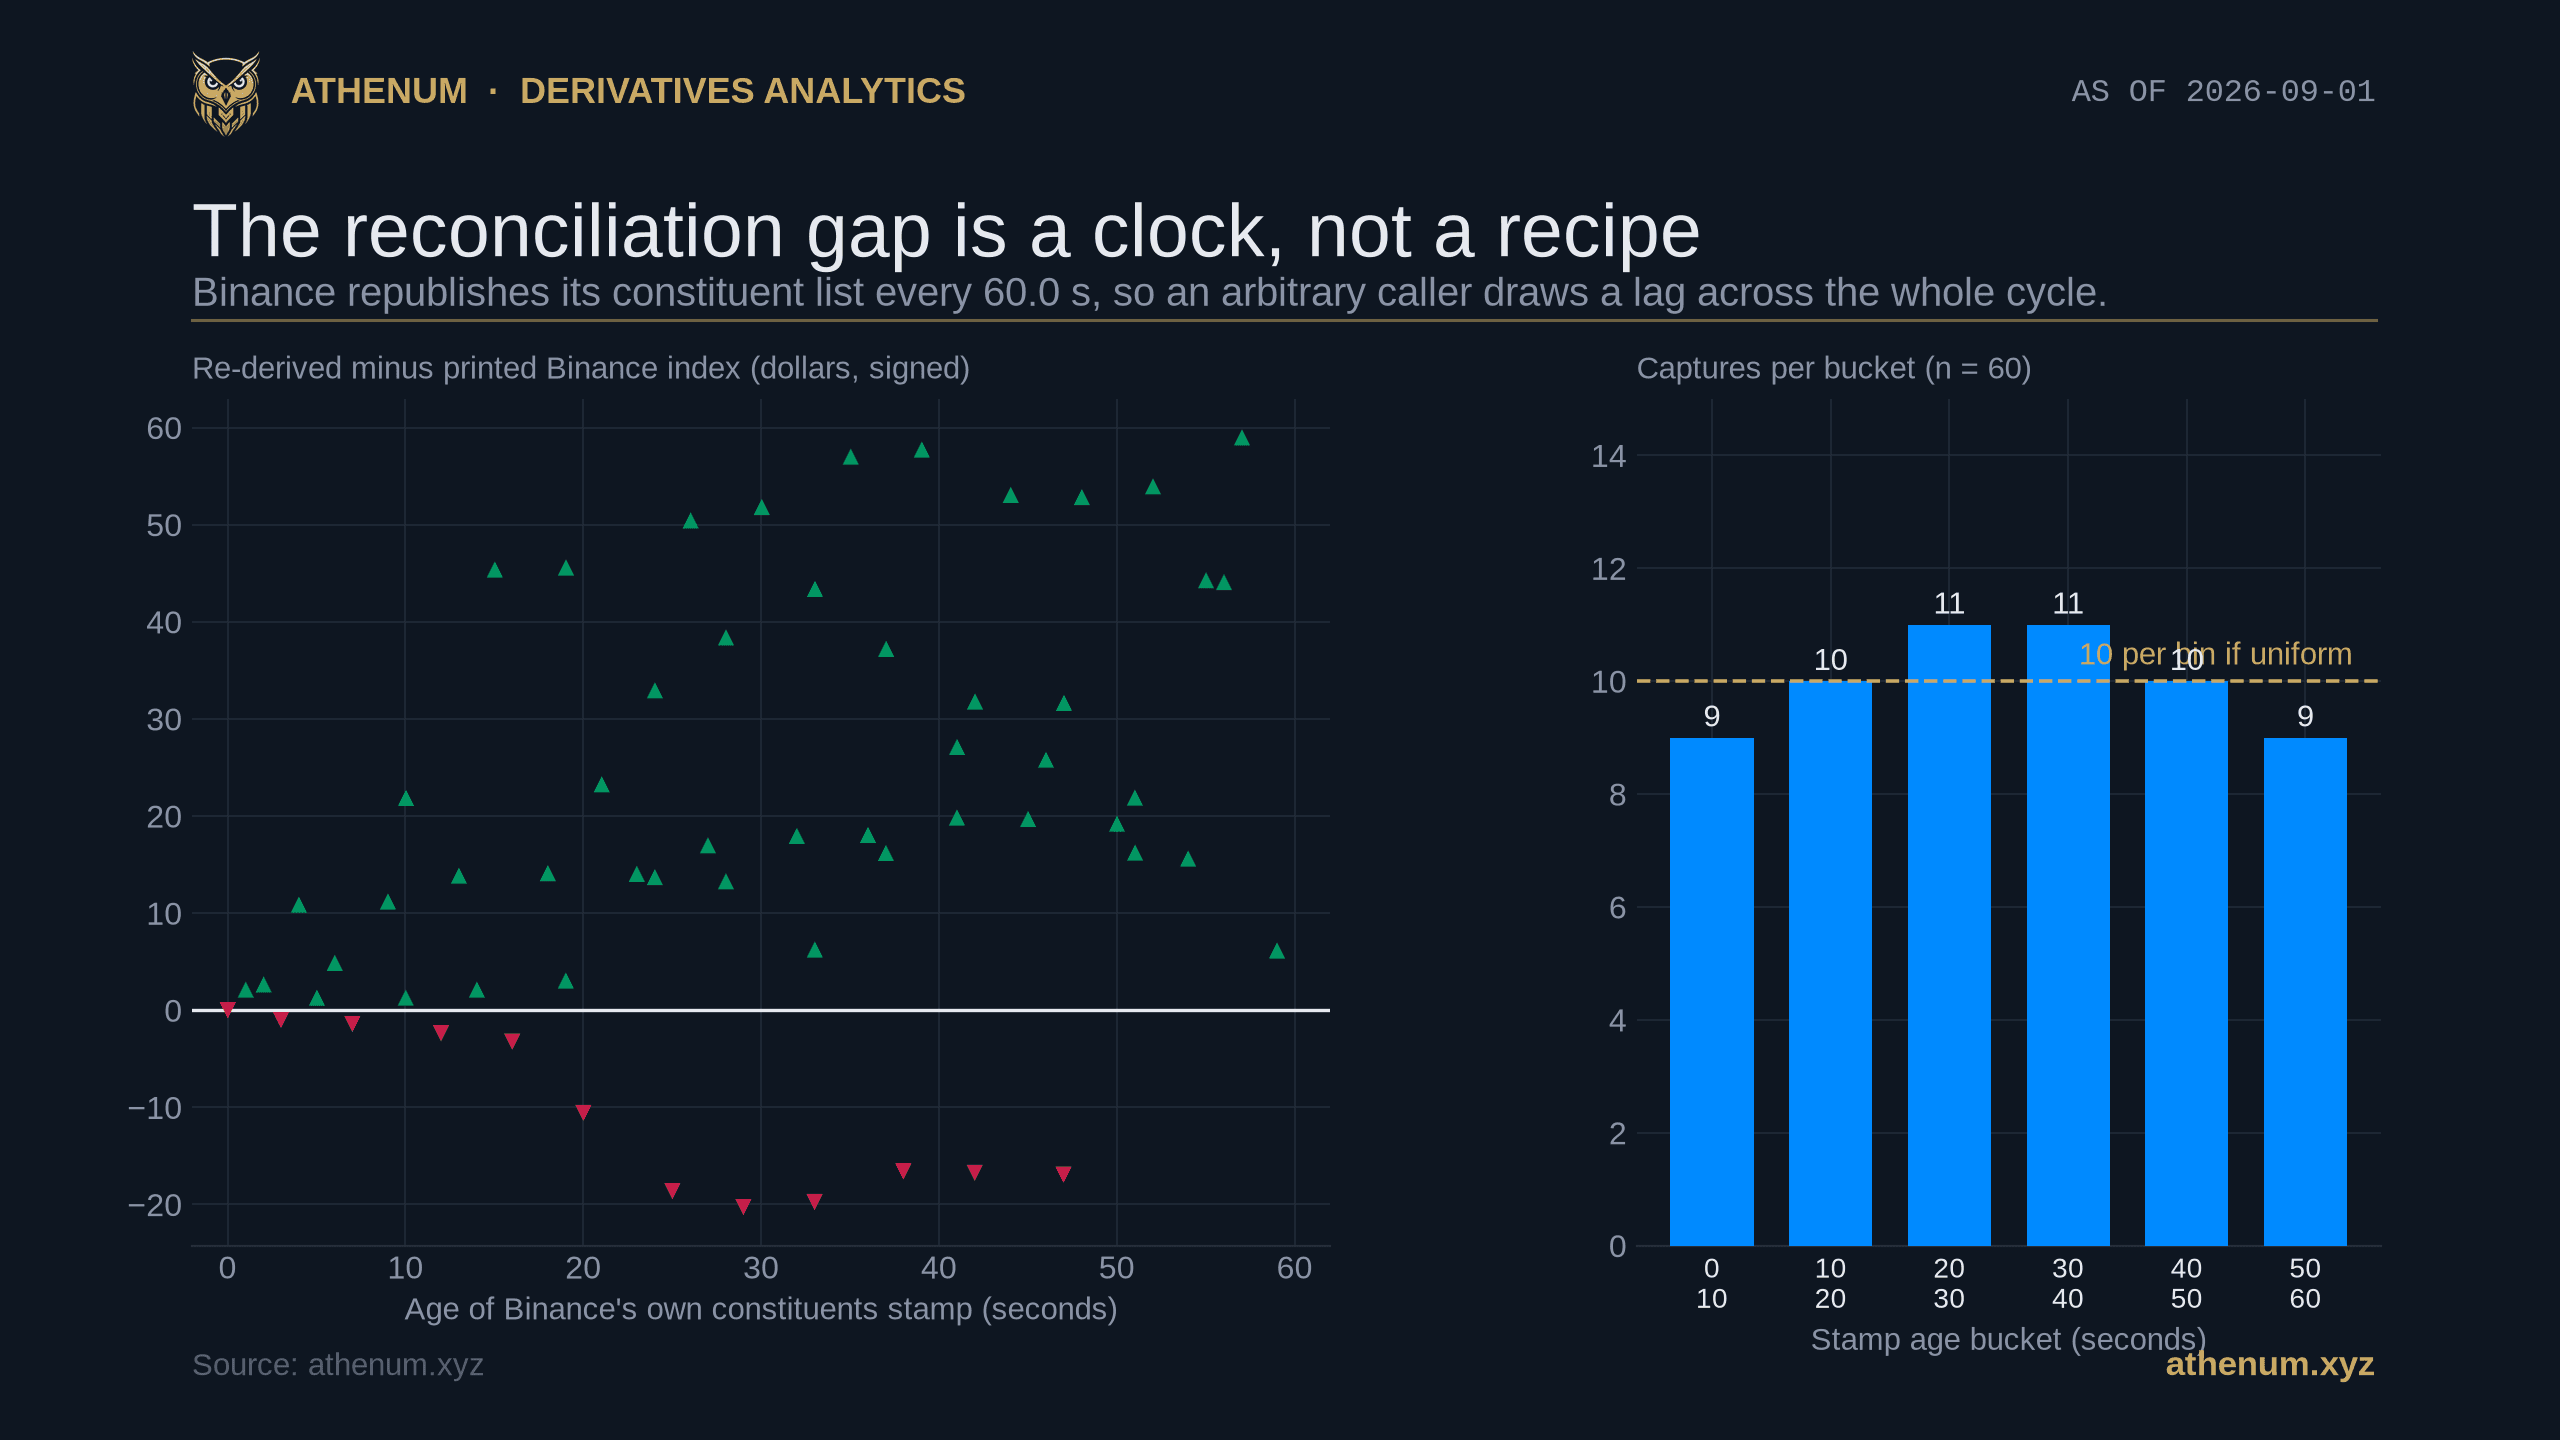
TLDR. A perpetual is liquidated against an index, and two large venues publish the recipe for that index on endpoints that need no key, so you can in principle audit the number that closes your position. We showed in August that those recipes are fixed preset weight grids rather than volume weighted averages, and that the sums reproduce. This post measures the thing that write up left as a phrase, "seconds of drift", and the answer is a fixed clock. On 2026-09-01, across 60 concurrent captures, Binance's constituents endpoint republished on a period of 60.0 seconds, five distinct timestamps with four gaps measured at 60.008 to 60.009 seconds. For an arbitrary caller, whose arrival is unrelated to that period, the lag between the payload and the live index is therefore a uniform draw from 0 to 60 seconds, and our captures span the full cycle, 0.0 to 59.0 seconds with a median of 29.5. The reconciliation gap that lag produces is signed, not a one way error, running from minus 20.27 to plus 58.99 dollars with 12 of 60 captures below zero, and its size grows with the age of the stamp (rank correlation +0.61 against the absolute gap; captures under 10 seconds old missed by a median of 2.12 dollars and captures at 45 seconds or older by 23.85). On OKX, where the components and the printed index share one payload and one timestamp, there is no drift and the arithmetic does not merely come close: the printed index equals the weighted sum truncated to the venue's 0.1 dollar tick in 60 of 60 captures, exactly.
What is the Bitcoin index price, and can you check it yourself?
It is the reference price a venue builds from a basket of outside spot markets, and it is what your liquidation is actually measured against. A perpetual has no expiry to pull it back to spot, so the venue anchors it: the mark price used for liquidation derives from an index price, and the index price is composed from constituent spot exchanges at weights the venue picks. We set that chain out in the Athenum explainer on mark, index and last price and in the Athenum premium index explainer.
Two things in this post are not new and it would be dishonest to present them as findings. An Athenum write up published on 2026-08-18 established that the weights are a fixed grid rather than a volume weighted or median basket, that you can recompute the index from them, and that the small Binance residual comes from two separately stamped endpoints rather than a different weighting. That page also carries a correction to the two on-domain explainers linked above, both of which still describe the index as a volume weighted average and are wrong on the two venues measured here. And the discipline of reading every endpoint in one pass is not ours to teach either: we learned it by getting it wrong in the Bitcoin futures roll post, where marks and indexes read about three minutes apart manufactured a spread that a single pass removed.
What this post adds is the number that phrase was standing in for. "Seconds of drift" turns out to be a fixed publication period, which makes the error predictable rather than mysterious, and it turns out the two venues are not doing the same thing at all.

The two published recipes on 2026-09-01: Binance weights its own spot book at 43.478261 percent of its own index, OKX weights itself and Binance equally at 25 percent each, and three of Binance's eight constituents do not appear in OKX's five.
Venue and index | Constituents on 2026-09-01 | Weight of the venue's own spot book | Weight grid |
|---|---|---|---|
Binance BTCUSDT | 8 (Binance, OKX, Coinbase, Bybit, Bitget, KuCoin, MEXC, Gate.io) | 0.43478261 | forty sixths |
OKX BTC-USDT | 5 (Binance, OKX, Coinbase, Bybit, Bitget) | 0.25 | sixteenths |
Both grids were unchanged from the 2026-08-18 measurement, fourteen days earlier, and unchanged across all 60 of today's captures: Binance's eight weights summed to 0.99999999 every time and OKX's five to exactly 1.0, with no membership change on either.
How often does Binance republish the index recipe?
Once every 60.0 seconds, on a fixed period rather than on price movement.
Binance stamps its constituents response with its own time field. Across a four minute run that field took five distinct values, with gaps of 60.008, 60.009, 60.009 and 60.008 seconds. A separate verification pass over its own captures measured the same period, and a probe polling every two seconds caught two further transitions at 60.010 and 60.008 seconds. The endpoint is on a one minute clock, and the period is stable to about ten milliseconds, so 60.0 seconds below is a rounding of a measured 60.008 to 60.010 rather than a round number we assumed.
Binance's own API reference for this endpoint documents its method, its request weight and its response fields, and says nothing at all about how often the data behind it refreshes. The period above is measured, not published, which is the main reason it is worth writing down.
That single fact fixes the shape of every reconciliation error a caller can get. Because the payload republishes on a fixed period and an arbitrary caller arrives at a moment unrelated to that period, the age of the constituents data when you read it is a uniform draw from 0 to 60 seconds. Our captures span the full cycle, 0.0 to 59.0 seconds with a median of 29.5, and fall 9, 10, 11, 11, 10 and 9 into the six ten second buckets.
Those bucket counts are worth one sentence of caution, because they look like stronger evidence than they are. We polled at roughly four to five second intervals against a sixty second period, so successive captures step the phase a few seconds at a time and walk the cycle rather than sampling it independently. A flat histogram is therefore what the sampling design produces, and what it actually demonstrates is that the period stayed stable for the whole run, not that an arbitrary caller's lag is uniform. That second claim follows from the fixed period plus arrival being independent of phase, which is an argument rather than a measurement. Either way the practical consequence is the same: there is no "usually fresh" to lean on, and you are as likely to catch a 55 second old list as a 5 second old one.
The index price itself, of course, does not wait. So the gap between the recipe and the number it is supposed to produce is a stale price problem with a known distribution, and that is a much more useful thing to know than a single anecdote about how big the error was once.
Why does the same arithmetic close on OKX and not on Binance?
Because OKX ships the inputs and the output in one payload under one timestamp, and Binance ships them on two endpoints running on different clocks.
The test is deliberately dull: take each constituent the venue publishes, multiply its price by its published weight, sum, and compare against the index price the venue itself prints. We ran it 60 times over four minutes on 2026-09-01, fetching every endpoint concurrently, with a median capture duration of 0.47 seconds and a worst case of 0.92, so both sides of each comparison are read inside the same second by construction.
On Binance the result is signed and wide. The gap ran from minus 20.27 to plus 58.99 dollars, with 12 of the 60 captures below zero and a median of plus 16.22. Stating that as an absolute "misses by about 18 dollars" would be wrong in a specific and checkable way, because a reader running the same script for two minutes will get a negative number and conclude we cannot count. The sign is not noise either: it tells you which direction Bitcoin moved during the lag.
The evidence that the lag is the cause, rather than a hidden term in the formula, is that the gap tracks the age of the stamp. The rank correlation between stamp age and the size of the gap is +0.61 over our 60 captures, and the plain linear correlation on the same captures is +0.53; a separate verification pass, on its own smaller set of captures, measured +0.83. We give all three rather than the friendliest one, because the spread between them is itself the point of the next paragraph. Splitting rather than correlating makes it plainer: the 9 captures that caught a stamp under 10 seconds old missed by a median of 2.12 dollars, the 14 that caught one at 45 seconds or older by 23.85, and the single capture that caught the stamp 13 milliseconds after it refreshed came in at minus 0.0008 dollars, which is zero to the cent.
That correlation is +0.61 and not +0.95, and the difference is worth naming rather than smoothing over. The gap is not the lag; it is the lag multiplied by how fast Bitcoin happened to be moving during it. A 59 second old stamp on a quiet minute produced 6.16 dollars in our run and a 57 second old stamp on a busier one produced 58.99. So the honest claim is bounded rather than deterministic: the staleness sets the ceiling and the market decides where inside it you land. None of this makes the Binance index wrong. It makes the published recipe unusable as a live audit of the published index, which is a narrower and more specific complaint.

On OKX the arithmetic does not approximately close, it closes exactly: the printed index is the weighted sum truncated to the venue's 0.1 dollar tick in all 60 captures on 2026-09-01.
On OKX the same sum lands within 0.0012 to 0.0974 dollars of the printed index, always positive, never once reaching 0.1. It would be easy, and wrong, to report that as a small measurement error with a median and an interquartile range. Tested as an identity instead of summarised as a distribution, the floor of the weighted sum times ten, divided by ten, equals the printed index in 60 of 60 captures. OKX truncates to its 0.1 dollar tick. The arithmetic closes exactly, and the apparent spread is the truncation remainder, which is bounded by the tick; we did not test how it is distributed inside it, and on 60 captures the histogram is visibly lumpy. A dispersion quoted for a deterministic remainder would have overstated the uncertainty and understated the result.
The identity also passes a test it was not fitted to, on a different day and about thirteen and a half thousand dollars lower. The Athenum write up linked above reports of a single OKX pull that "it recomputes to 64,387.69 against a published index of 64,387.60, a nine cent gap". Truncate 64,387.69 to the 0.1 dollar tick and you get 64,387.60. We had the instance in front of us a fortnight ago, printed it, and called it a gap. That is the ordinary shape of this kind of thing: the residual looked like the size of an error, so nobody asked whether it was the shape of a rule.
How far apart are four venues' Bitcoin prices at the same instant?
Further than the venues disagree with each other, because most of the distance is the quote unit rather than the asset.

Four Bitcoin index prices read in one concurrent sub-second pass, 110 times on 2026-09-01: the three USDT indexes overlap and swap ranks, while the USD index sits below all three in 110 of 110 captures, and below their mean by a median of 26.74 dollars.
We read the Binance, OKX and Bybit index prices, all quoted in USDT, together with the Deribit BTC index, quoted in dollars, in one concurrent pass, 110 times at about three and a half second intervals, median capture duration 0.43 seconds and worst case 0.99. Among the three USDT indexes the disagreement is real but small and has no stable order: median 9.28 dollars, interquartile range 3.49 to 15.30, minimum 0.39, maximum 29.64, which on a Bitcoin near 77,988 dollars is a median of 1.19 basis points. Ranking those three by whose index reads higher is close to meaningless at that scale, and the band in the chart crosses zero constantly.
The fourth venue is the one number in this post whose sign never flips. Deribit's dollar index sat below the mean of the three USDT indexes in 110 of 110 captures, by a median of 26.74 dollars, interquartile range 25.25 to 27.79, full range 22.48 to 36.24. In relative terms that is a median of 3.43 basis points.
That is not Deribit pricing Bitcoin differently. It is USDT not being worth a dollar, and we checked the explanation against two venues neither index uses for this purpose: at the same moment on 2026-09-01, USDT traded at 0.9996 dollars on Coinbase and 0.99967 on Kraken, discounts of 4.00 and 3.30 basis points. The measured index wedge of 3.43 basis points sits between them. A USDT quoted index reads high by roughly the amount the unit is cheap, and any cross venue comparison mixing a USD settled board with USDT settled boards inherits that wedge before a single trade is considered. Note the size ordering, because it is the practical point: the unit effect is about three times the entire disagreement among the three USDT venues.
What does a normalized cross-venue feed add to this?
It shows where the same instrument disagrees with itself across venues at one timestamp, which no single board can.

Athenum's normalized cross-venue view for the hour ending 2026-09-01 07:00 UTC: Binance holds 39.5 percent of 21.62 billion dollars in Bitcoin perpetual open interest, and the five eight-hour boards settled funding between 0.0074 and 0.0123 percent.
For the hour ending 2026-09-01 07:00 UTC, Athenum's normalized feed put aggregate Bitcoin perpetual open interest at 21.62 billion dollars, with shares of Binance 39.5 percent, Bybit 19.4, Hyperliquid 14.0, Bitget 12.2, OKX 10.0 and Deribit 4.2. Over the same interval the five boards settling on an eight hour clock printed rates from 0.007372 percent on OKX to 0.012293 percent on Deribit, a dispersion of 0.004921 percentage points per interval, or 5.39 percentage points a year at three settlements a day. The free funding rate calculator does that conversion.
The sixth board is excluded from that range on purpose, and the reason is a mistake we have published and corrected. Hyperliquid settled 0.001250 percent over the same hour, which looks like far the cheapest number on the board and is not comparable, because it is charged on a different schedule. Our census of funding intervals as a per symbol property found 1,422 of 2,536 perpetual contracts settling on something other than the eight hour clock, and it exists because an earlier Athenum post told readers to annualize by venue. The chart above does put all six in one column, which is why the sixth is drawn in a different colour and labelled: ranking them against each other without that label is the error.
One coincidence deserves naming before a reader builds on it. Binance holds 39.5 percent of aggregate open interest and weights its own spot book at 43.478261 percent inside its own index. Those numbers are close, they concern the same venue, and they have nothing to do with each other: one is a positioning share our feed measures hour by hour, the other is a constant Binance chose.
How can you check this yourself?
Every figure above comes from a public endpoint that needs no key and no account, and the method is four steps that each remove one way of getting it wrong.
Read the venue's own timestamps, not just its numbers. Comparing the time field on the constituents payload against the timestamp on the index response is the entire difference between an unexplained dollar residual and a 60 second refresh cycle. Where a payload carries the inputs and the output under one stamp, as OKX's does, there is nothing to reconcile in the first place.
Fetch concurrently, and report how long the pass took, the way you would report a sample size. A mark and an index read even a minute apart manufacture a spread that looks structural. Our own first, sequential probe this morning read the four venues over 68 seconds and printed a spread of 56 dollars where a concurrent pass 30 seconds later printed 27, so half of that first reading was our own capture rather than the market.
Test the identity before you report a spread. A residual that never changes sign and is bounded by a round number is usually a tick, a floor or a ceiling rather than noise. Checking whether the reconstruction rounds onto the print is one line, and on OKX it converts a vague "close to correct" into an exact statement.
Repeat enough times to see the distribution. One capture of the Binance gap would have supported any claim between minus 20.27 and plus 58.99 dollars, which is to say any claim at all about size and either claim about direction. Every headline number here carries its sample size and its range for that reason. The free APR to APY calculator is a quick way to see what a few basis points become once annualized and compounded, which is the step at which a 3.43 basis point unit effect stops looking like rounding.
Limits
Five, and they are the ones we would raise if someone else had published this.
The window is short. Sixty captures over four minutes and 110 over six and a quarter minutes describe one quiet morning on 2026-09-01, with Bitcoin between roughly 77,800 and 78,050 dollars. The 60.0 second cadence is the strongest observation because it repeated four times within two milliseconds of itself and was reproduced by a separate verification pass; the capture durations are the weakest.
The reconciliation test only runs on venues that publish their inputs. Binance and OKX return constituent lists with weights on keyless endpoints. Bybit and Deribit return an index value, and this measurement did not establish where or whether they document their composition, so they appear here only as printed prices.
We did not verify that a plain weighted sum is either venue's intended formula. On OKX the exact truncation identity in 60 of 60 captures is strong evidence for that venue while no constituent is excluded. Both our own earlier pages and the August write up note that venues apply deviation and staleness rules to constituents, and we did not observe such a rule fire, so the OKX result should be read as exact in the unstressed case rather than unconditionally.
We are one caller from one network location, so every latency and interval here is what this box saw. Relatedly, a second observer noted that OKX's payload timestamp is not monotonic across consecutive polls, which means edge nodes serve snapshots of differing age; the single payload property still holds, but OKX should not be described as offering a clean forward moving clock.
The USDT wedge is measured over six and a quarter minutes on one day. That it matches two independent spot quotes for USDT is strong support for the mechanism, not evidence about how the wedge behaves over weeks.
Every number above was read on 2026-09-01 from keyless endpoints at Binance, OKX, Bybit, Deribit, Coinbase and Kraken, and from Athenum's own normalized cross-venue feed. The 34 calculators sitting alongside that feed cost nothing to use, and ask for no account, no email address and no usage limit. If you want the terminal itself, it opens on a free 7 day Pro+ trial.
One terminal. All the data.
Liquidations, orderbook depth, whale walls & open interest from 4 exchanges, all real-time, in one place.
No credit card required

Athenum Analytics
Athenum Analytics is our three-person editorial team covering crypto derivatives, market data and macroeconomic context.