
Athenum Analytics
Athenum Analytics is our three-person editorial team covering crypto derivatives, market data and macroeconomic context.
Editorial responsibility and method
Who produces the articles
Our internal team of three handles research, preparation and data verification. Articles are carefully double-checked before publication. We publish under the organizational name Athenum Analytics; individual names and professional credentials are not presented here.
Sources and verification
We use our own market-data APIs and cross-check observations against trusted external sources, including FRED for macroeconomic series. The source, date, units and scope of a dataset matter: an exchange snapshot, a settled funding payment and a model calculation are different kinds of evidence.
Work you can inspect
Our public BTC/ETH pages disclose contracts, conversions, timestamps and missing observations. The Bitcoin baseline study supplies calculation code, source requests and aggregate downloads so readers can check the numerical result. Historical captures that could not be reproduced are identified explicitly.
Automation and AI assistance
The 24 September 2026 update was prepared with AI assistance, including drafting, translation and code. Automated calculations and live-source checks support the work; they do not by themselves establish independent human expert review. The research pages describe what was actually recalculated and the limits of that verification.
Corrections and updates
Send the article URL, the disputed statement and supporting evidence to our corrections address. The September revisions record material corrections on the affected articles, including changes to historical funding and correlation claims.
Profile information confirmed and updated:
Cost of Holding a Bitcoin Perp: Funding Passes the Round Trip Fee at the 18th Settlement
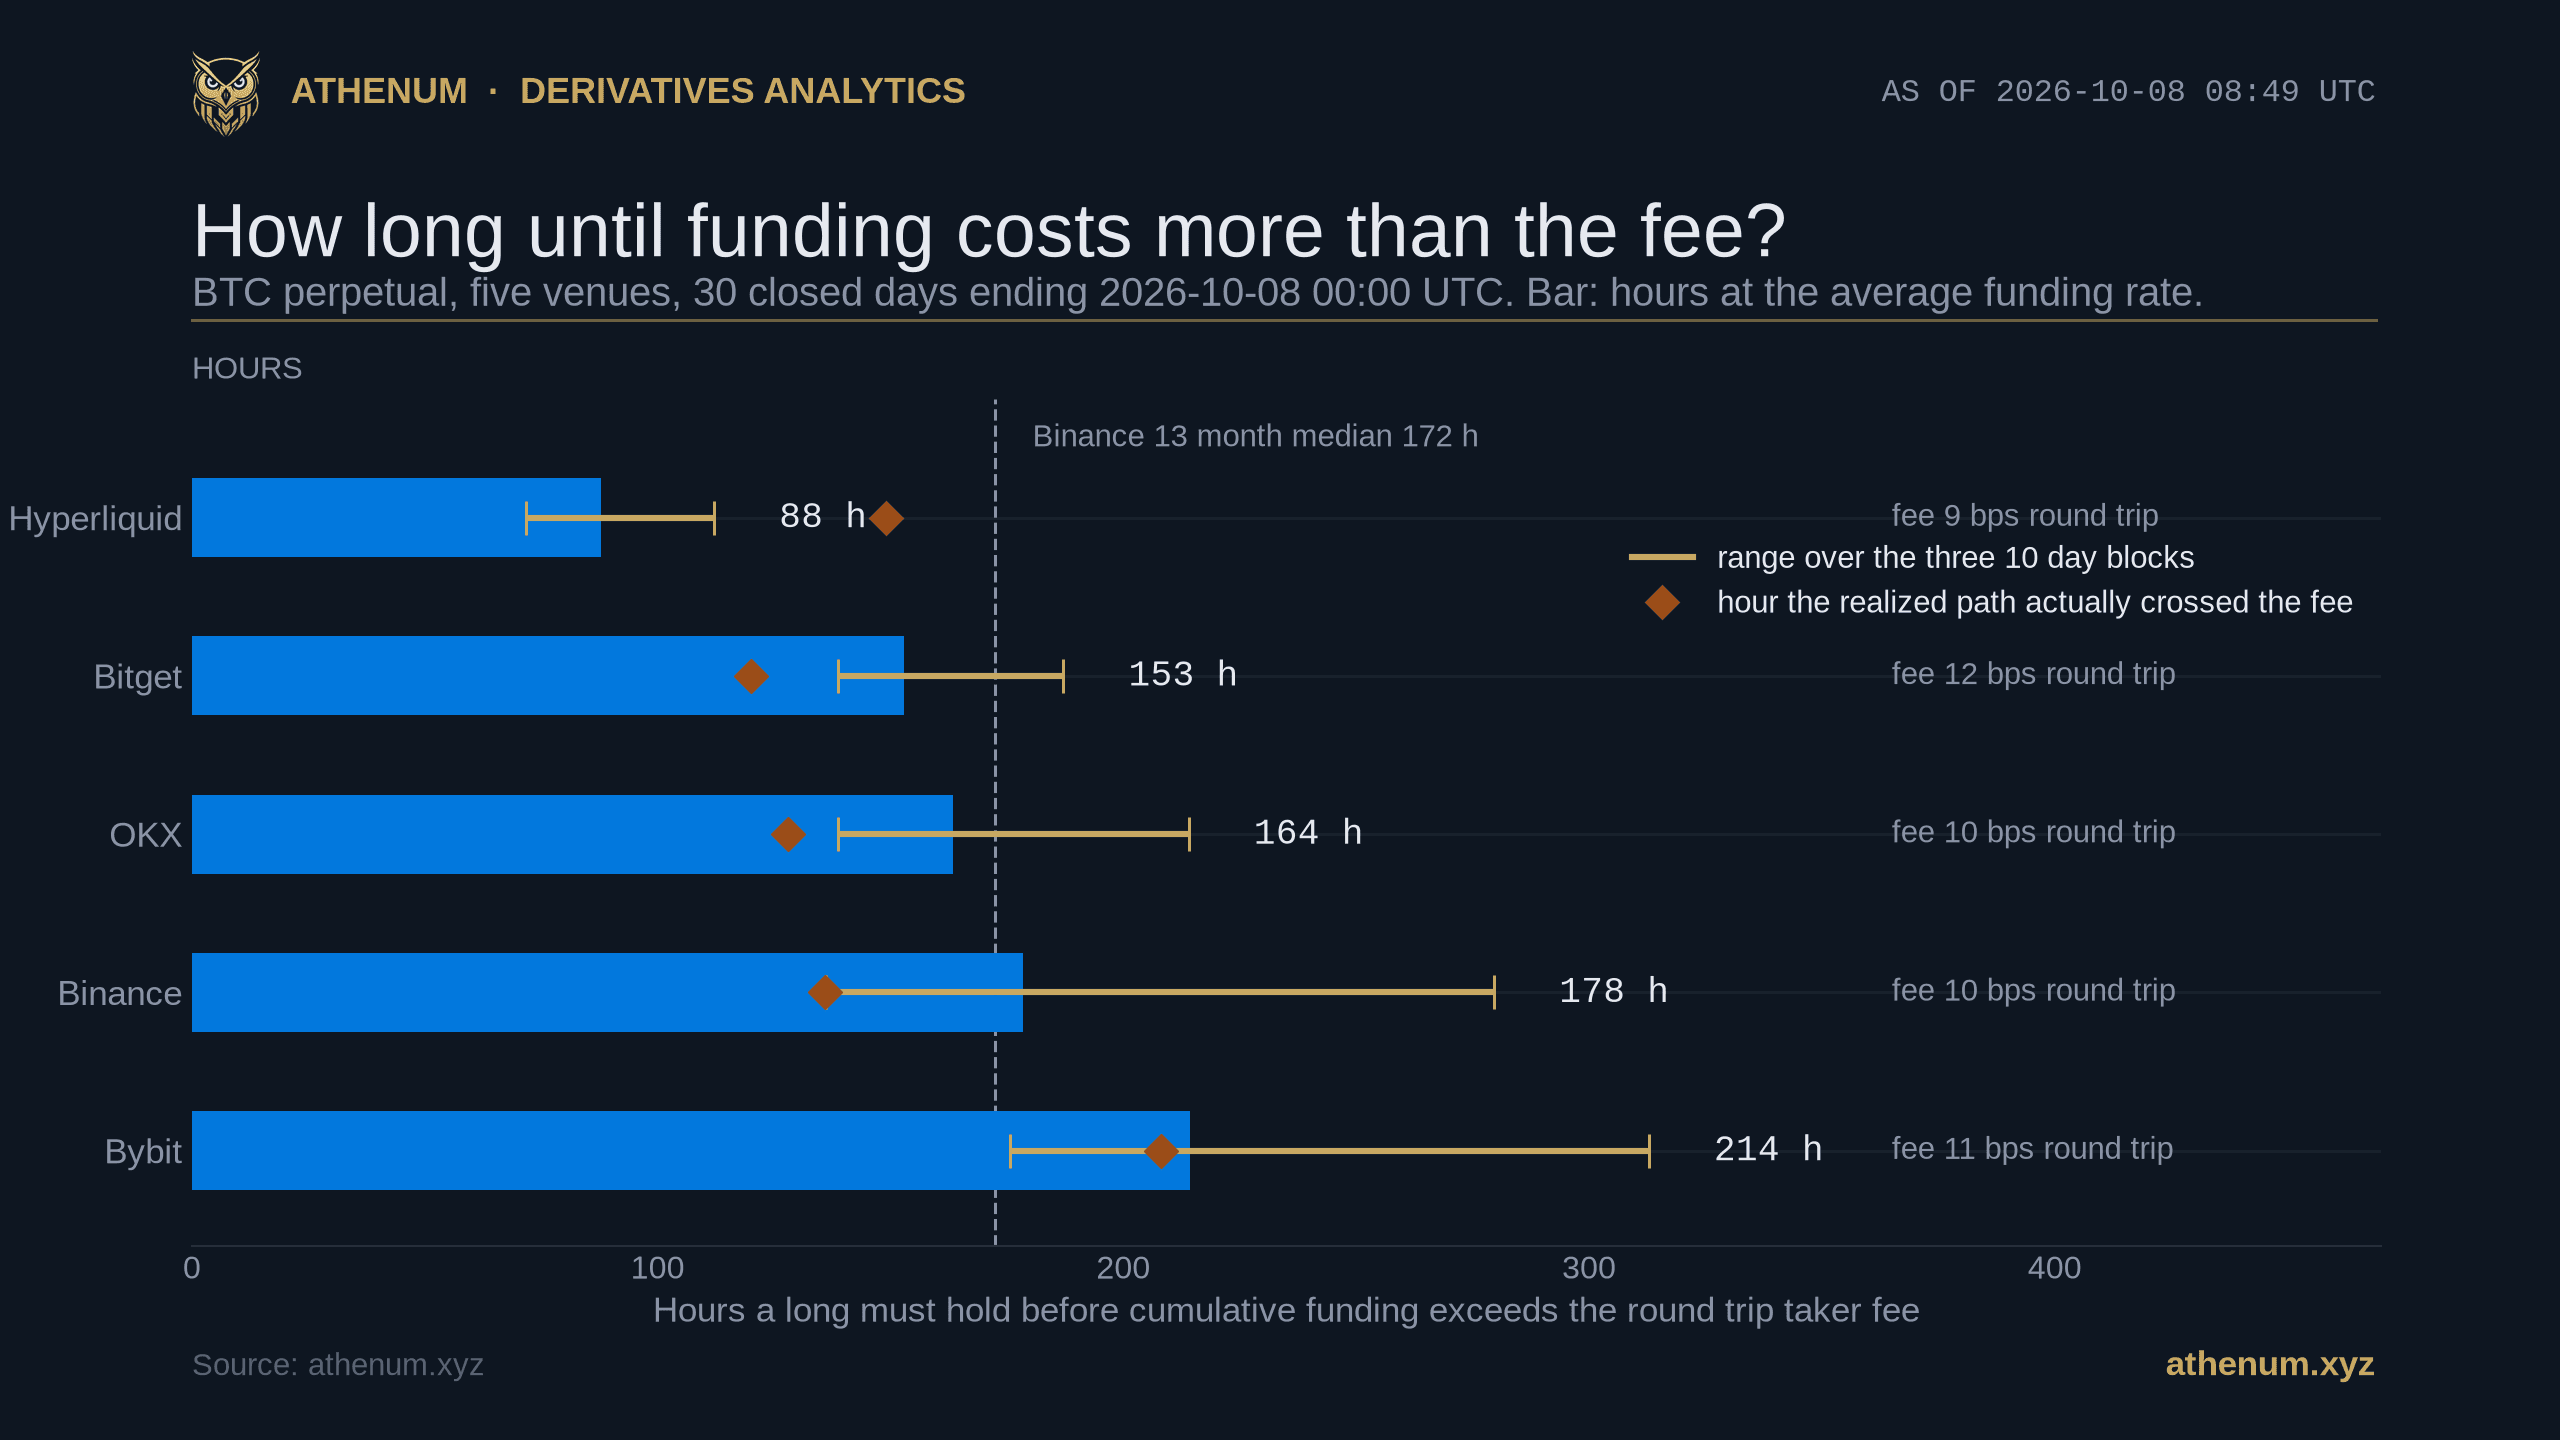
The cost of holding a bitcoin perp is usually compared venue by venue on the taker fee, and that is the smaller of the two numbers as soon as the position lives longer than a few days. Over the 30 closed days to 2026-10-07 a Binance long paid 40.33 basis points of funding against a 10 basis point round trip, so the funding bill passed the fee at the 18th of 90 settlements.
 Athenum Analytics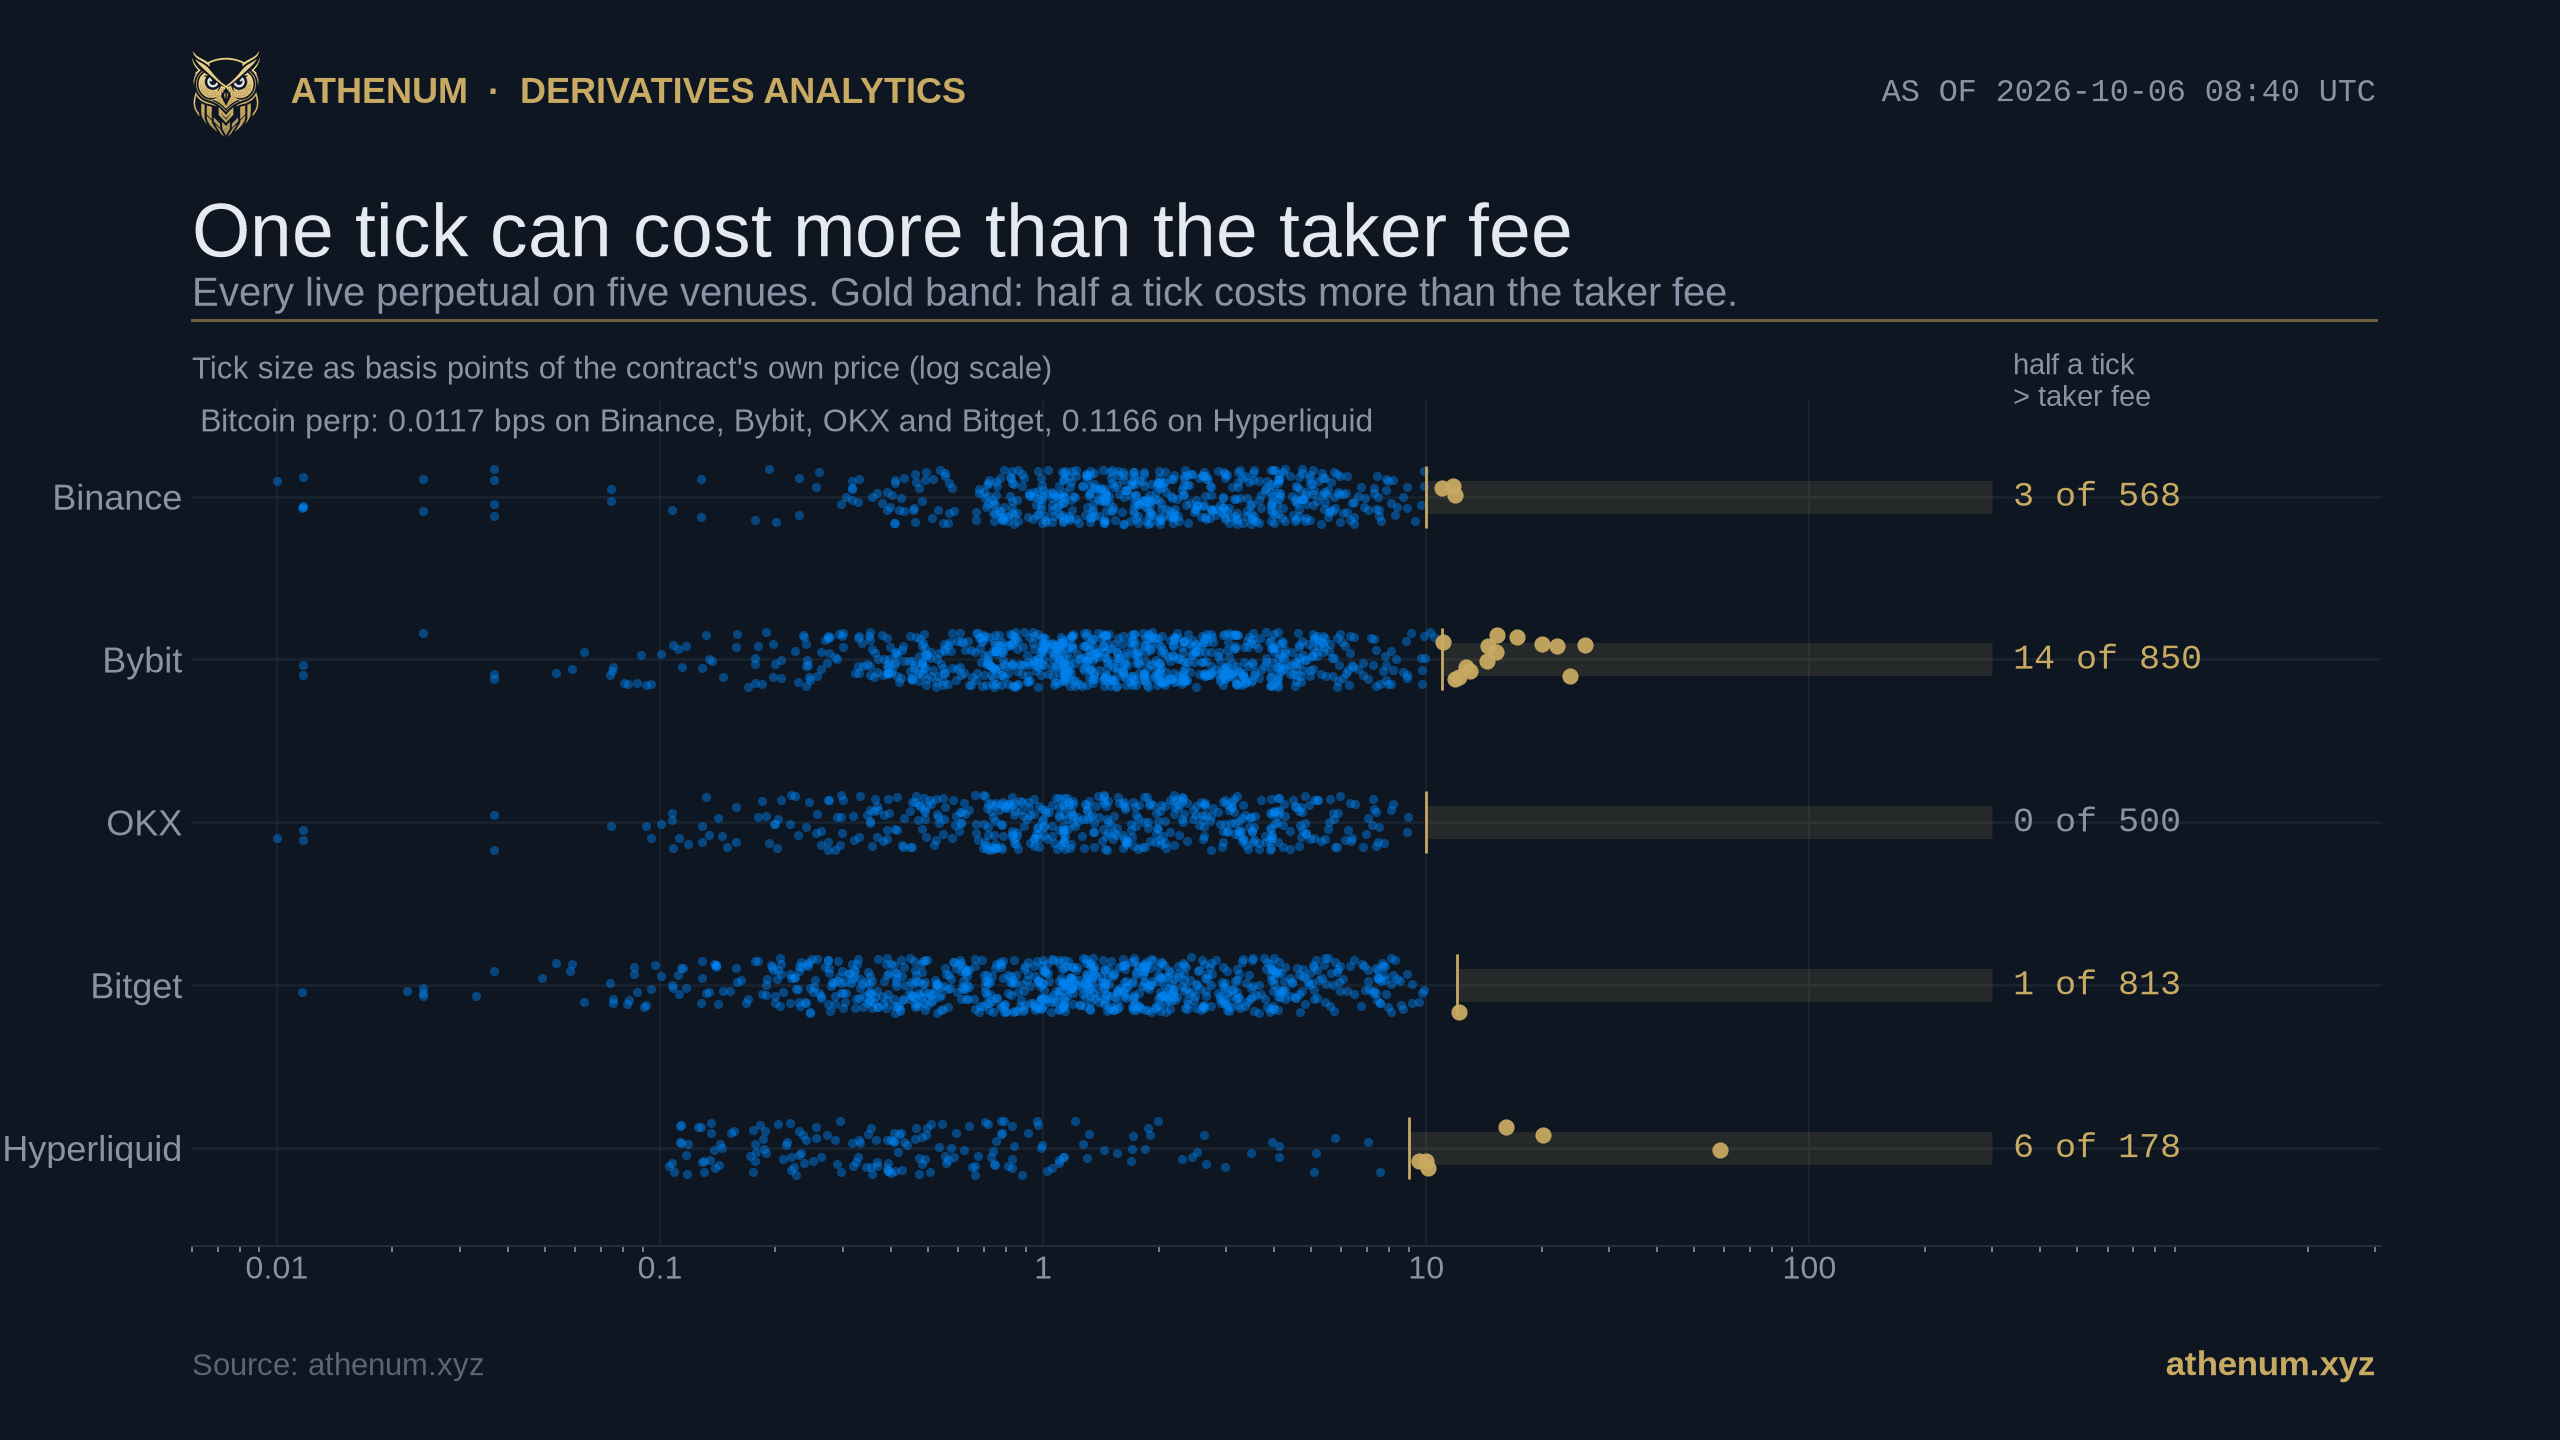
Tick Size vs Taker Fee: On 24 Perps Half a Tick Costs More Than the Fee
On a Bitcoin perpetual the taker fee dwarfs the price grid, and that is the comparison almost everyone generalizes from. Read across every live perpetual on five venues at 08:40 UTC on 2026-10-06, 2,909 contracts in all, it inverts on the long tail. The tick is a fixed number of decimal places.
Athenum Analytics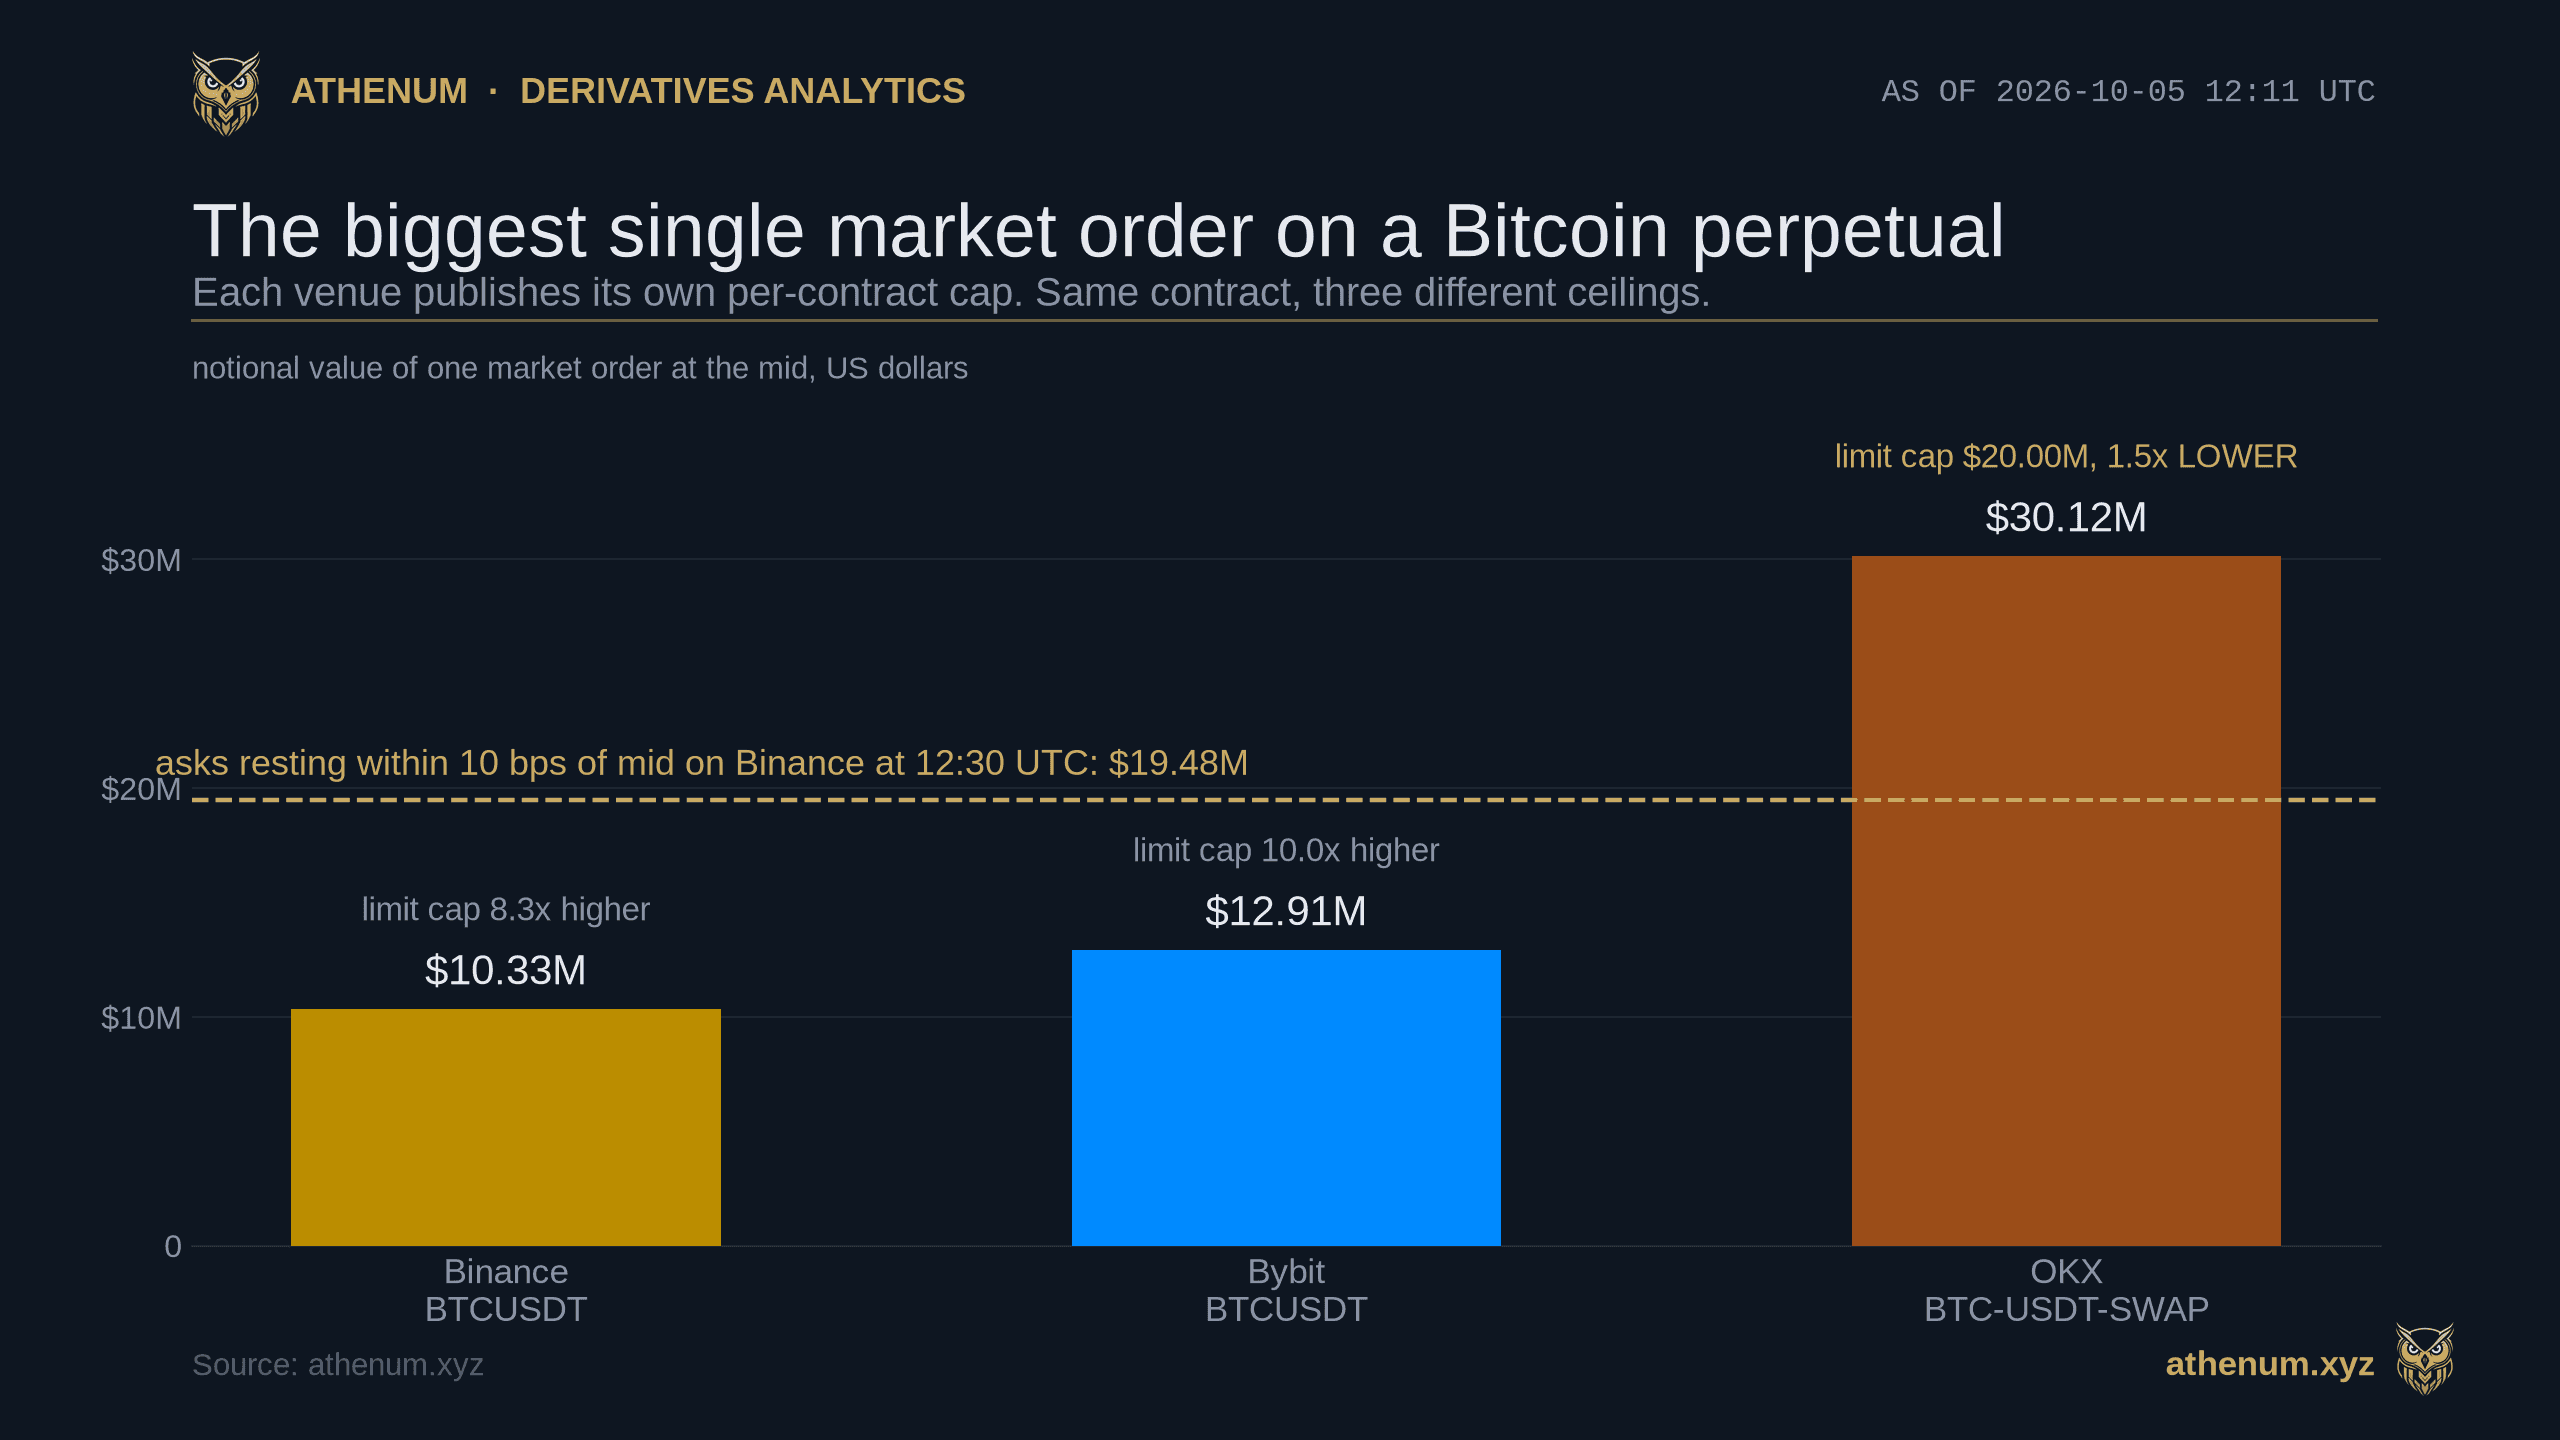
Maximum Market Order Size: Bitcoin Stops at $10.3M and a Typical Perp at $99,510
Binance, Bybit and OKX each publish a hard ceiling on how much one market order may take, and it is a different number from the limit order ceiling. On 2026-10-05 the Bitcoin perpetual stopped at $10.33M, $12.91M and $30.12M, while the median contract stopped at $99,510, $26,376 and $16,488.
Athenum Analytics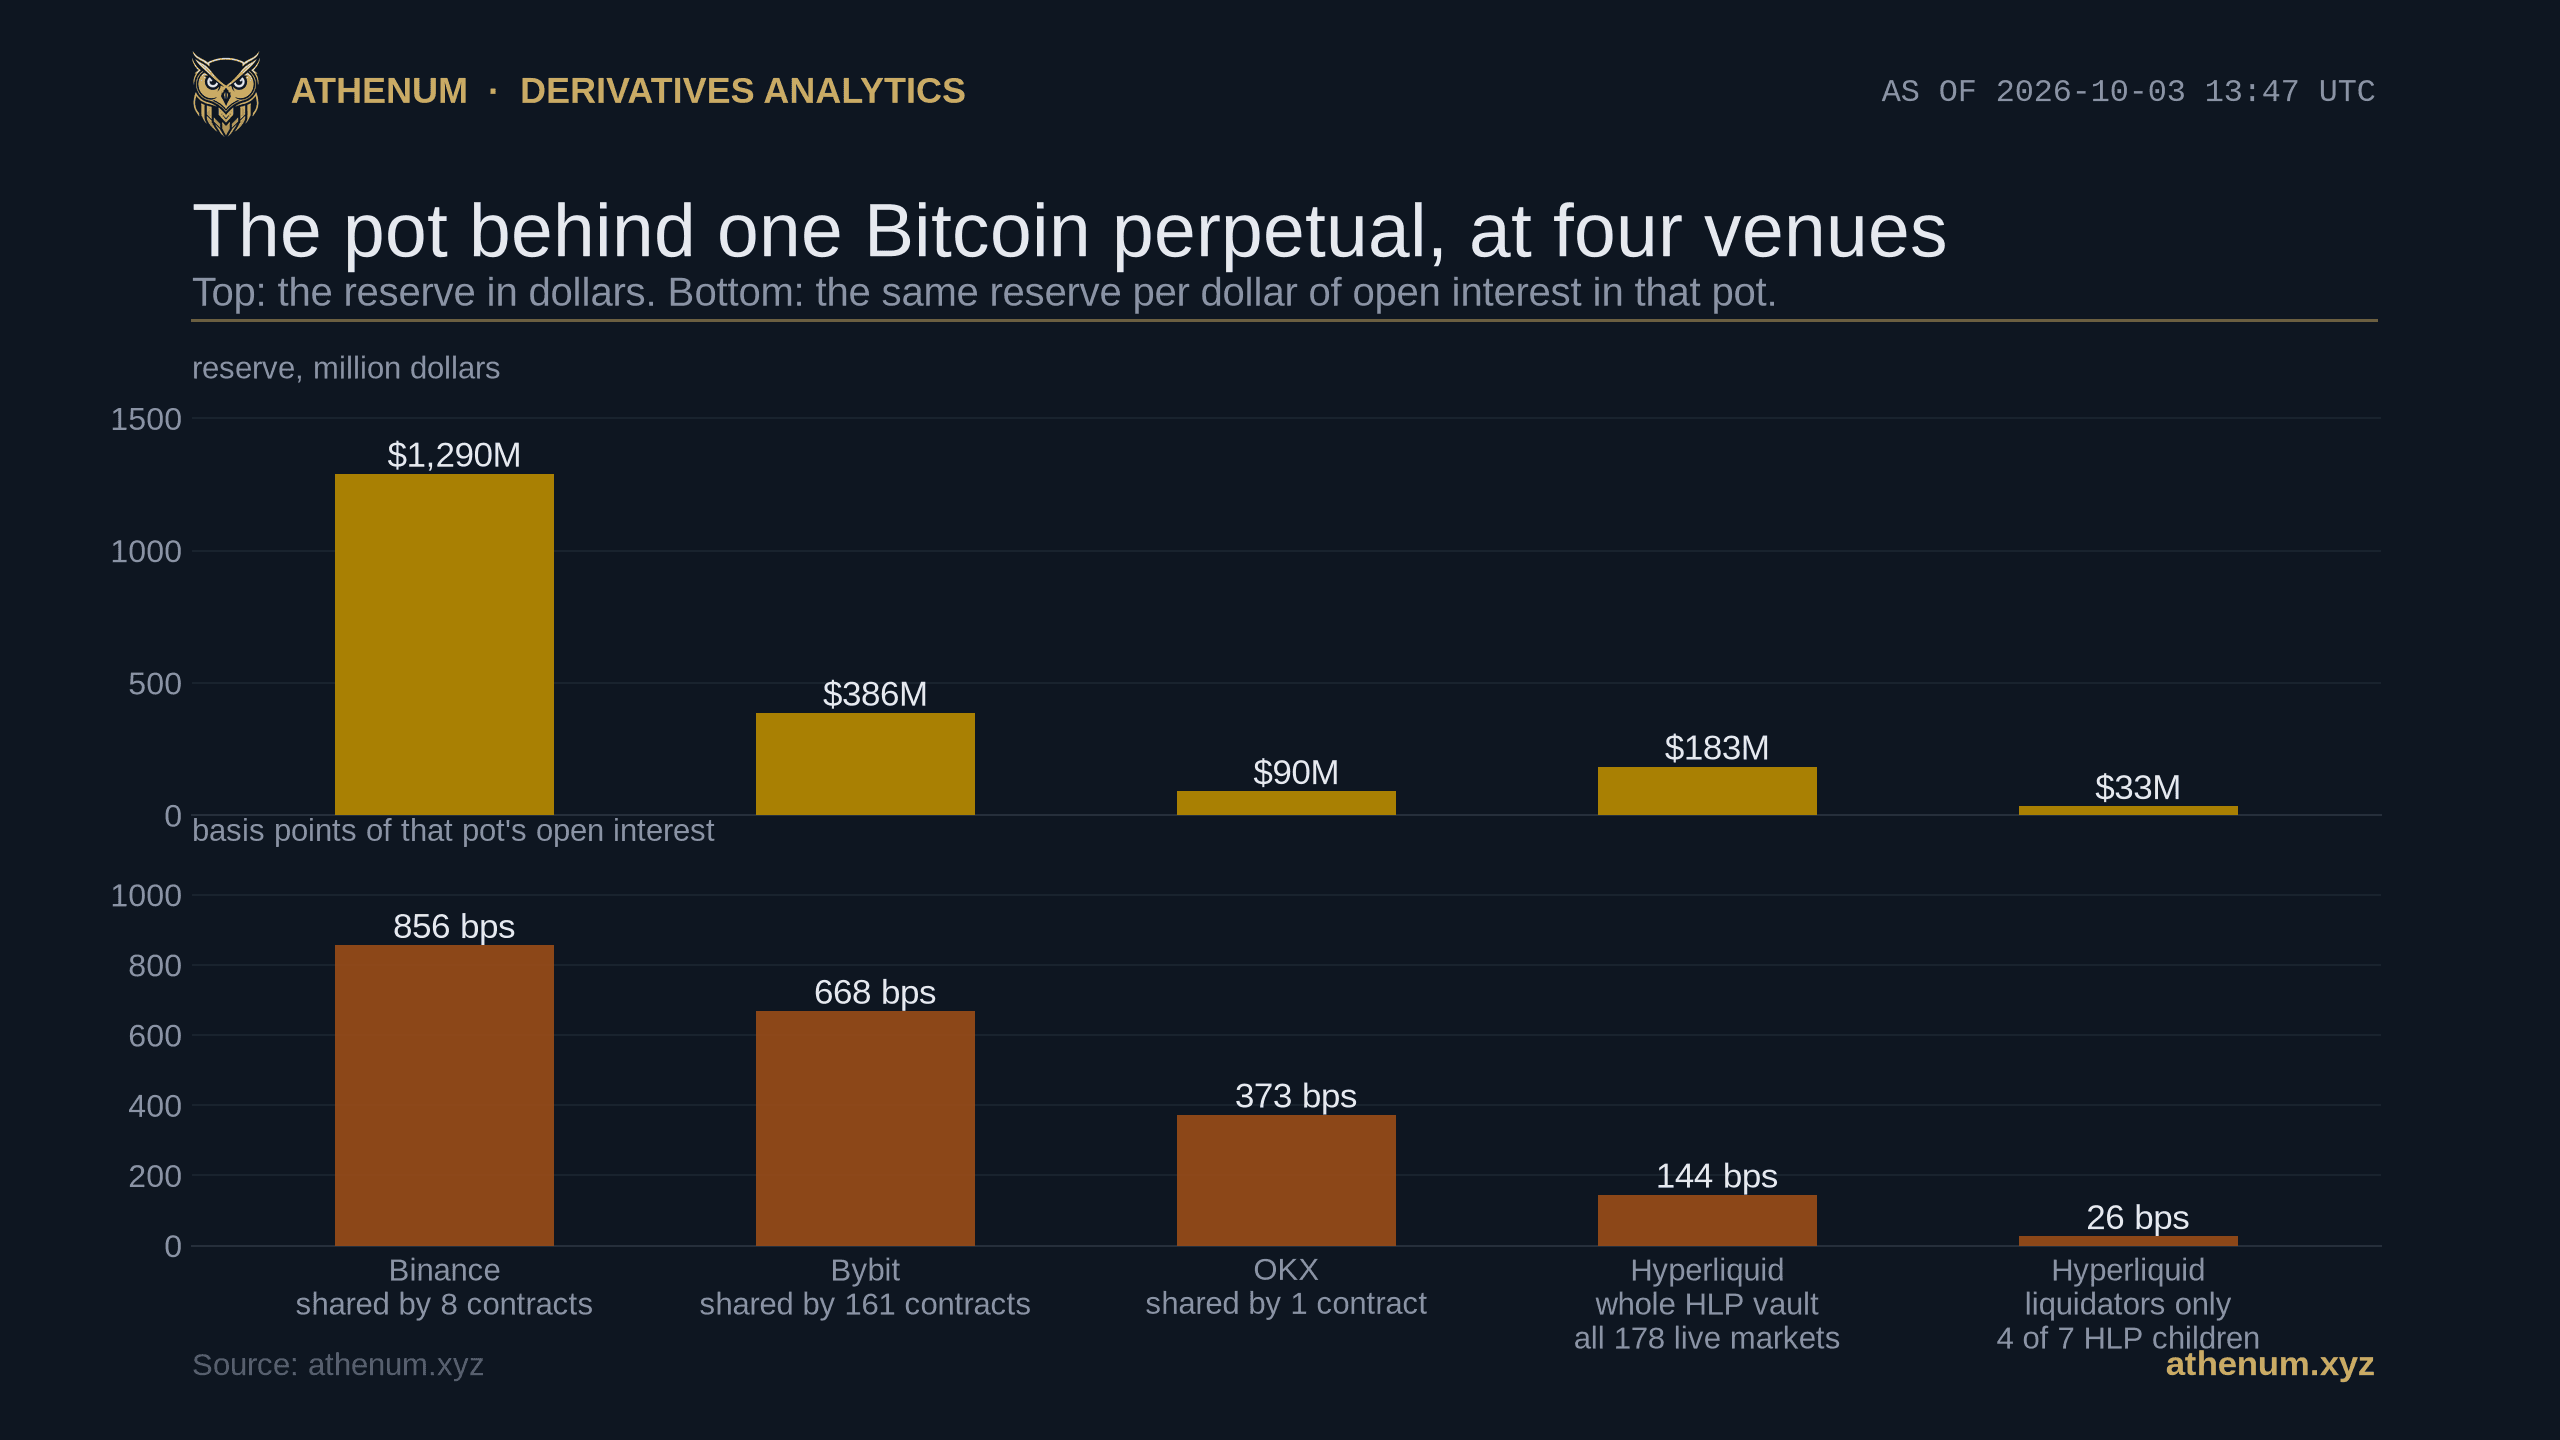
Crypto Insurance Funds Are Not One Pot: 123 at Binance, and Cover Varies a Hundredfold
The futures insurance fund is the reserve that pays the winner when a liquidation closes worse than its bankruptcy price, and when it runs out the venue reaches for auto deleveraging instead. Almost everything written about it, including two explainers on this blog, treats it as one number per excha
Athenum Analytics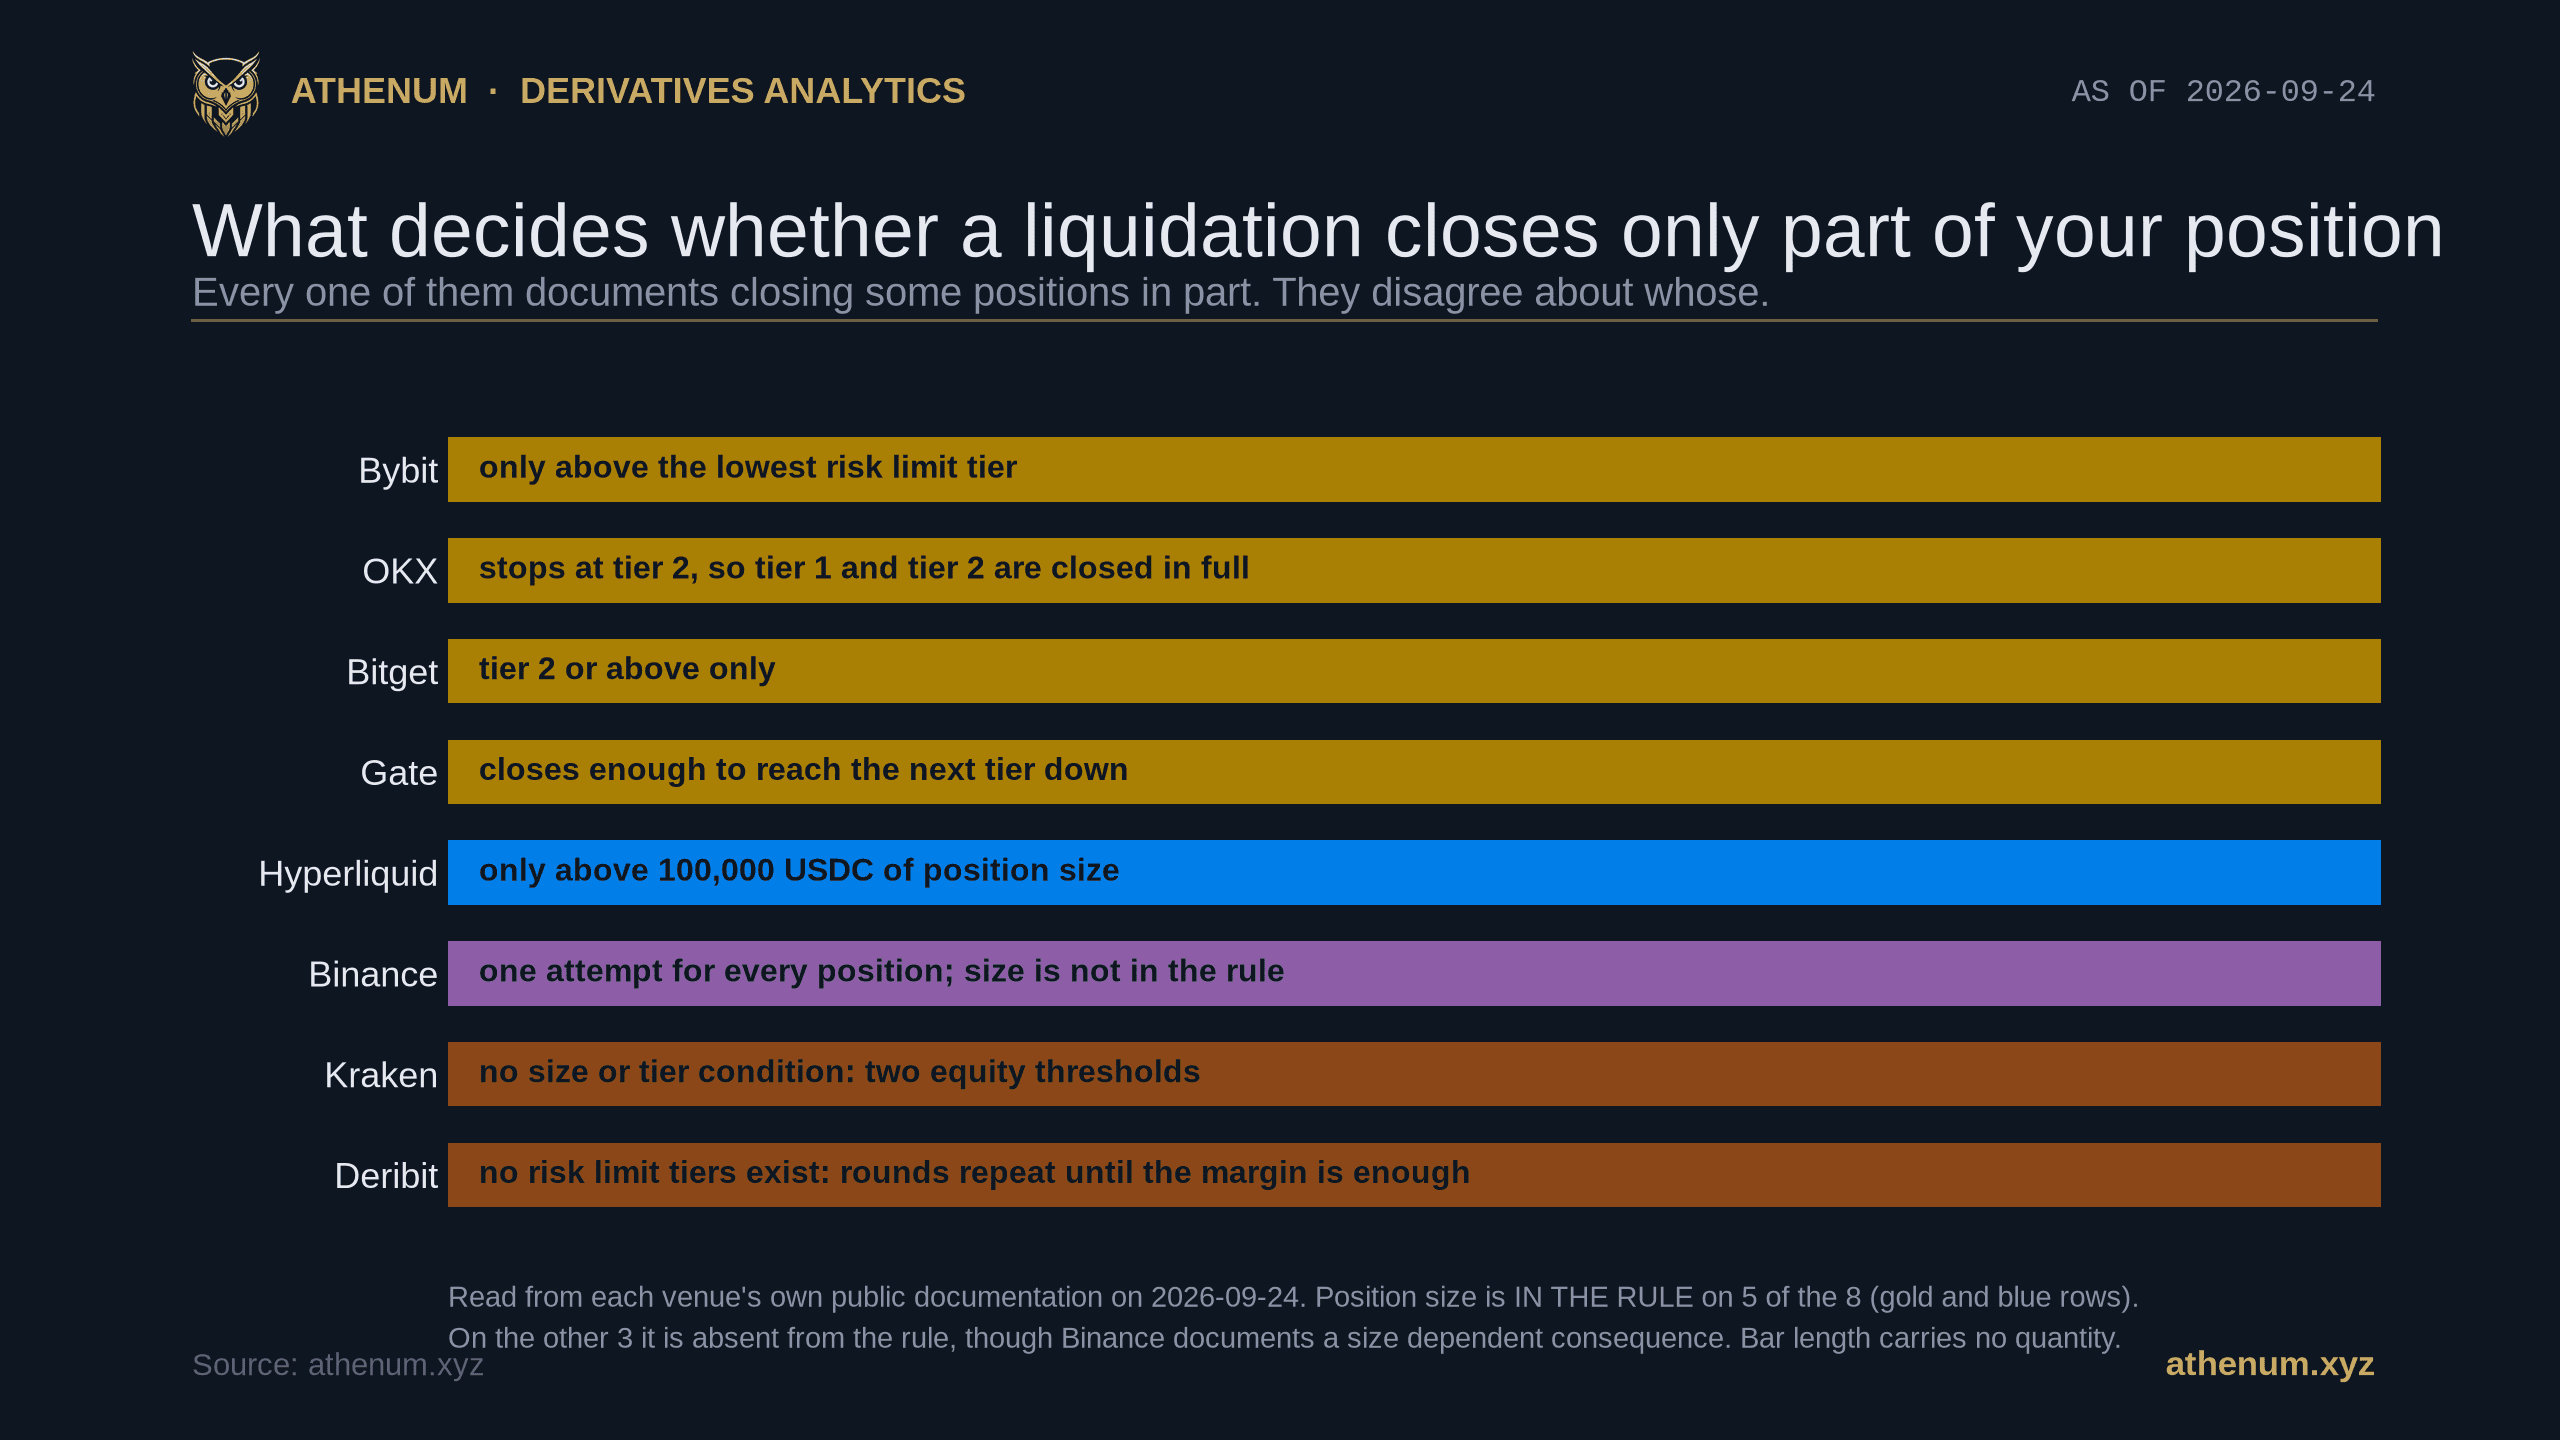
Who Gets a Partial Liquidation and Who Gets Closed All at Once
A liquidation does not always close your whole position. Reading eight venues' own liquidation documentation on 2026-09-24, all of them document closing some positions in part, and they disagree about whose. Bybit, OKX, Bitget and Gate gate the step on the risk limit tier, so a bottom tier position is closed in one action, and OKX stops a rung higher still, at tier 2. Hyperliquid gates on a flat 100,000 USDC of position size, and above it grants one slice before a 30 second cooldown in which orders go back to full size. Binance makes one Immediate or Cancel attempt for every position with no size term in its rule while documenting why smaller ones fare worse anyway. Kraken closes in fixed 10 per cent increments and Deribit repeats liquidation rounds until the requirement is met, neither with a size condition. Position size sits inside the rule itself on five of the eight venues we read and is absent from the rule on the other three.
Athenum Analytics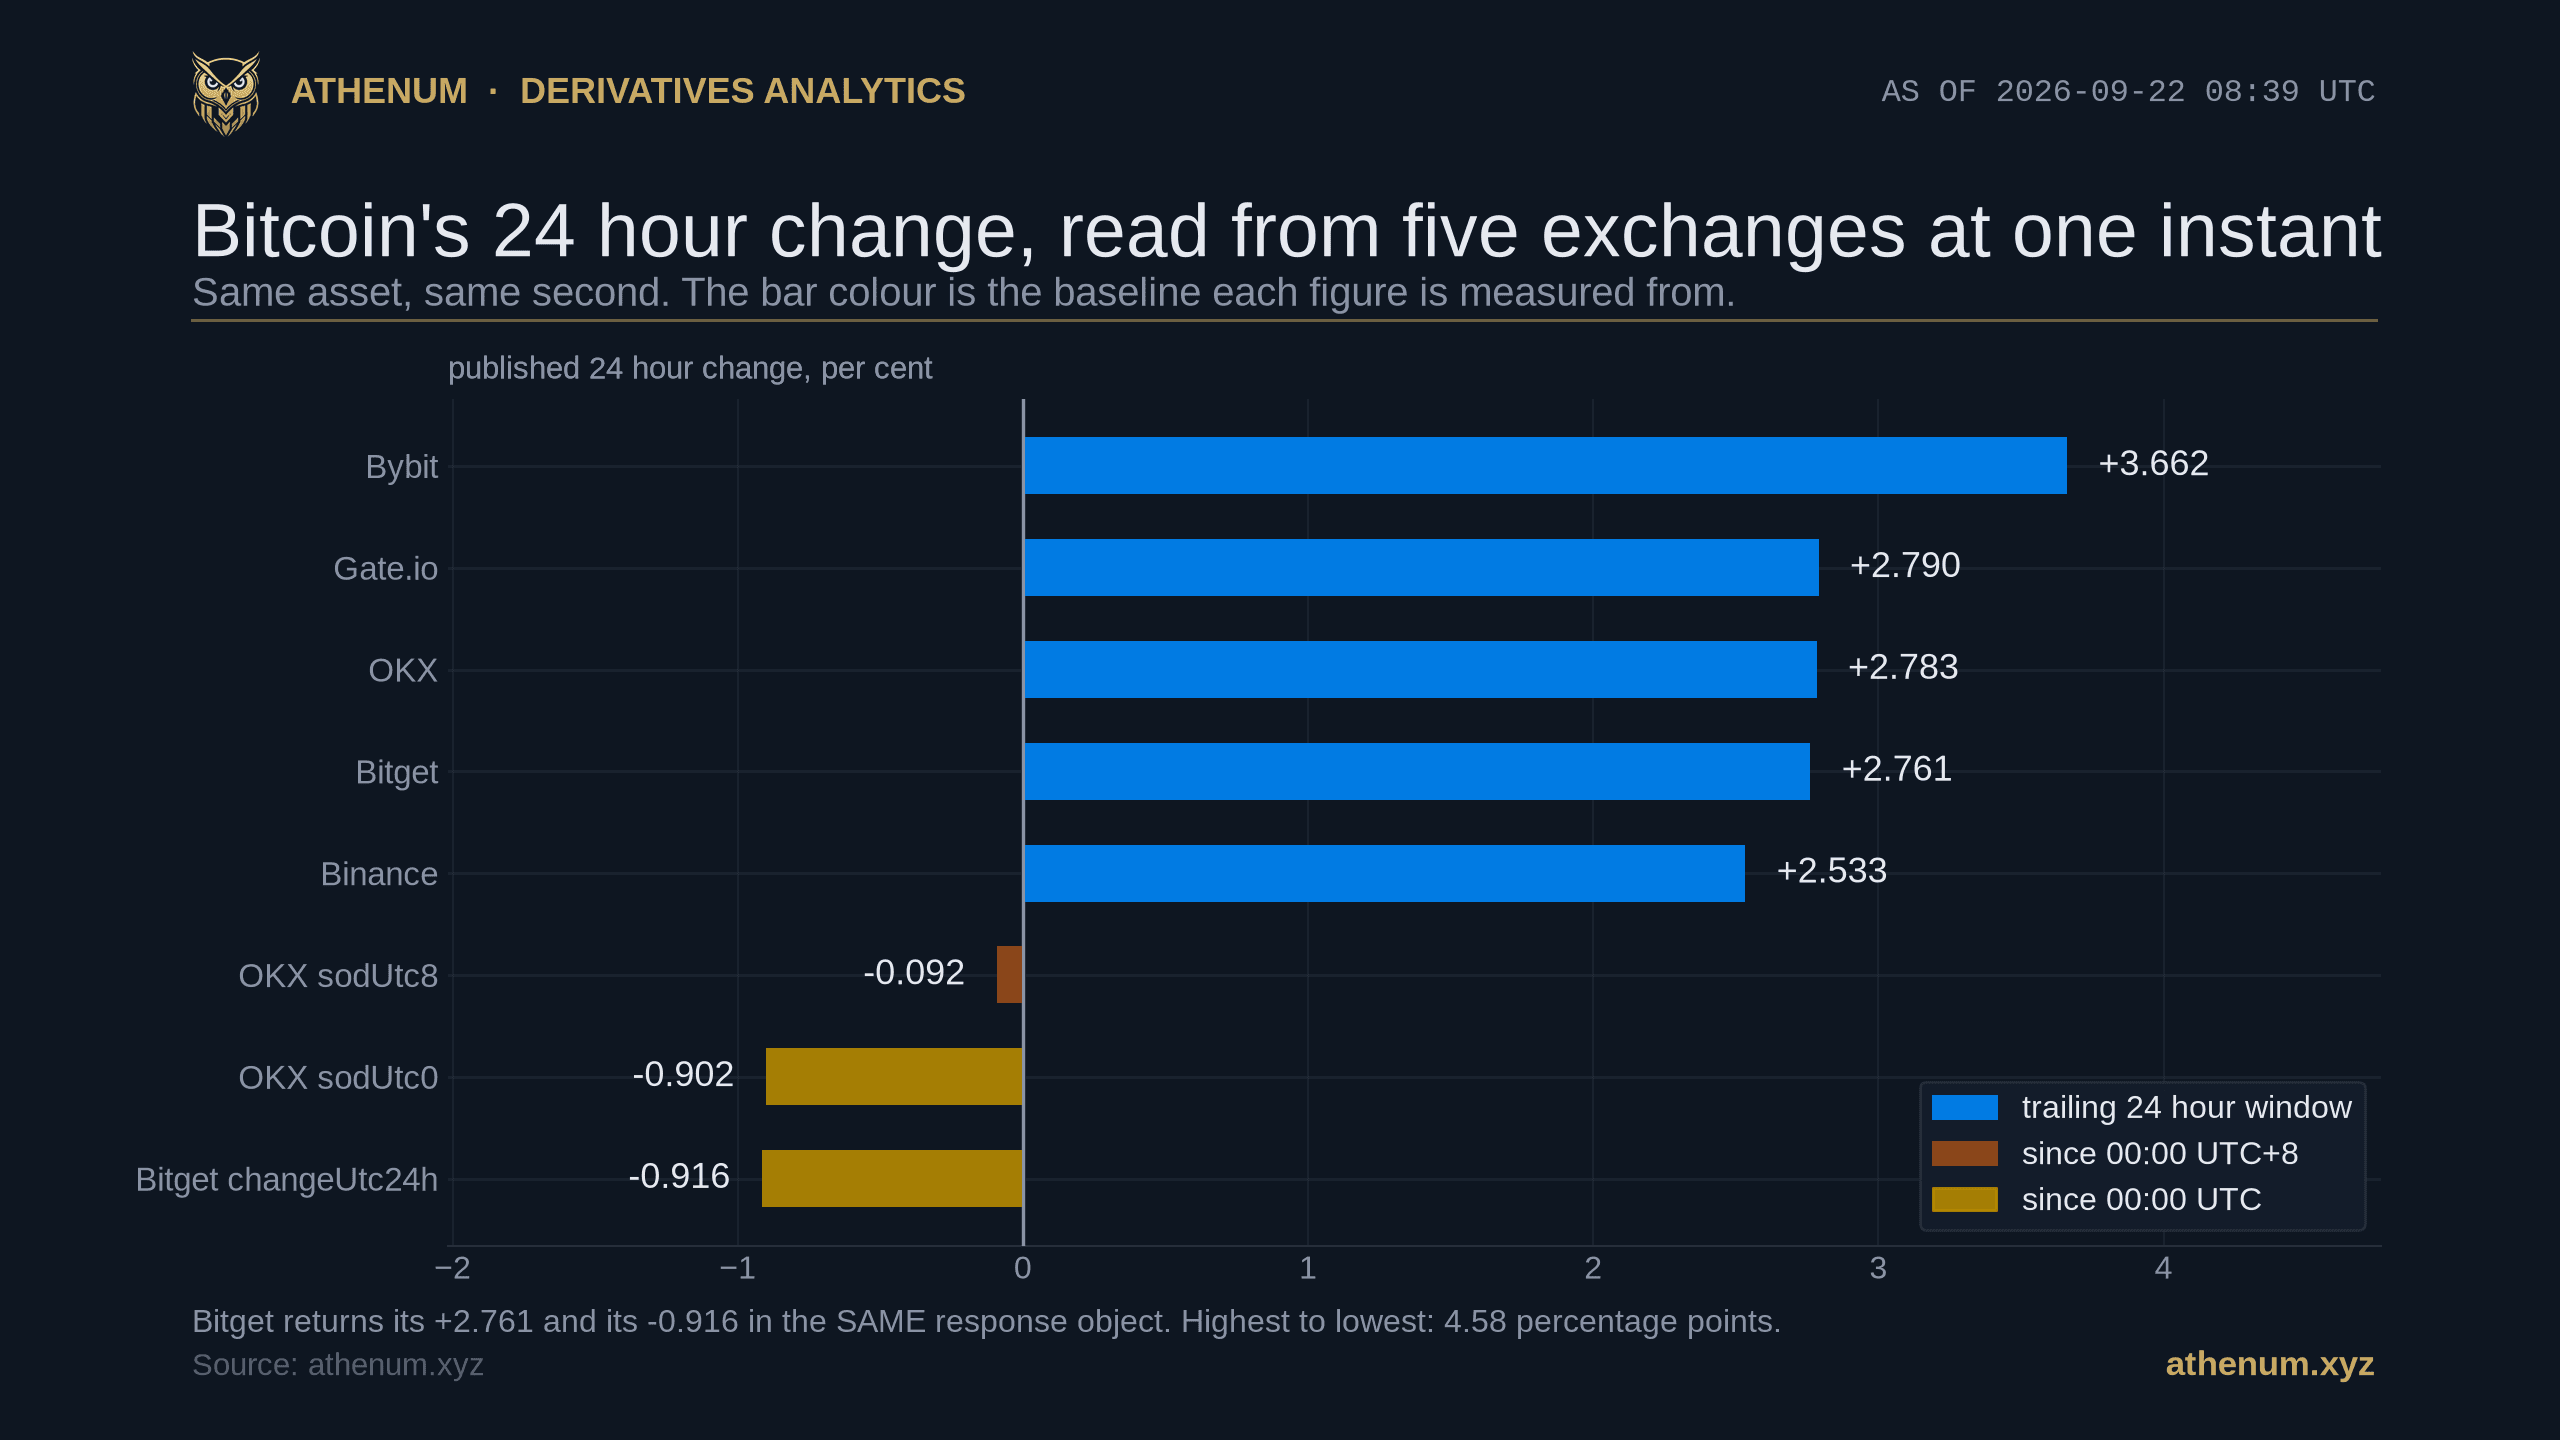
Bitcoin 24 Hour Change: Which Baseline, and Why It Flips the Sign 1 Hour in 4
A Bitcoin 24 hour change is a two point statement, and exchanges disagree about the first point. Some measure from a trailing 24 hour window, some from the price at 00:00 UTC, and OKX also publishes one from 00:00 UTC+8. Read at 2026-09-22 08:39:25 UTC in a 3.0 second capture, the BTC/USDT perpetual carried +3.662 per cent on Bybit and -0.916 per cent in Bitget's since-midnight field, a spread of 4.58 percentage points on the same asset at the same second, with Bitget returning both of its figures in one response object. This is not an edge case. Over the 8,760 hourly readings from 2025-09-22 09:00 UTC to 2026-09-22 08:00 UTC the two baselines differed by a median 0.663 percentage points, by more than 1 point at 37.1 per cent of readings and by more than 2 at 16.3 per cent, and they carried OPPOSITE SIGNS at 2,240 of 8,760, or 25.6 per cent. The disagreement is strongly patterned by the clock: at 01:00 UTC the two figures pointed opposite ways on 51.0 per cent of days, at 23:00 UTC on 4.9 per cent. The same split runs through metrics other than price. Athenum's own cross-venue Bitcoin perpetual open interest at 2026-09-22 07:00 UTC reads +6.96 per cent against 24 hours earlier and -0.81 per cent against 00:00 UTC, from one series at one stamp.
Athenum Analytics
USDC vs USDT Funding: One Exchange, Two Bitcoin Rates at the Same Settlement
USDC vs USDT funding is not a distinction most dashboards make, and it should be. A Bitcoin perpetual quoted in USDC and a Bitcoin perpetual quoted in USDT on the SAME exchange are two books with two premium indices and two quote-currency reference prices, so they charge two different rates at the s
Athenum Analytics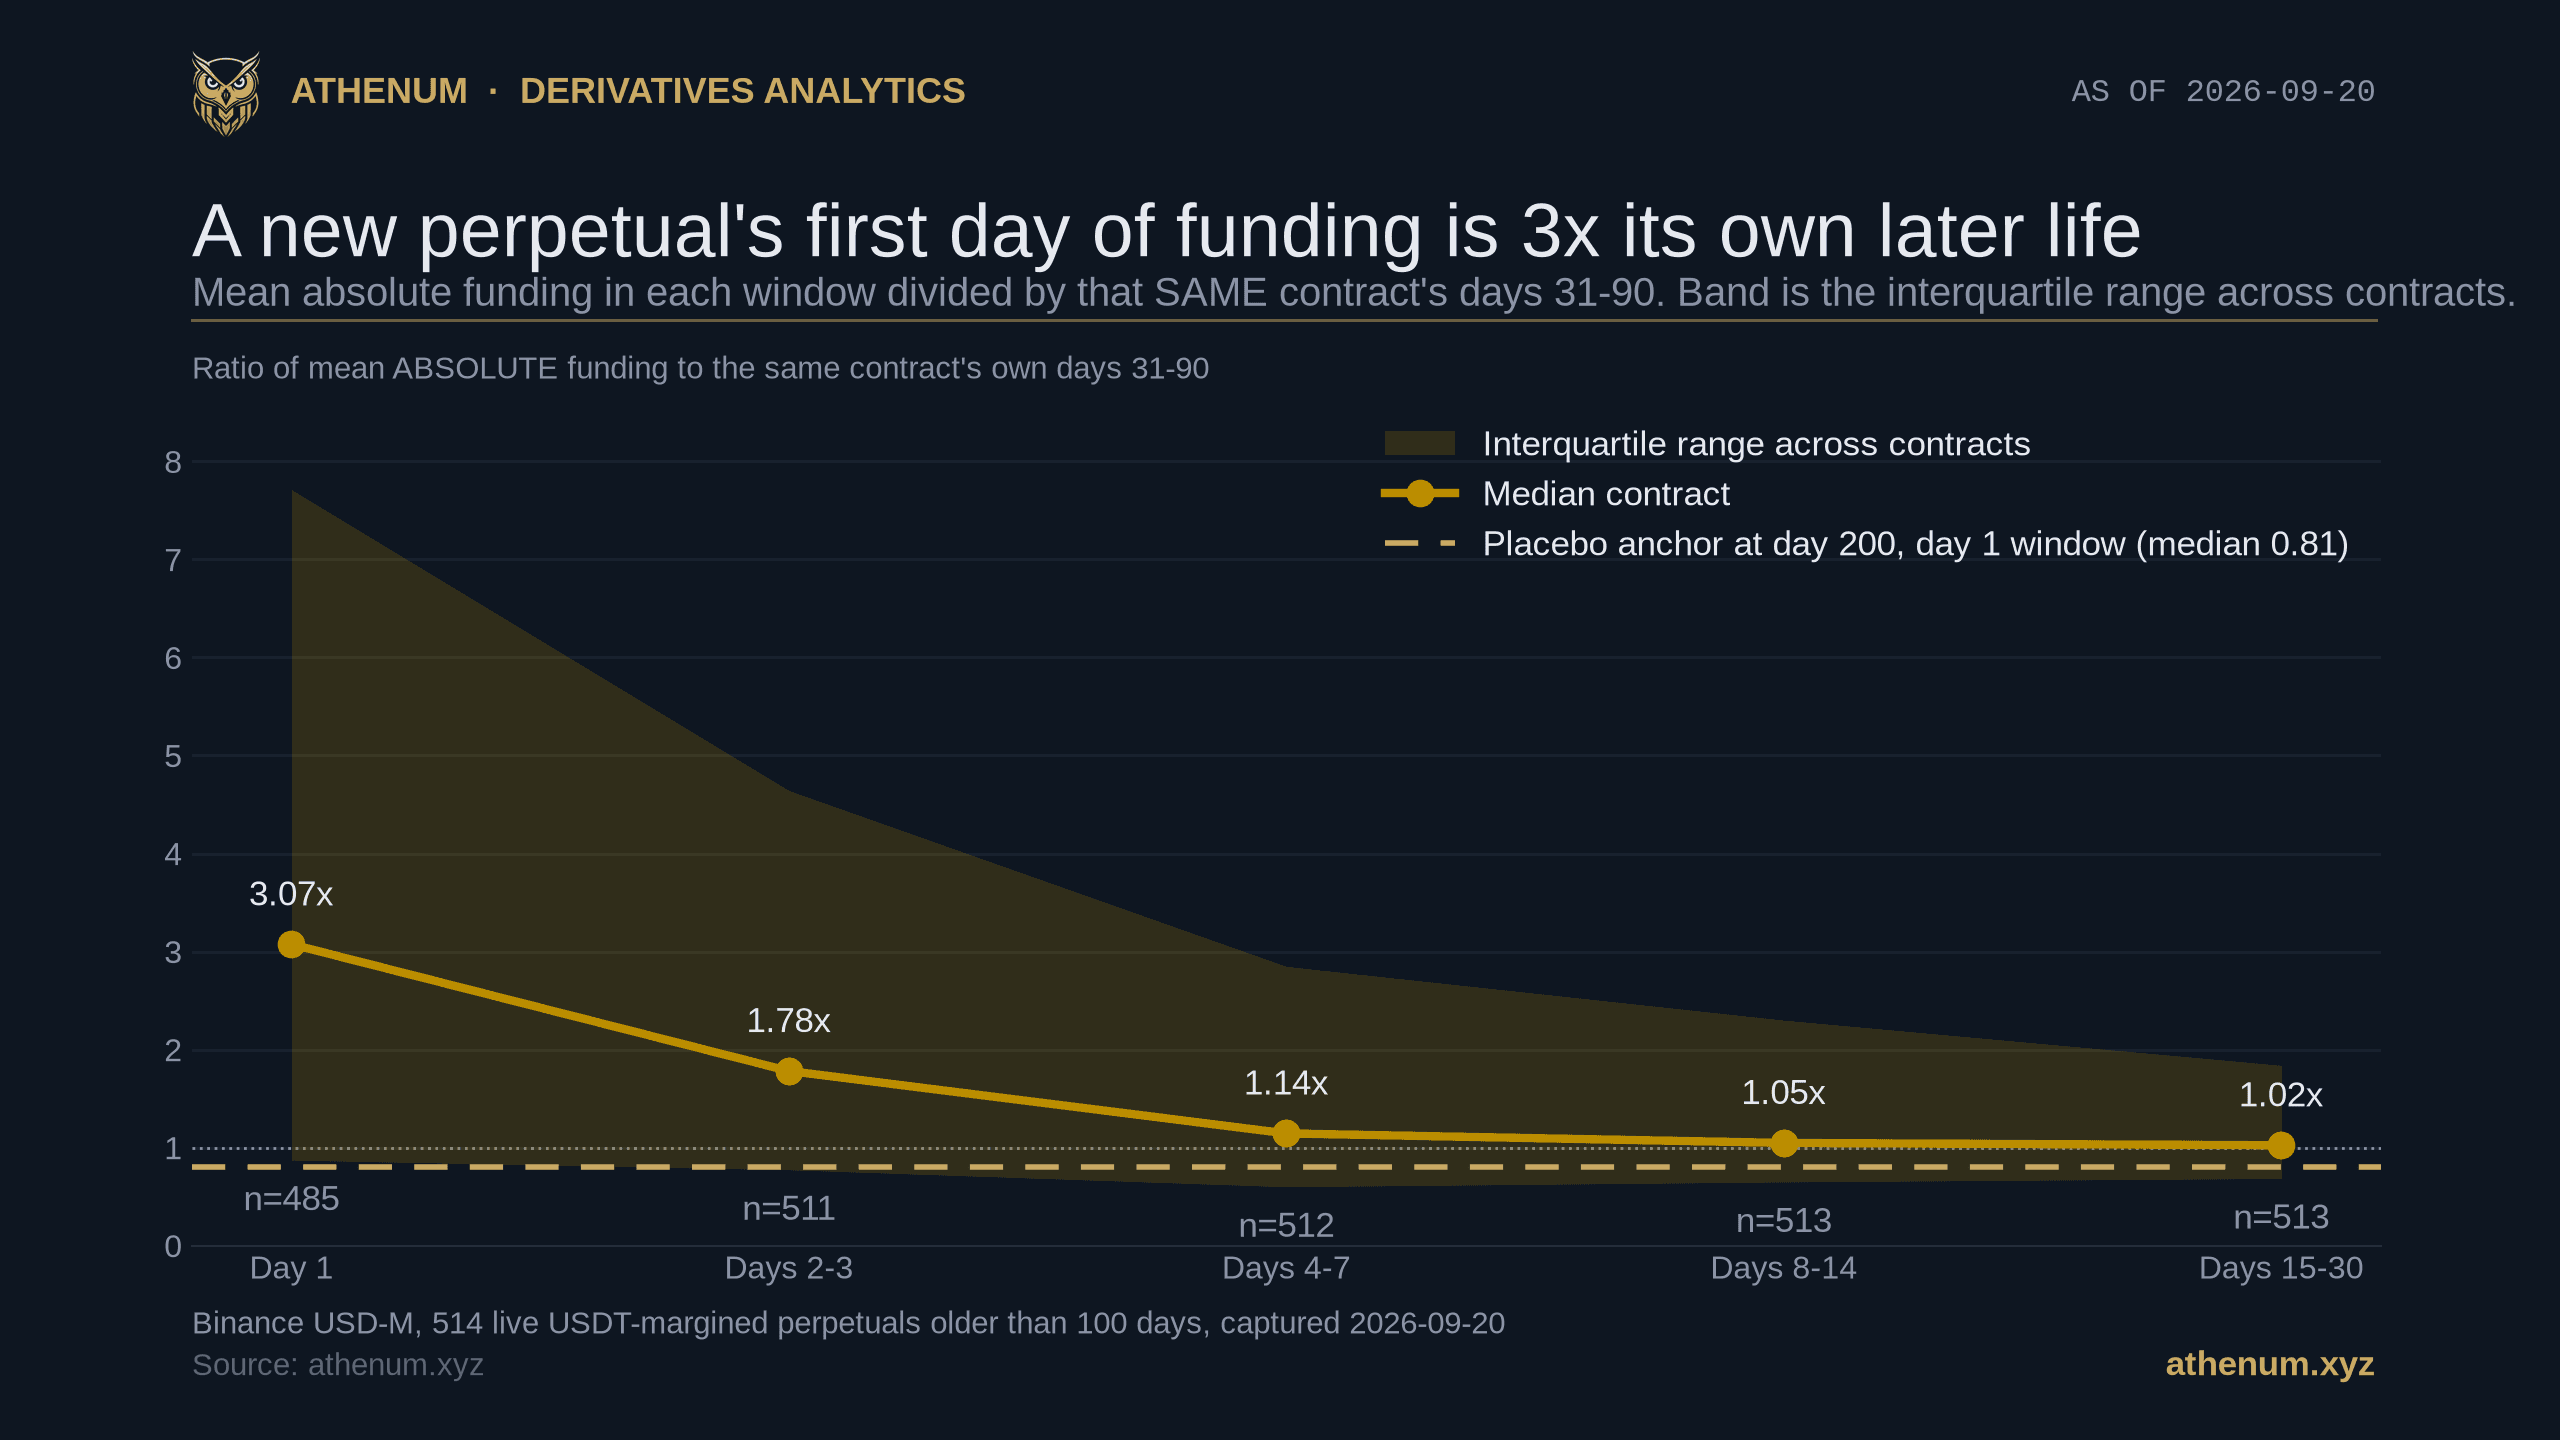
New Perpetual Listings: Day One Funding Is 3x the Contract's Own Later Life
New perpetual listings carry their most violent funding in the hours after they list, and the size of that is measurable rather than folkloric. We read all 528 live USDT-margined perpetuals on Binance's USD-M board on 2026-09-20, kept the 514 with enough history, and compared each contract against i
Athenum Analytics
When Is Funding Charged on a Bitcoin Perp? At the Stamp, and Dodging One Costs 8 Times More
Perpetual funding is not rent that accrues while you hold. It is a transfer taken from whoever is open at the settlement stamp, so a position opened and closed between two stamps pays nothing at all, and a position held for ten minutes across one pays the full interval rate. That makes the interval
Athenum Analytics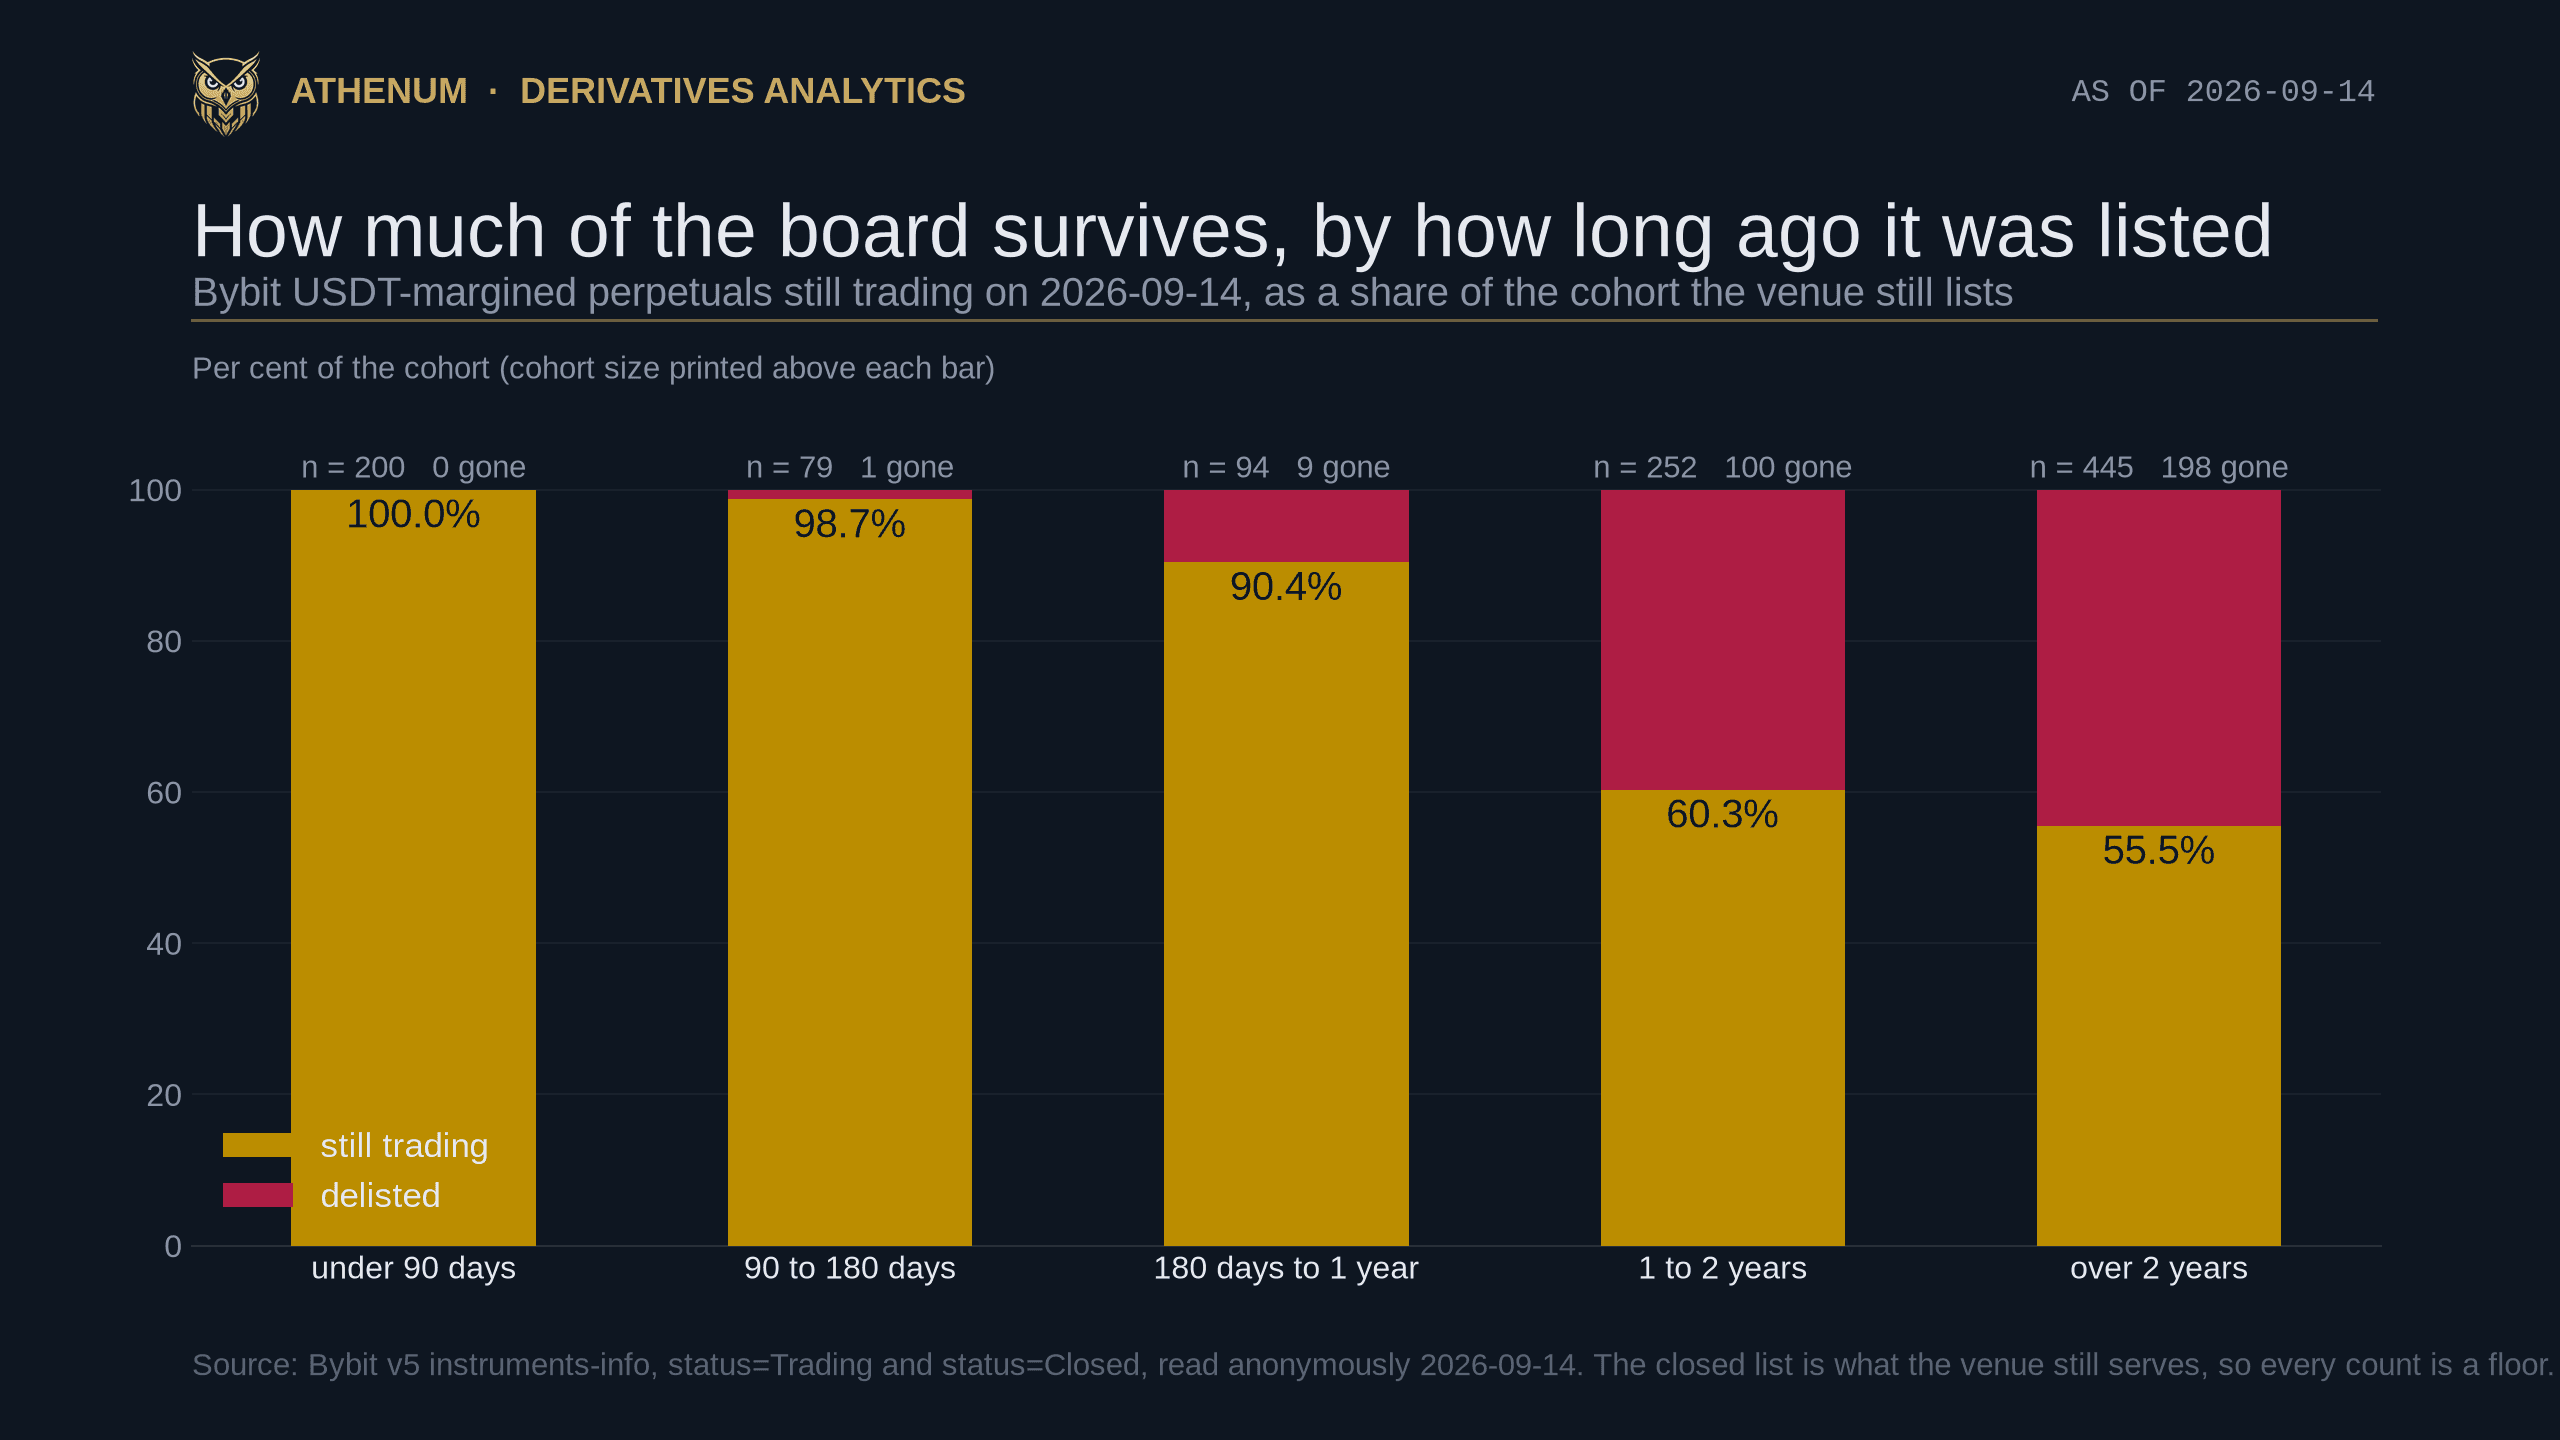
Perpetual Futures Survivorship Bias: 172 of Bybit's 571 One Year Contracts Are Already Gone
If you build a universe of perpetual contracts by calling a venue's live instrument endpoint, you are sampling survivors, and on 2026-09-14 the size of that is measurable rather than theoretical.
Athenum Analytics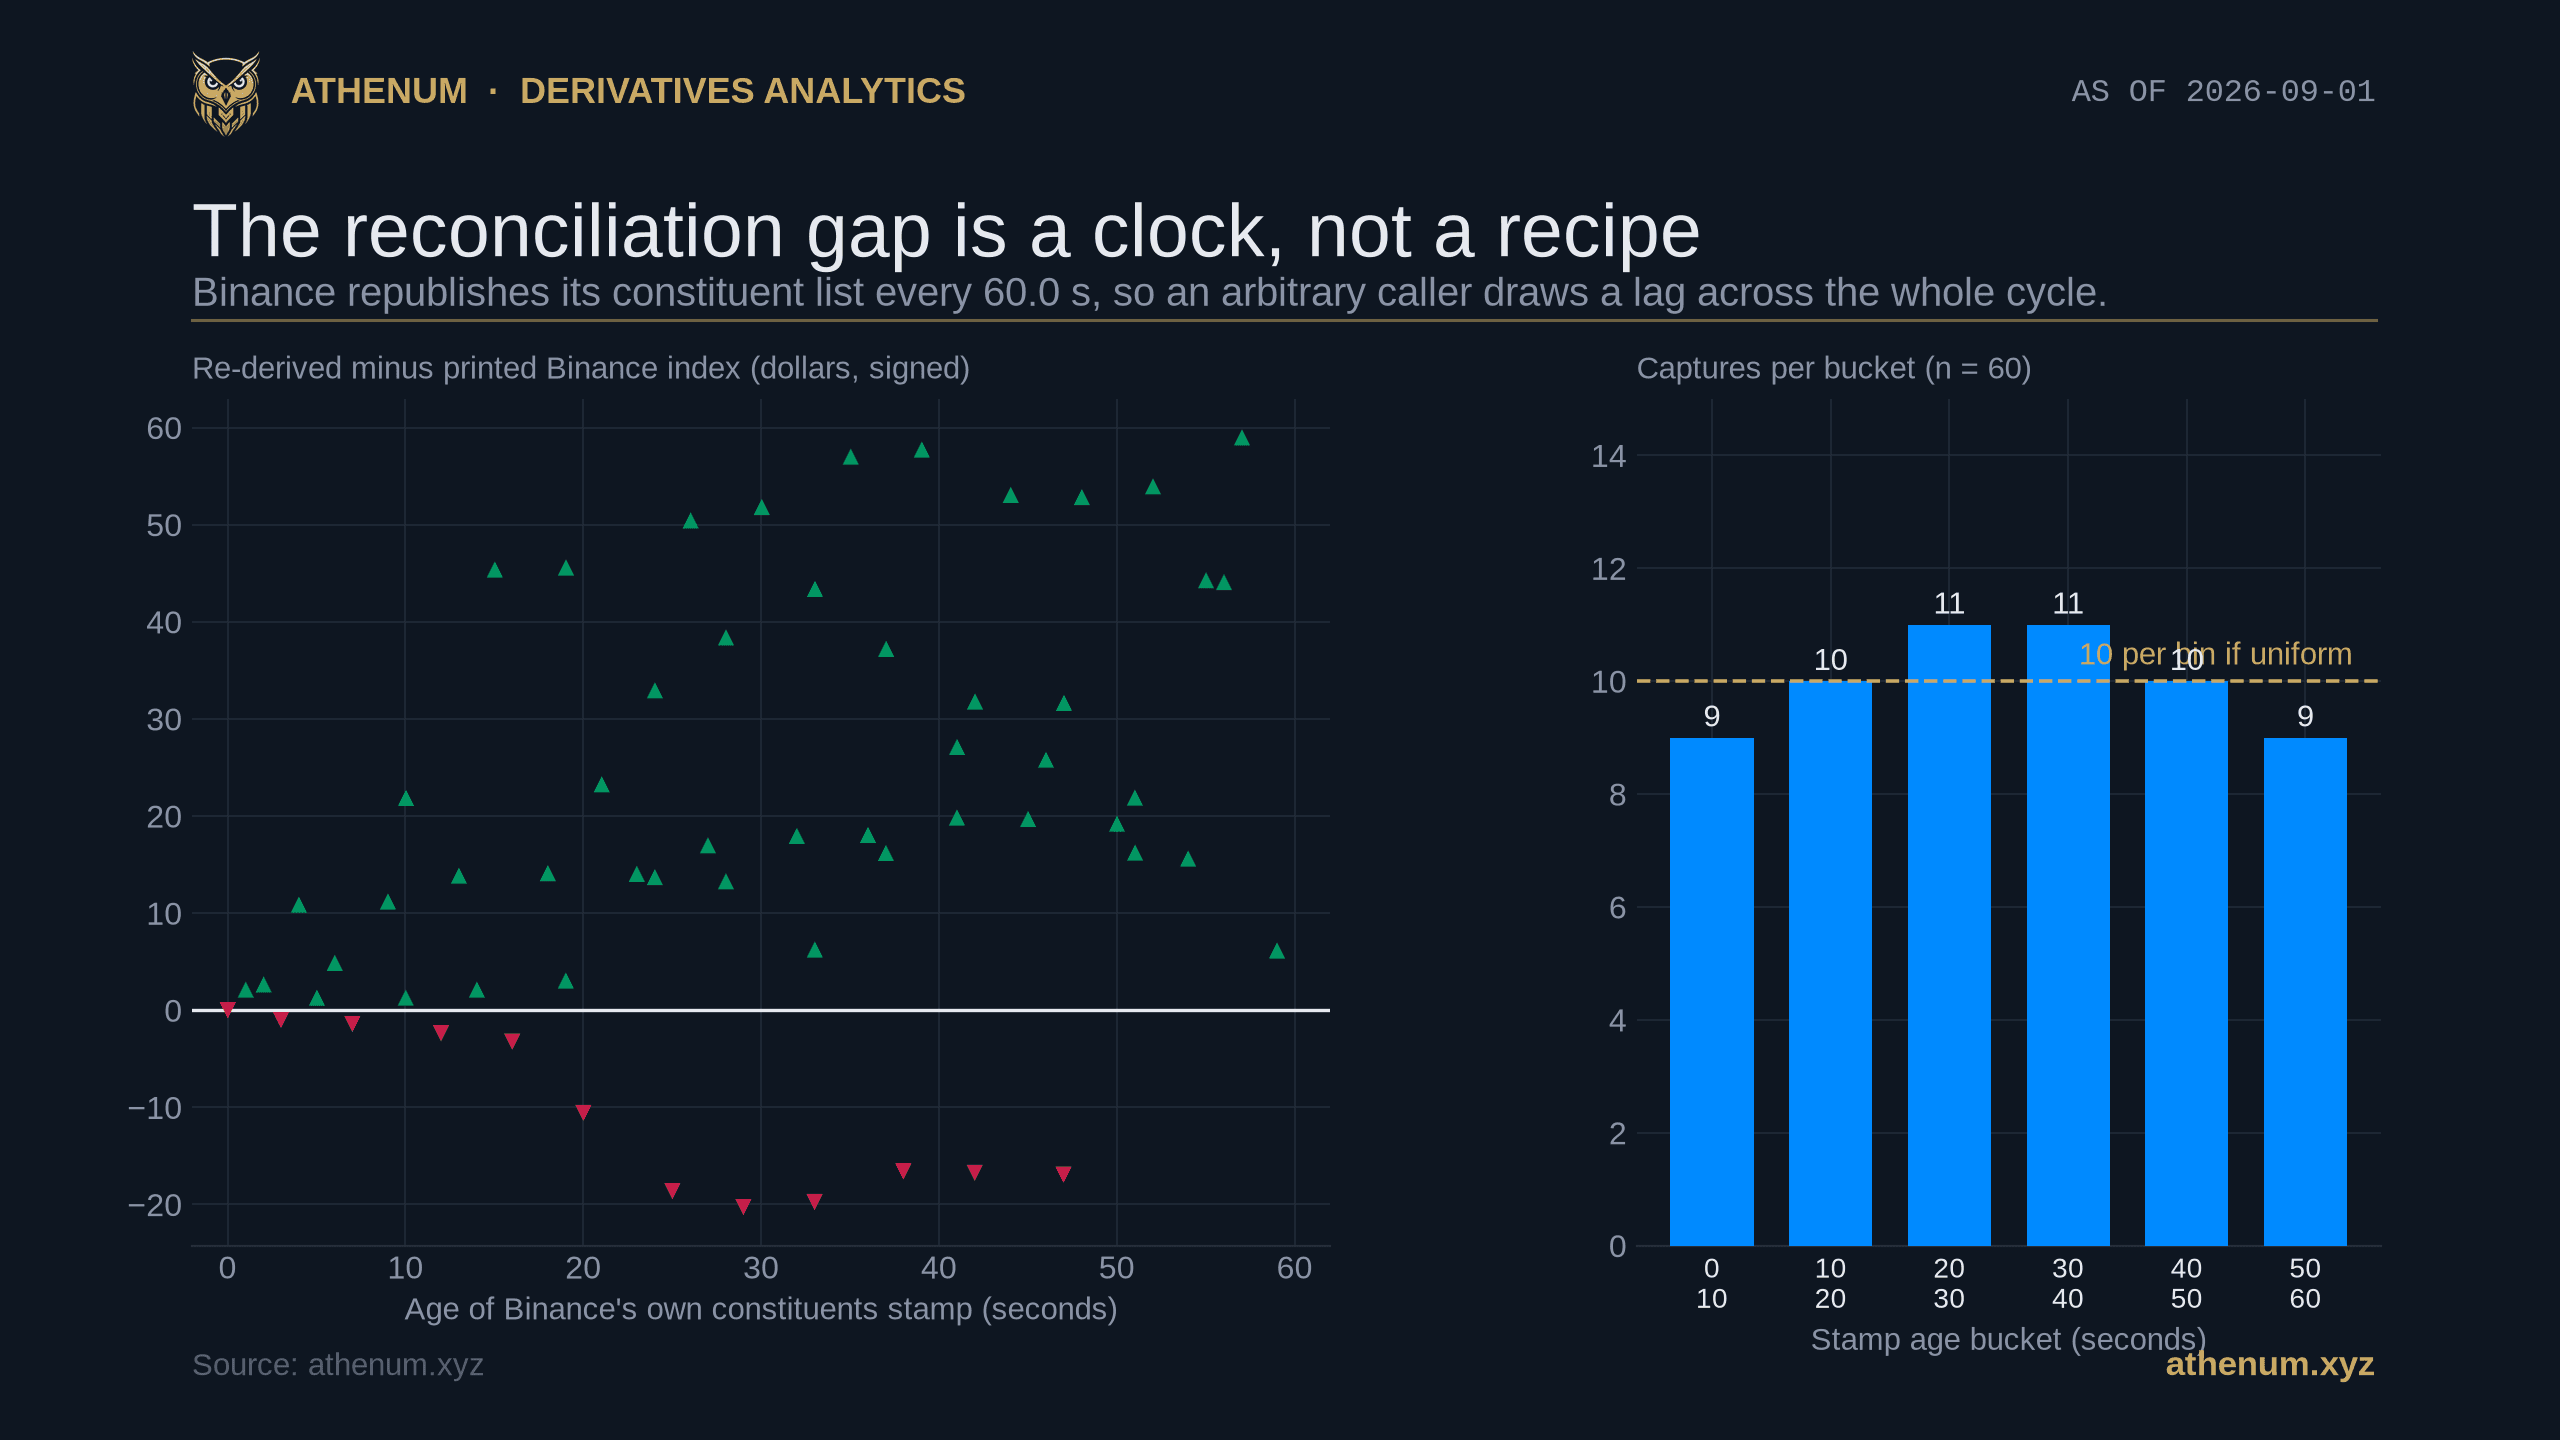
Bitcoin Index Price: One Venue's Sum Closes Exactly, One Is 60 Seconds Behind
A perpetual is liquidated against an index, and two large venues publish the recipe for that index on endpoints that need no key, so you can in principle audit the number that closes your position. We showed in August that those recipes are fixed preset weight grids rather than volume weighted averages, and that the sums reproduce. This post measures the thing that write up left as a phrase, "seconds of drift", and the answer is a fixed clock. On 2026-09-01, across 60 concurrent captures, Binance's constituents endpoint republished on a period of 60.0 seconds, five distinct timestamps with fou
Athenum Analytics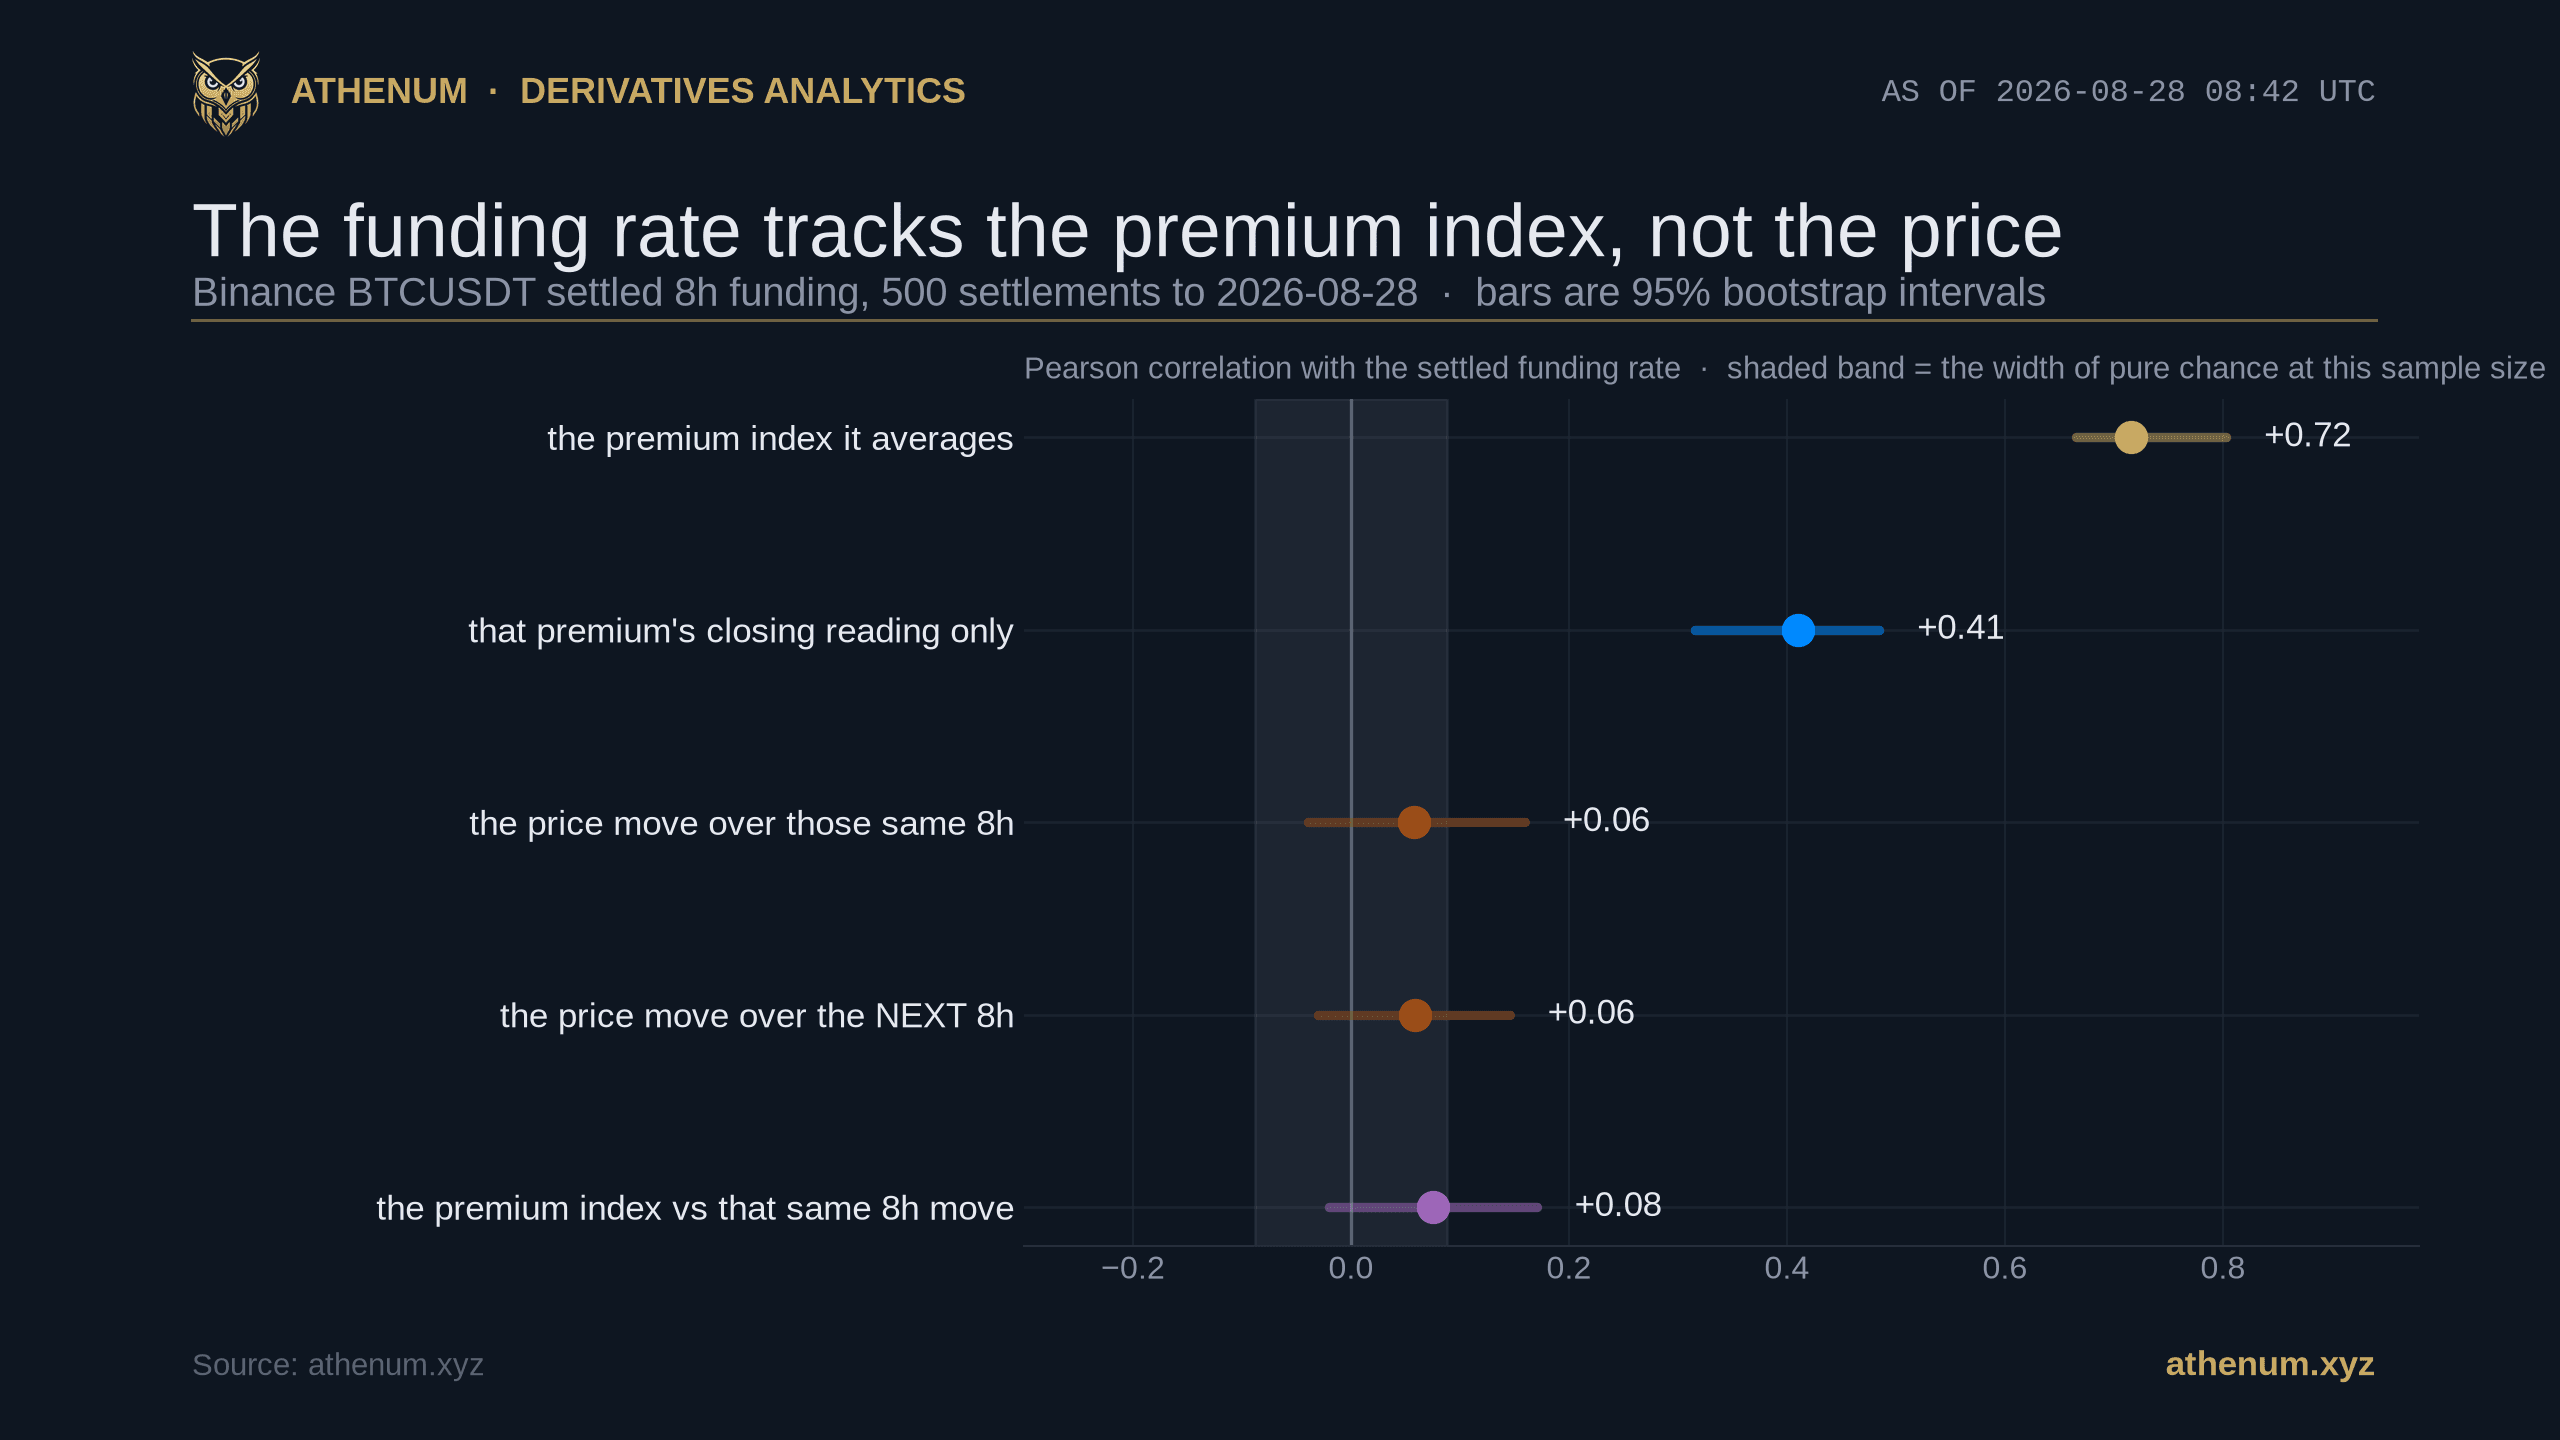
Bitcoin Funding Rate vs Price: 0.72 to the Premium Index, 0.06 to the Move
The Bitcoin funding rate is the fee perpetual longs and shorts exchange every eight hours, and almost every description of it, ours included, says it measures crowding or conviction and then invites you to read that forward as a statement about price. This post tests only that second step. Measured on 2026-08-28 over 500 Binance BTCUSDT settlements back to 2026-03-15, the settled rate correlates +0.72 (95 percent interval +0.67 to +0.80) with the premium index it is built from.
Athenum Analytics