Bitcoin Funding Divergence: The -35% APR Short Squeeze Trap | Athenum Blog
Bitcoin Funding Divergence: The -35% APR Short Squeeze Trap at $75K
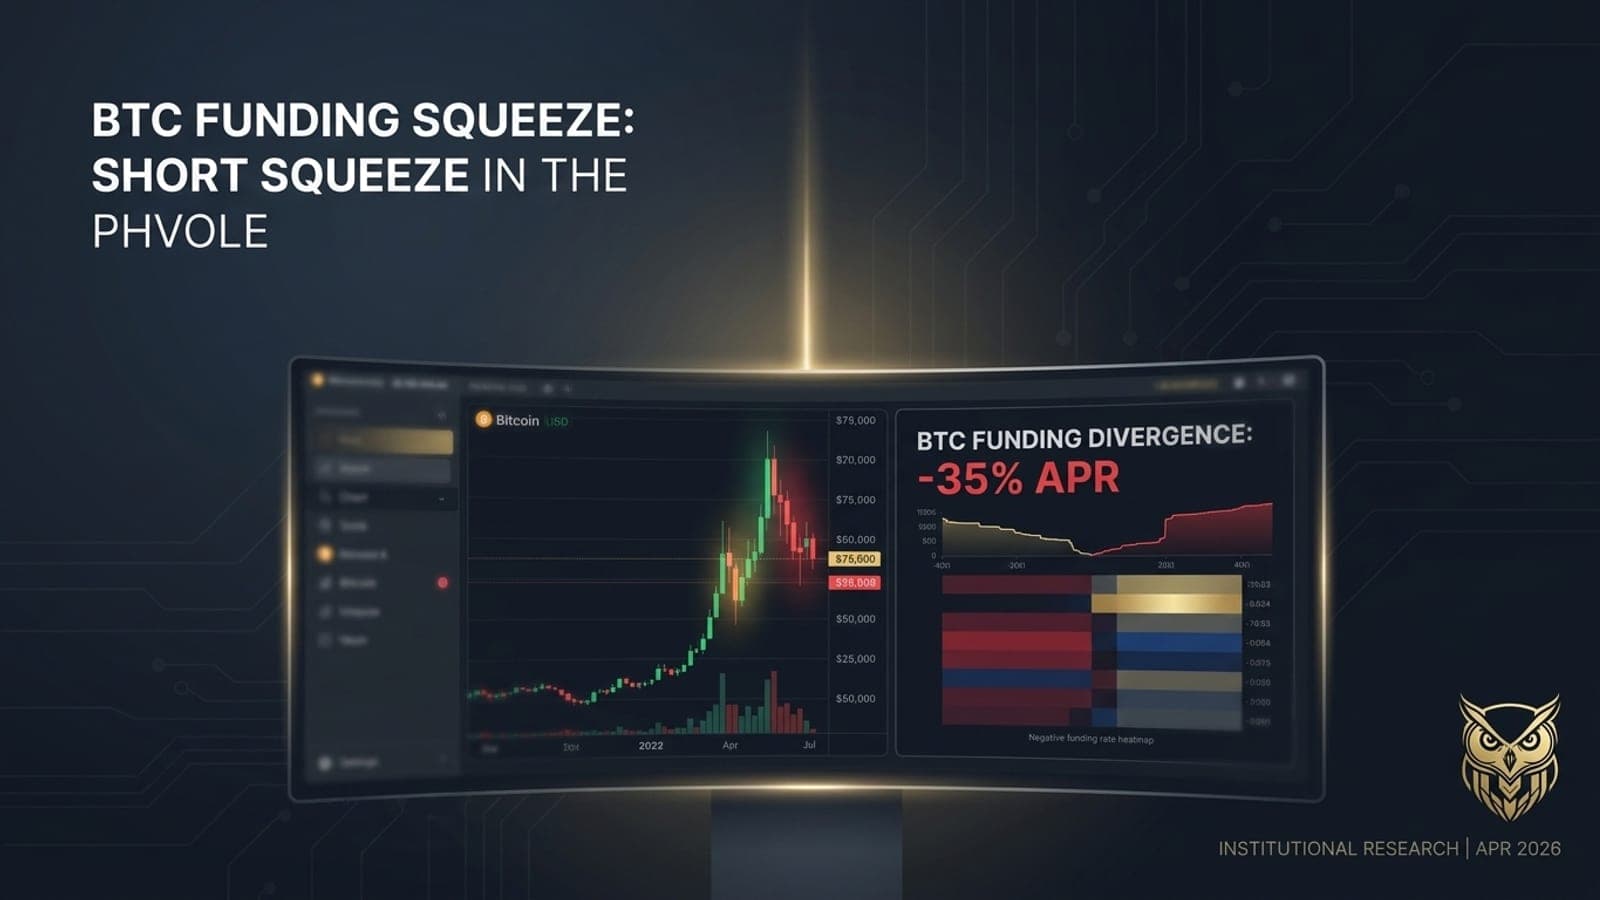
Bitcoin's push above $75,000 in mid-April 2026 triggered one of the most significant positioning divergences in the perpetual futures market since 2023. Funding rates across major exchanges collapsed to their most negative levels in over two years, even as spot demand remained robust and Bitcoin ETF inflows continued at pace. The surface narrative looks like a simple breakout fading into resistance. The underlying data tells a more complex and actionable story.
This post breaks down the mechanics of what is happening, why the cross-exchange divergence between Binance and Hyperliquid is the most important signal to watch right now, and what historical precedent suggests about how this resolves.
How Perpetual Futures Funding Rates Work
Before reading the divergence data, it is worth grounding the analysis in the mechanics of how funding rates function. Perpetual futures contracts have no expiry date, which means they require a separate mechanism to keep the contract price tethered to the underlying spot price. That mechanism is the funding rate.
Every eight hours on most major exchanges, a fee is exchanged between long and short position holders. The direction and magnitude of that fee is determined by the difference between the perpetual contract price and the spot index price. When the perpetual trades at a premium to spot, longs pay shorts, which incentivizes traders to short the contract and bring the price back down. When the perpetual trades at a discount, shorts pay longs, which incentivizes traders to buy the contract and push the price back up.
The funding rate acts as a proportional control law: when the perp trades at a premium, longs pay shorts to reduce the basis; when it trades at a discount, shorts pay longs.
Under neutral market conditions, funding rates typically range between 5% and 10% APR (annualized), which compensates for the cost of capital and exchange counterparty risk. Rates persistently above 20% APR signal overheated long positioning, while rates persistently below -10% APR signal crowded short positioning. Both extremes are unsustainable because the cost of holding the position compounds over time and eventually forces capitulation.
The critical insight is that funding rates are not just a cost of carry. They are a real-time signal of positioning crowding. When funding is deeply negative while price is rising, it means futures traders are aggressively betting against the rally while spot buyers are absorbing that pressure. This creates a mechanical tension that must resolve in one of two ways: either the spot bid fails and price drops, rewarding the shorts, or the spot bid holds and the shorts are eventually forced to cover, triggering a squeeze.
The April 2026 Divergence: BTC
The current market environment presents a textbook case of this tension, made significantly more complex by a severe cross-exchange divergence. Live funding rate data for BTCUSDT across Binance and Hyperliquid from April 12 to April 18, 2026 reveals a striking split in positioning between the two venues.
Date (UTC)
Binance BTC Funding (APR)
Hyperliquid BTC Funding (APR)
BTC Mark Price
Net Payment
Apr 13, 16:00
-6.78%
-0.09%
$72,213
Binance: shorts pay
Apr 14, 00:00
+3.15%
+10.95%
$74,333
Both: longs pay
Apr 14, 08:00
+3.15%
+10.95%
$74,840
Both: longs pay
Apr 14, 16:00
-8.25%
-35.05%
$75,224
Both: shorts pay
Apr 15, 00:00
-10.09%
-12.81%
$74,485
Both: shorts pay
Apr 16, 00:00
-5.44%
-5.44%
$74,753
Both: shorts pay
Apr 17, 16:00
+0.00%
-23.46%
$78,130
HL: shorts pay
Apr 18, 16:00
-6.01%
-6.01%
$75,969
Both: shorts pay
Source: Live funding rate timeseries
The data shows a clear pattern. On April 14, as Bitcoin tested $75,224, Binance funding dropped to -8.25% APR. Simultaneously, Hyperliquid funding collapsed to an extreme -35.05% APR. This 26.8 percentage point spread between two major venues indicates severe liquidity fragmentation and localized short crowding on Hyperliquid specifically.
The practical read is this: Hyperliquid traders aggressively faded the $75K test, piling into shorts with such conviction that they drove the localized funding rate to extreme negative levels. Binance traders also shorted, but with less intensity. This creates a highly localized squeeze risk. If Bitcoin holds above $76,000, the forced liquidations will likely originate on Hyperliquid first, cascading across venues as arbitrageurs scramble to close the spread.
Hyperliquid BTC funding collapsed to -35.05% APR on April 14 while Binance held at -8.25%, revealing a venue-specific short crowding event.
It is also worth noting the April 17 data point. At 16:00 UTC, as Bitcoin surged to $78,130, Hyperliquid funding hit -23.46% APR while Binance was essentially neutral. This pattern repeated: Hyperliquid traders used the rally as an opportunity to add to short positions, while Binance participants were not following suit with the same conviction. The divergence is not a one-time anomaly. It is a persistent structural feature of the current market.
The April 2026 Divergence: ETH
This divergence is not isolated to Bitcoin. Ethereum exhibits an identical, yet even more pronounced, cross-exchange funding spread during the same period. This confirms that the short crowding is a structural market theme rather than an asset-specific anomaly.
Date (UTC)
Binance ETH Funding (APR)
Hyperliquid ETH Funding (APR)
ETH Mark Price
Net Payment
Apr 14, 08:00
+10.95%
+10.13%
$2,391
Both: longs pay
Apr 14, 16:00
+2.21%
-34.48%
$2,350
HL: shorts pay
Apr 15, 00:00
+2.09%
-8.91%
$2,332
HL: shorts pay
Apr 16, 00:00
-1.87%
-23.02%
$2,358
Both: shorts pay
Apr 16, 08:00
-1.74%
-20.35%
$2,342
Both: shorts pay
Apr 17, 16:00
+0.00%
-24.14%
$2,461
HL: shorts pay
Apr 18, 08:00
-8.11%
-8.11%
$2,370
Both: shorts pay
Apr 18, 16:00
-17.62%
-17.62%
$2,363
Both: shorts pay
Source: Live funding rate timeseries
On April 14 at 16:00 UTC, while Binance ETH funding remained positive at +2.21% APR, Hyperliquid ETH funding plunged to -34.48% APR. This 36.7 percentage point spread is even larger than the BTC divergence. It demonstrates that the aggressive shorting behavior is venue-specific and systematic. Hyperliquid participants are betting against the current price levels across multiple assets simultaneously, while Binance participants remain relatively neutral on Ethereum.
By April 16, the divergence had partially compressed but remained extreme, with Hyperliquid ETH funding at -23.02% APR versus Binance at -1.87% APR. By April 17, as ETH rallied to $2,461, Hyperliquid funding hit -24.14% APR again while Binance was neutral. The same pattern as BTC: Hyperliquid traders using rallies to add shorts.
What This Divergence Actually Means for Traders
Cross-exchange funding divergences of this magnitude are rare and carry specific implications for how the market resolves. Understanding the mechanics helps traders position correctly rather than reacting to price alone.
When one venue shows extreme negative funding while another is neutral, it creates an arbitrage opportunity. Traders can go long on the venue with extreme negative funding (collecting the funding payment from shorts) and short on the neutral venue (or spot), locking in a risk-free yield. This arbitrage pressure naturally compresses the spread over time. The question is how fast and through what mechanism.
If the arbitrage is absorbed slowly, the spread compression is gradual and orderly. If a price catalyst forces rapid liquidations on the extreme venue, the compression is violent. Given that Hyperliquid's funding hit -35% APR on BTC and -34.5% APR on ETH, the cost to maintain those short positions is significant. At -35% APR, a short position costs approximately 0.096% per 8-hour period. On a $1 million position with 10x leverage, that is roughly $9,600 every 8 hours. Positions of that cost structure cannot be maintained indefinitely.
The macro regime composite (Athenum Analytics), computed from five macro indicators as of April 18, 2026, shows a "neutral" regime with a confidence of 0.30. Key inputs include a VIX at 17.94 (below the 25.0 risk-off threshold), the ICE BofA High Yield spread at 2.86% (below the 3.0% risk-off threshold, signaling tight credit conditions), the 10Y-2Y Treasury spread at +0.55% (normal yield curve), and the Federal Funds Rate at 3.64%. The dollar index at 118.86 is elevated, providing the only risk-off signal. This neutral macro backdrop means the resolution of the funding divergence will be driven by crypto-native flows rather than a macro shock.
Historical Context: What Happens After Extreme Negative Funding
According to Glassnode data cited by CoinDesk, Bitcoin's 7-day moving average funding rate has dropped to its most negative levels since 2023 [1]. That 2023 episode is instructive. In late 2022 and early 2023, following the FTX collapse, funding rates were deeply negative for an extended period as the market was overwhelmingly positioned short. Bitcoin was trading in the $16,000 to $20,000 range. The subsequent recovery to $30,000 by mid-2023 was accompanied by a violent short squeeze as those positions were forced to cover.
The current situation differs in one important respect: Bitcoin is not in a post-collapse recovery. It is in a consolidation phase below its all-time high of $126,200, with spot demand from ETF inflows remaining robust. As noted by analysts at CEX.IO, for a true squeeze to materialize, Bitcoin needs to break and hold above $80,000 to trigger cascading liquidations of short positions [2]. The $921 million in net ETF inflows over five days preceding April 18 suggests the spot bid is not disappearing.
However, the options market provides a counterpoint. The 7- and 30-day 25-delta skew on Deribit hovers between -2% and -4%, indicating that options traders are paying a premium for downside protection. The put/call ratio is climbing. This divergence between the options market (bearish) and the spot market (bullish) mirrors the divergence in the perpetual funding market. The resolution will determine the medium-term direction.
The SOL Data Point
Solana provides an additional data point that reinforces the cross-exchange divergence thesis. Binance SOLUSDT funding on April 14 was consistently positive at +10.95% APR, while Hyperliquid SOLUSDT funding swung between +10.95% and -17.12% on the same day. By April 18, Hyperliquid SOL funding hit -16.02% APR while Binance SOL was at -10.16% APR. The spread is smaller than BTC and ETH but follows the same directional pattern: Hyperliquid participants are systematically more bearish than Binance participants across all major assets.
Asset
Peak Hyperliquid Negative Funding (APR)
Corresponding Binance Funding (APR)
Spread
BTC
-35.05%
-8.25%
26.8 pp
ETH
-34.48%
+2.21%
36.7 pp
SOL
-17.12%
+10.95%
28.1 pp
Source: Live funding rate data. pp = percentage points. Data from April 14, 2026.
The consistency across three major assets rules out idiosyncratic explanations. This is a systematic positioning difference between the Hyperliquid user base and the Binance user base. Whether this reflects different trader demographics, different leverage constraints, or different information sets is an open question. What is not open to debate is that the spread represents a measurable, quantifiable risk for anyone holding short positions on Hyperliquid.
How to Monitor This in Real Time
The Athenum Funding Rate Heatmap provides a live, cross-exchange view of funding rates across all major perpetual futures venues. The Per Exchange view shows the exact spread between Binance, Bybit, Hyperliquid, OKX, and dYdX for each asset in real time, with a TCI (Trapped Capital Indicator) mode that highlights cells where funding and price are diverging.
The current BTC futures overview shows open interest at $20.64 billion with a 24-hour volume of $20.51 billion and a current funding rate of -2.8% APR. The predicted next funding rate is -0.0451%, suggesting the market expects the negative funding to persist into the next settlement. Monitoring the predicted funding rate is often more informative than the current rate, as it reflects real-time positioning changes before the settlement occurs.
Conclusion: The Spread Resolution
The current cross-exchange funding divergence between Hyperliquid and Binance represents an unsustainable market state. The -35% APR prints on Hyperliquid for BTC and ETH mean that short holders on that venue are paying an annualized rate that makes long-duration positioning economically irrational unless price moves significantly in their favor within days.
Either the spot bid fails, rewarding the aggressive shorts and normalizing the funding rate through position closure, or the spot bid holds, triggering a violent cascade of short liquidations that will rapidly close the cross-exchange spread. Monitoring the funding spread between venues is currently more informative than watching the absolute price level. When the spread begins to compress rapidly, it will signal that the capitulation phase has begun.
The real-time cross-exchange funding data, TCI signals, and open interest composition needed to track this setup as it evolves are available on the Athenum derivatives dashboard. The wisdom is in the data. The chaos is in the narrative.