Skip to content
athenum.xyz
FeaturesPricingToolsLearnBlogFAQLaunch App
EN
English한국어TürkçeРусскийTiếng ViệtDeutschEspañol
Launch App
athenum.xyz

Market context, positioning and order flow in one research workspace.

Product

FeaturesPricingLaunch App

Market data

Funding ratesOpen interestCrypto market researchMethodology & data sources

Resources

LearnBlogTutorialDocumentationFree ToolsCompare platformsStatus

Connect

X / TwitterTelegramContact
© 2026 Athenum
Privacy PolicyTerms of ServiceLegal Notice

Athenum provides market data and analytical tools, not investment advice. Trading involves risk. Indicators and historical data do not guarantee future results.

  1. Home
  2. Blog
  3. Orderbook
Topic

Orderbook

12 articles

AllAthenum4Bitcoin9Bitcoin Liquidity1Building in Public1Education8Ethereum3Liquidation1Market Analysis18Market Depth4News1Orderbook12Research21Risk Management1Technical Analysis2Tools1Trading Strategy9Weekly Intelligence2
Feature image for The Institutional Signal: Decoding the Coinbase Premium Index in 2026
Trading Strategy

The Institutional Signal: Decoding the Coinbase Premium Index in 2026

The derivatives market is the engine room of cryptocurrency price discovery, but for traders focused on high-conviction moves, the spot market remains the ultimate arbiter of truth. Among the noise of

Athenum AnalyticsAthenum Analytics
May 14, 202610 min
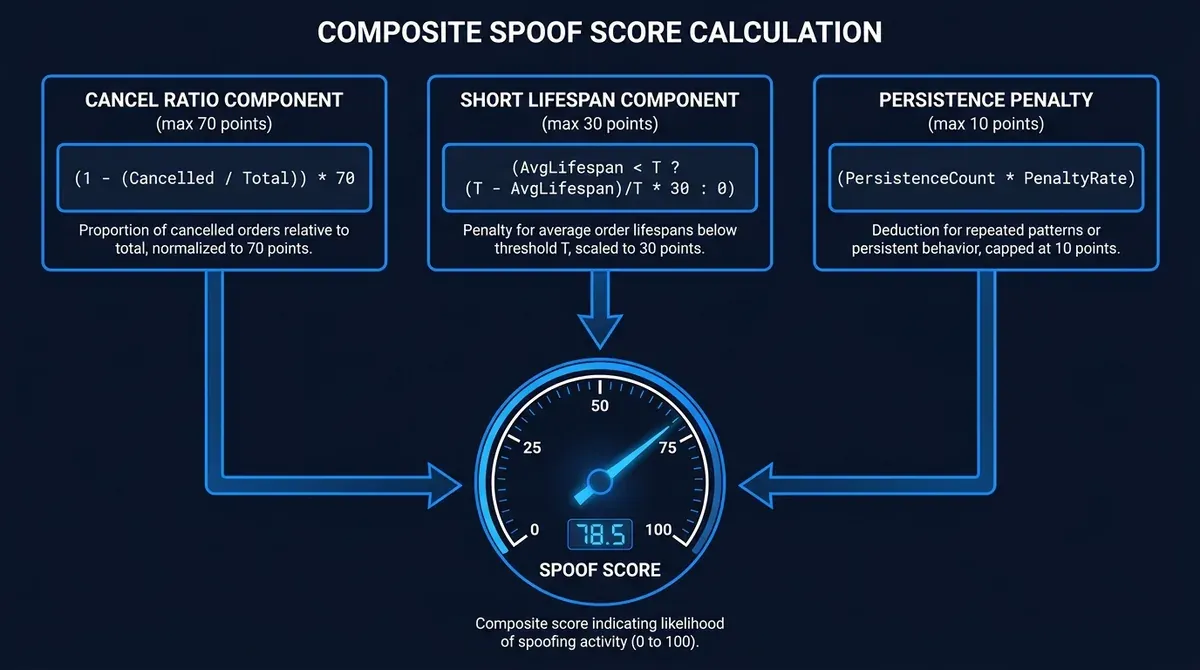
Athenum illustration showing the three components of the spoof score formula combining into a 0-100 composite
Education

What is a spoof score?

An Athenum-proprietary metric, scored 0 to 100, that quantifies how much of a crypto venue's displayed orderbook depth behaves like spoofing rather than real-money intent.

Athenum AnalyticsAthenum Analytics
May 9, 202610 min
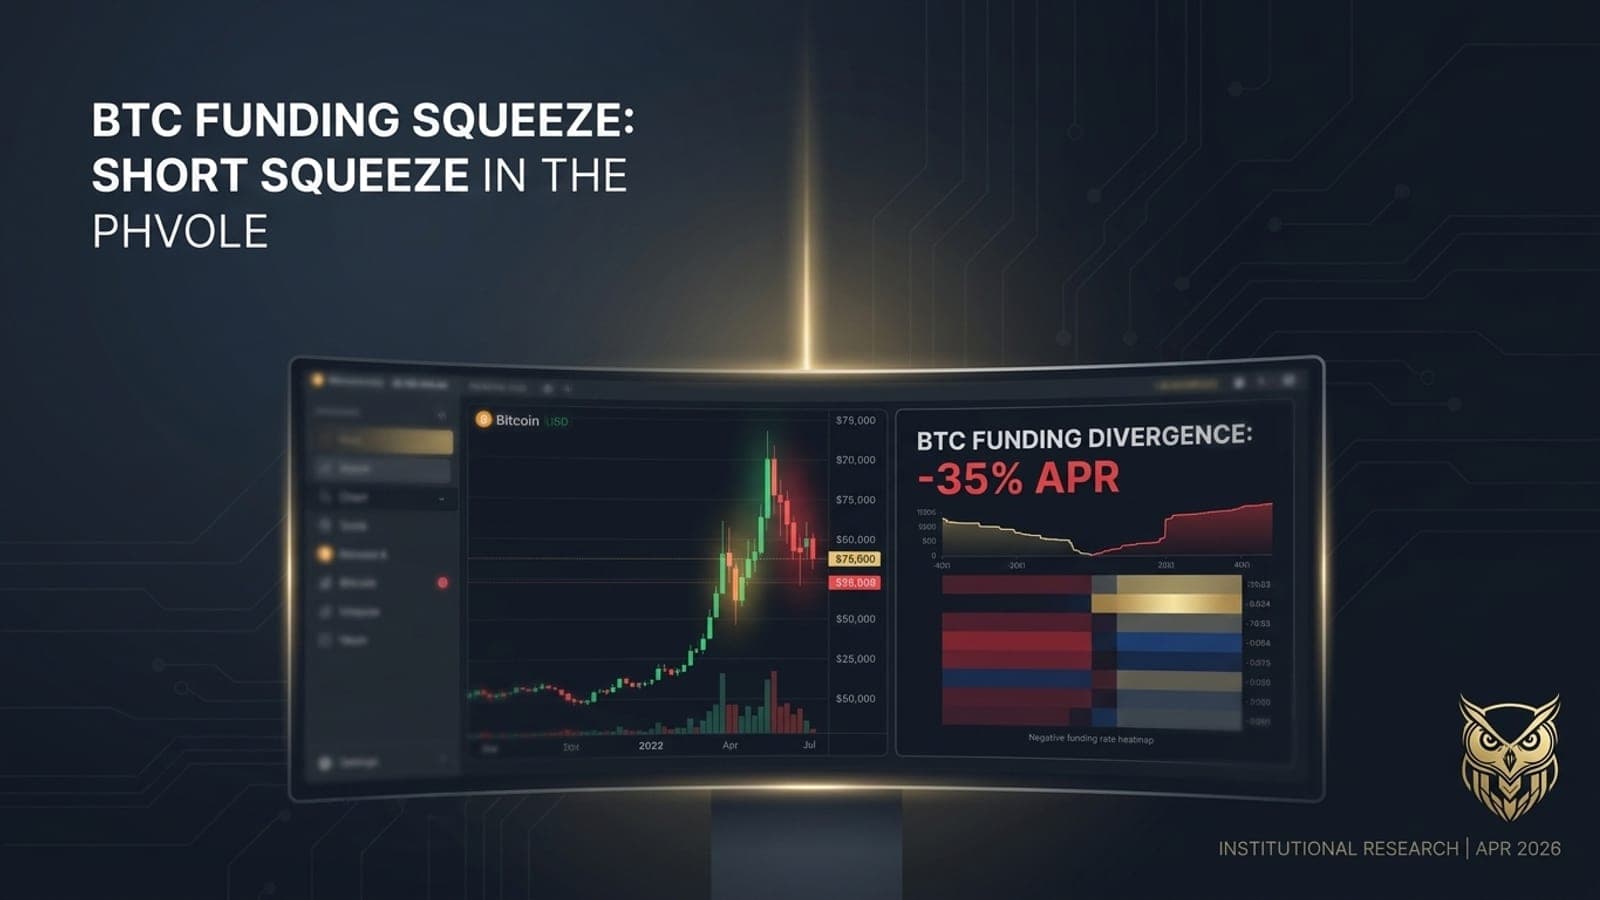
Feature image for Bitcoin Funding Divergence: The -35% APR Short Squeeze Trap at $75K
Trading Strategy

Bitcoin Funding Divergence: The -35% APR Short Squeeze Trap at $75K

Bitcoin's push above $75,000 in mid-April 2026 triggered one of the most significant positioning divergences in the perpetual futures market since 2023. Funding rates across major exchanges collapsed

Athenum AnalyticsAthenum Analytics
Apr 19, 202611 min
Feature image for Bitcoin and the Cost of Money: How $56 Billion in ETF Capital Broke the Rate Sensitivity Model
Orderbook

Bitcoin and the Cost of Money: How $56 Billion in ETF Capital Weakened the Rate Sensitivity Model

For a decade, Bitcoin traded as a leveraged bet on cheap money. Since spot ETFs launched in 2024, that link has weakened: what $56 billion in ETF net inflows changed, and what still responds to rates.

Athenum AnalyticsAthenum Analytics
Apr 11, 202612 min
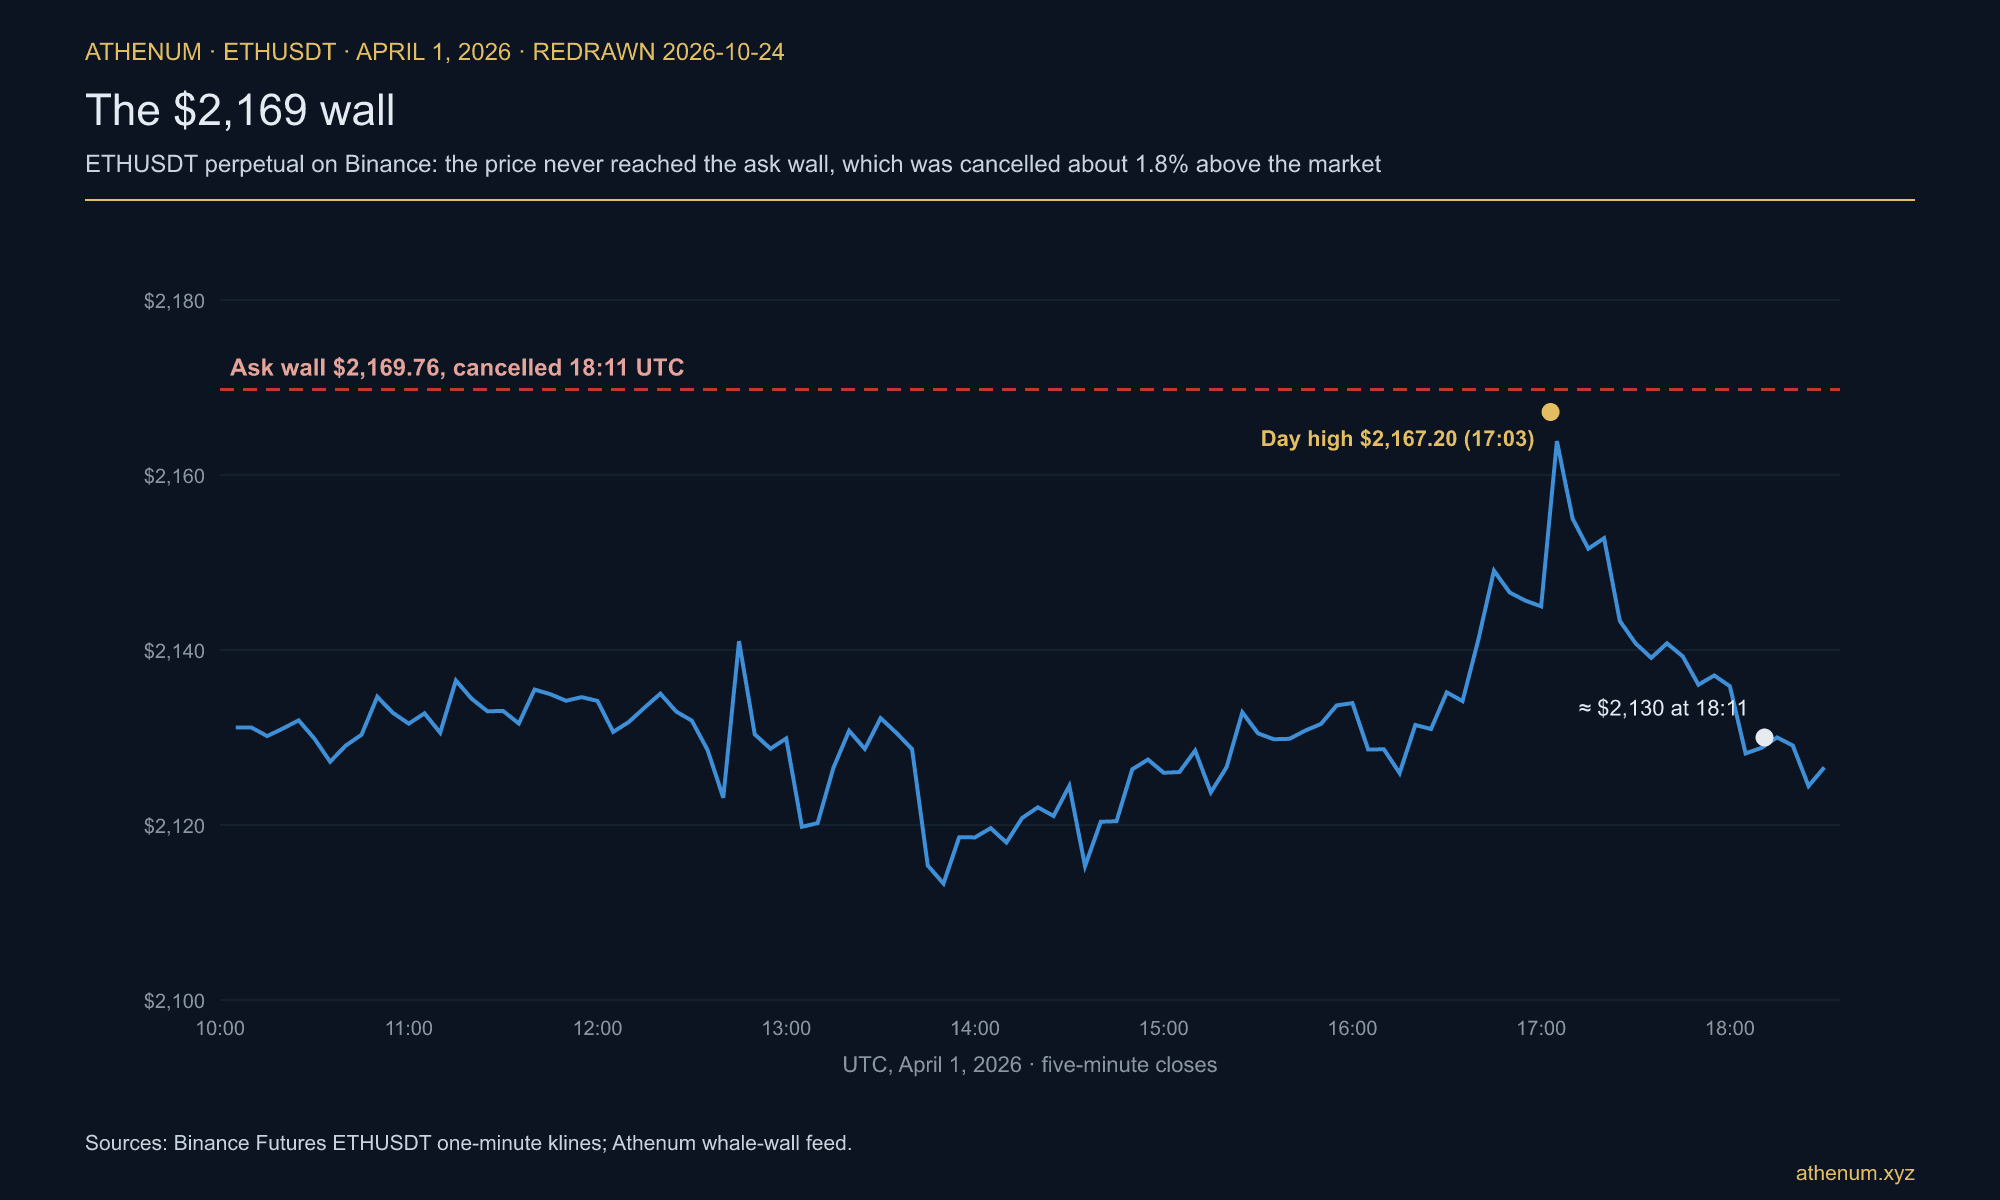
Line chart of the ETHUSDT perpetual price on Binance, April 1 2026, 10:00-18:30 UTC, rising to a $2,167.20 high at 17:03 and falling back to about $2,130, with a dashed line at $2,169.76 marking an ask wall cancelled at 18:11 UTC
Trading Strategy

The $2,169 Wall: Ethereum's Iran Relief Rally Through the Lens of Orderbook Microstructure

Ethereum rose about 5% from March 31 to April 1, 2026 on Iran de-escalation hopes. Athenum's ETHUSDT orderbook shows a bid-heavy book, then a -0.996 inversion.

Athenum AnalyticsAthenum Analytics
Apr 2, 202613 min
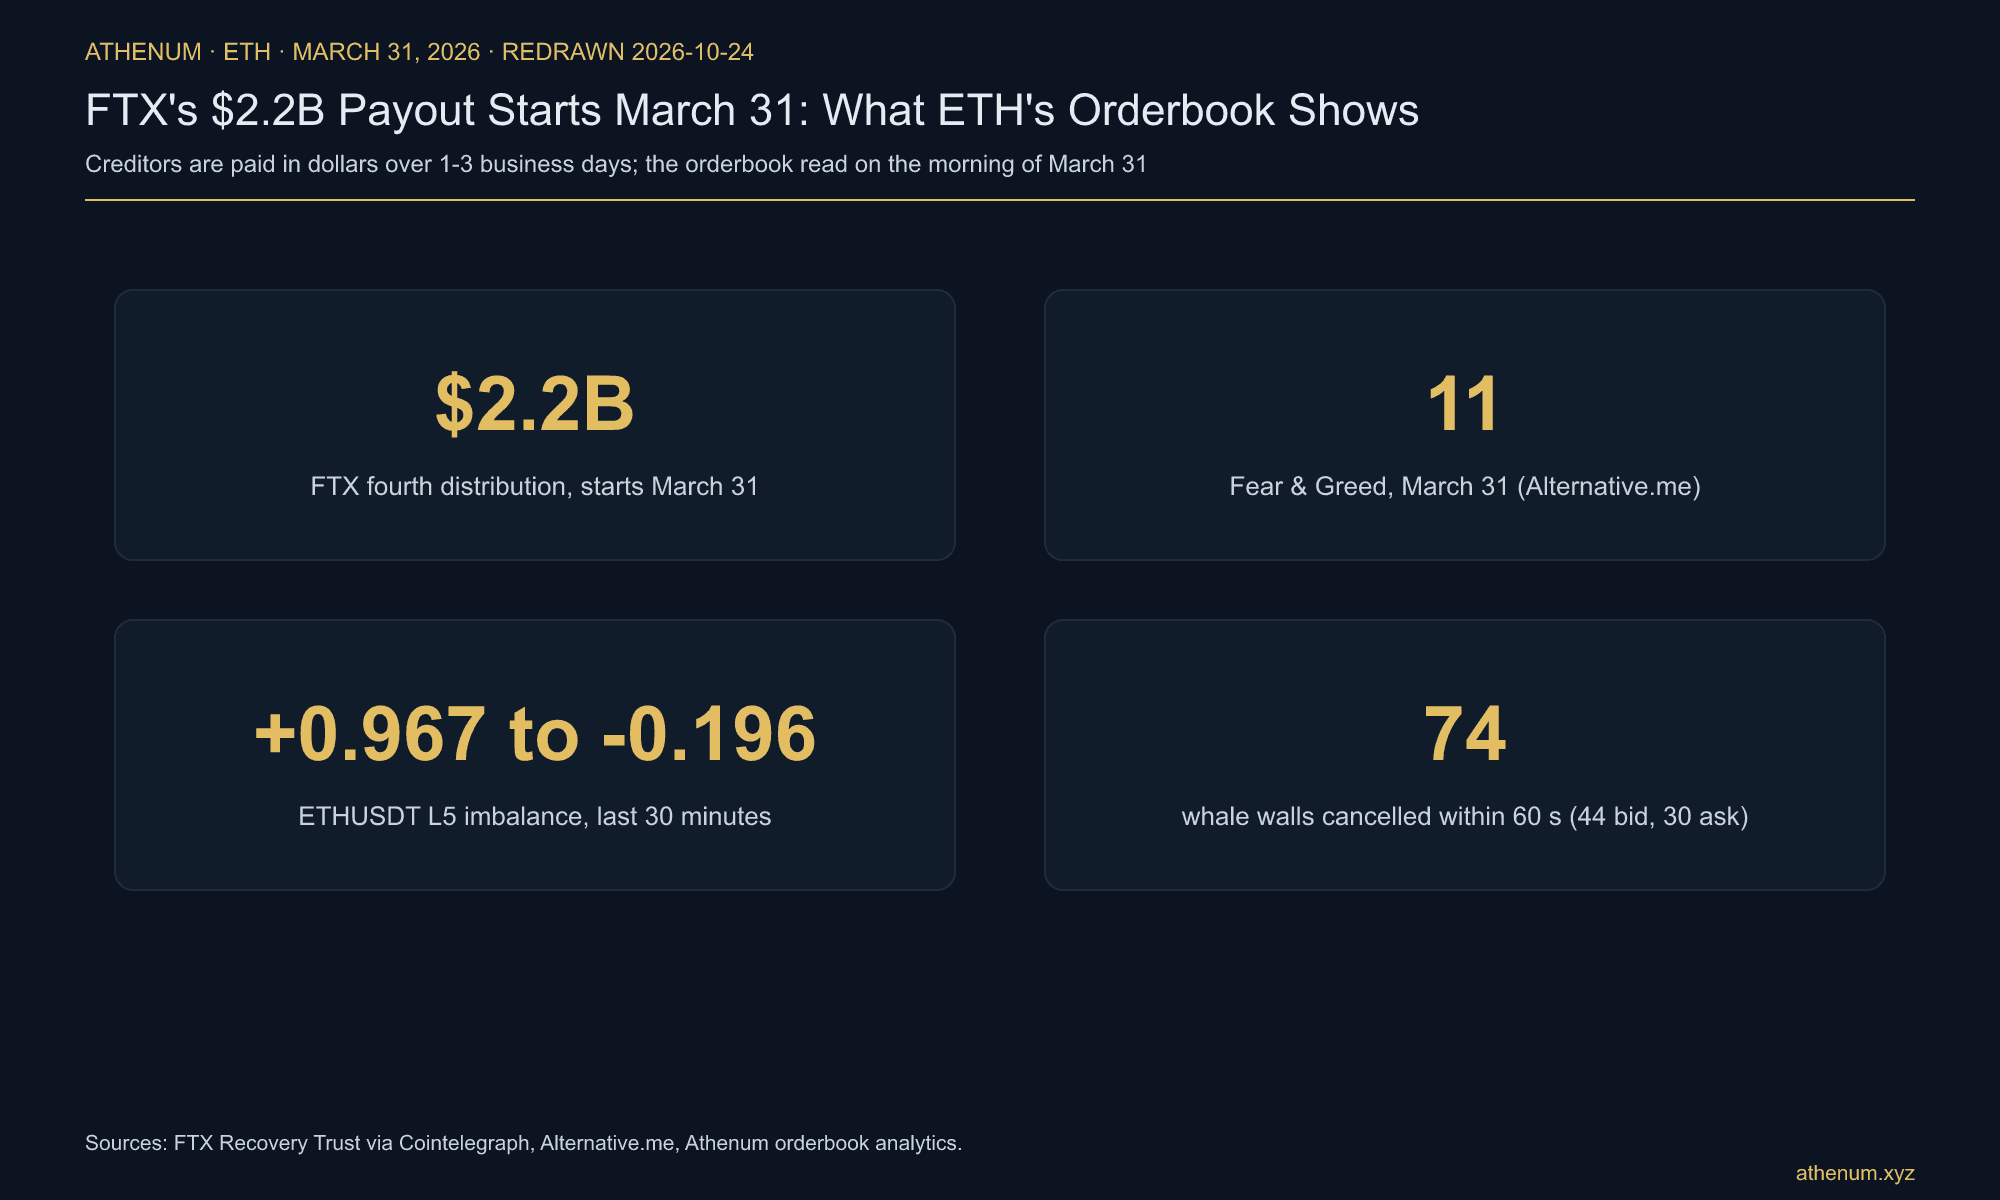
Data card for the FTX distribution and ETH orderbook on March 31, 2026: $2.2 billion fourth FTX distribution starting March 31, Fear and Greed Index 11 (Extreme Fear), ETHUSDT L5 imbalance ranging from +0.967 to -0.196 in the last 30 minutes, and 74 whale walls cancelled within 60 seconds (44 bid, 30 ask).
Trading Strategy

FTX's $2.2B Payout Starts March 31: What ETH's Orderbook Shows

FTX's fourth distribution starts paying $2.2 billion on March 31. ETH's orderbook shows fast-flipping imbalance and $55M of cancelled whale walls.

Athenum AnalyticsAthenum Analytics
Apr 1, 202612 min
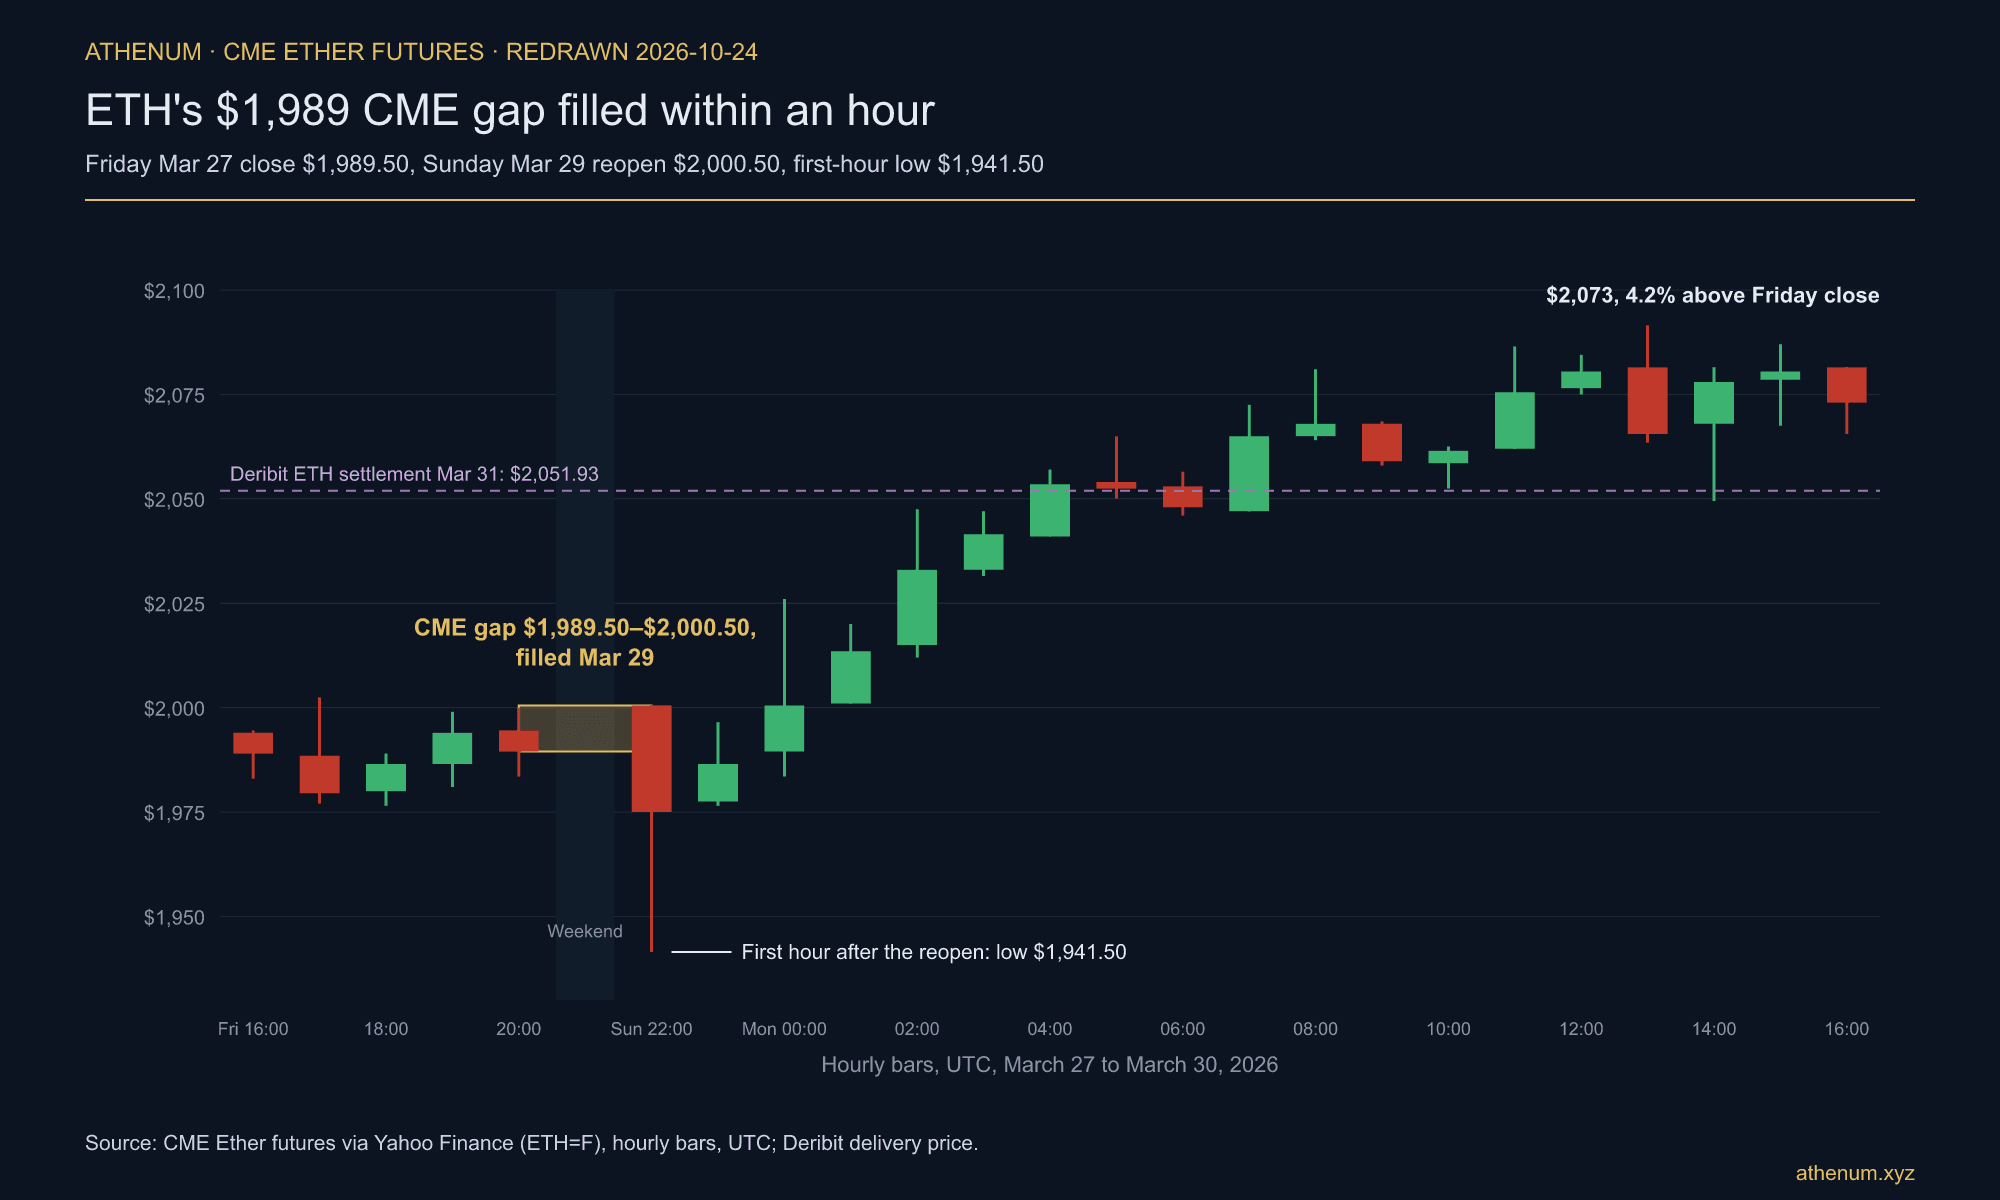
Hourly chart of CME Ether futures (ETH=F) from Friday, March 27 to Monday, March 30, 2026, UTC: the gap between the $1,989.50 Friday close and the $2,000.50 Sunday open is shaded and labelled filled on March 29, after futures traded down to $1,941.50 in the first hour of the reopen; ETH futures reached $2,073 by Monday afternoon, 4.2% above the Friday close.
Trading Strategy

ETH's $1,989 CME Gap Filled in an Hour, and the Eight-Day ETF Exodus

ETH CME futures closed at $1,989.50 on March 27 and reopened at $2,000.50; the gap filled within an hour, during eight days of ETF outflows.

Athenum AnalyticsAthenum Analytics
Mar 31, 202611 min
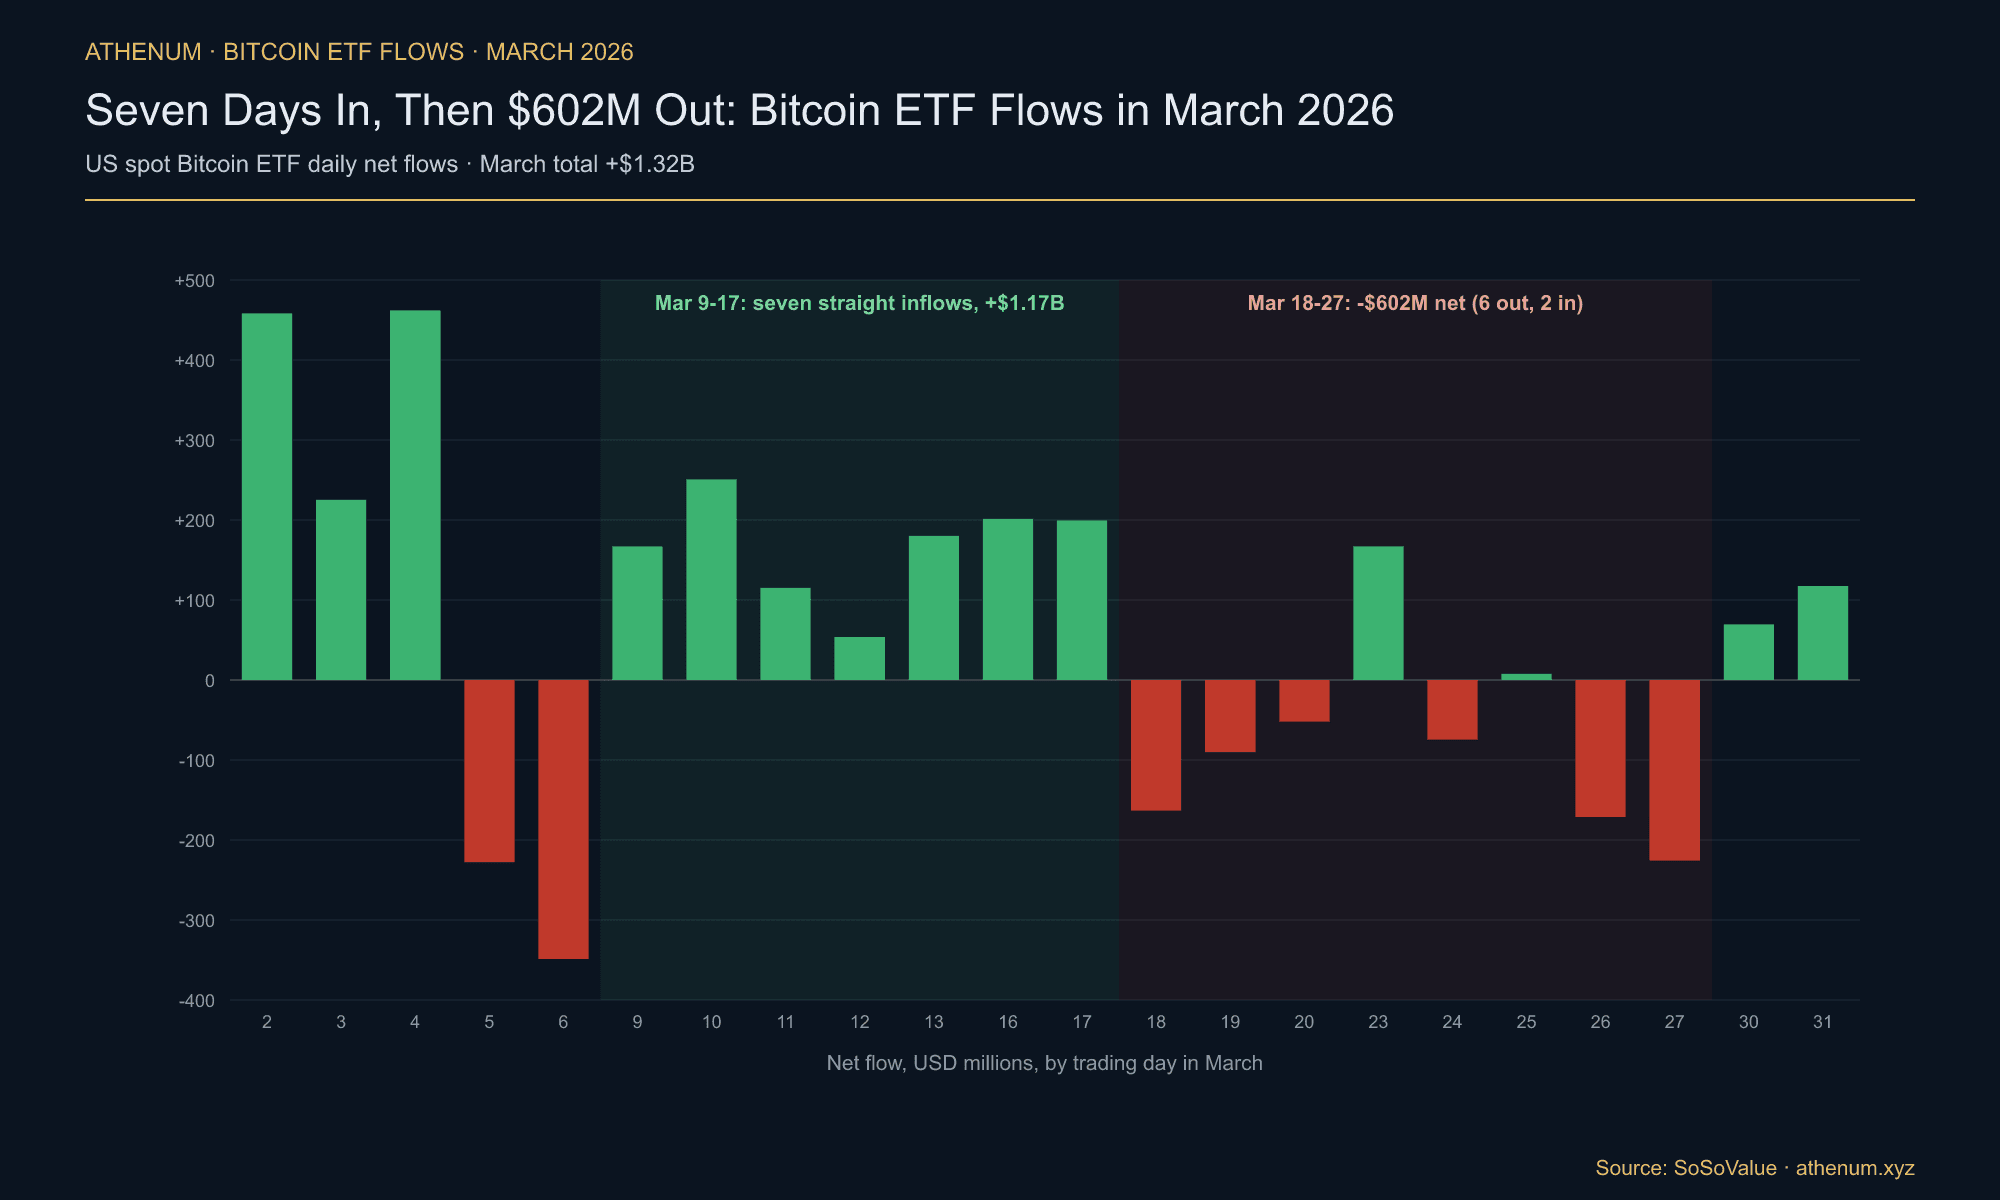
Bar chart of daily net flows into US spot Bitcoin ETFs for the 22 trading days of March 2026 (SoSoValue), with the March 9 to 17 inflow streak highlighted at +$1.17 billion, a March 18 to 27 bracket at -$602 million net (6 outflow days, 2 inflow days) and a March total of +$1.32 billion, under the title Seven Days In, Then $602M Out: Bitcoin ETF Flows in March 2026.
Trading Strategy

Seven Days In, Then $602M Out: Bitcoin ETF Flows in March 2026

US spot Bitcoin ETFs took in $1.17 billion over seven straight sessions to March 17, 2026, then shed a net $602 million over the eight sessions to the March 27 options expiry. March still ended up $1.32 billion, with 14 inflow days and 8 outflow days (SoSoValue).

Athenum AnalyticsAthenum Analytics
Mar 31, 202612 min
Feature image for From +6.6% to -12.5% APR in 72 Hours: What Bitcoin Funding Rate Collapse Reveals About Positioning
Research

From +6.6% to -12.5% APR in 72 Hours: What Bitcoin Funding Rate Collapse Reveals About Positioning

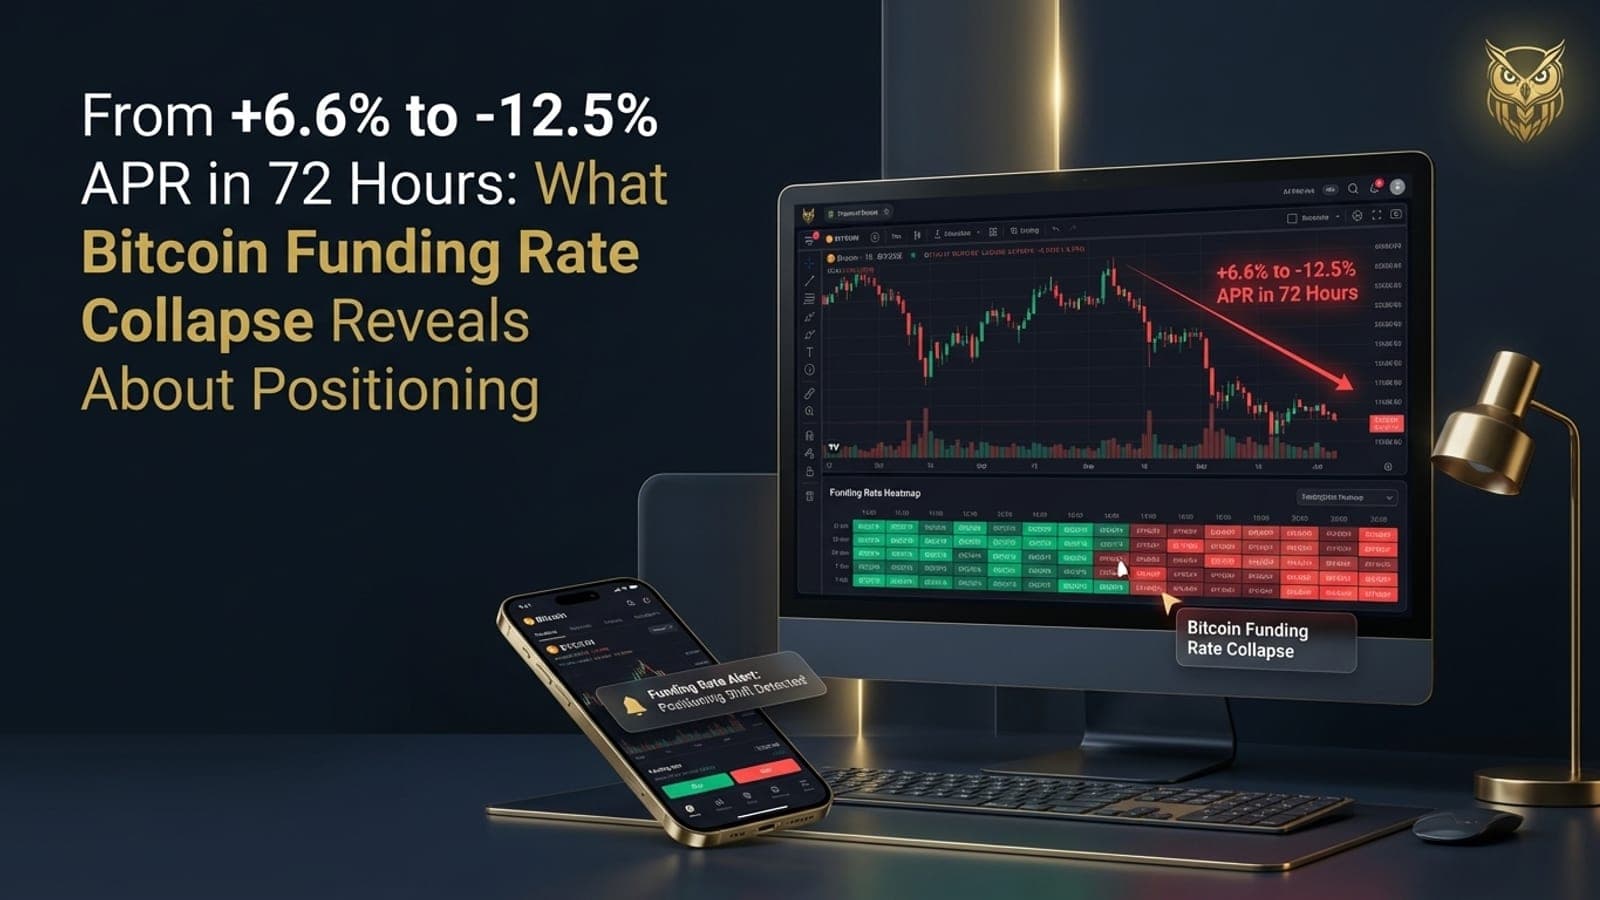
Bitcoin funding rates on Binance collapsed from +6.6% to -12.5% APR in three days. Open interest did not fall. It rose. Traders were not closing longs. They were opening shorts, while a completely different trader base on Hyperliquid stayed positioned long at the maximum positive rate for 48 consecutive hours straight. When two major venues disagree this sharply, the resolution is never quiet.

Athenum AnalyticsAthenum Analytics
Mar 29, 202610 min
Screenshot of Athenum Options Analytics for BTC options on 27 March 2026, timestamped 05:57:02, about two hours before the 08:00 UTC expiry: $13.0B in options expiring that day, spot $68,577.89, max pain $74,000, put/call ratio 0.57, and the note that spot is 7.3% below max pain. Green bars show notional by expiry date and a yellow line shows max pain by expiry, with a dashed line at spot; the table lists max pain $70,000 for 28 March, $69,500 for 29 March, $69,000 for 30 March and 3 April, $70,000 for 10 April, $72,000 for 17 April and $70,000 for 24 April. The levels are a snapshot from before that expiry, not live values.
Trading Strategy

The $5,469 Max Pain Gap: Why Bitcoin Stayed Below $74,000 Into the March 27 Expiry

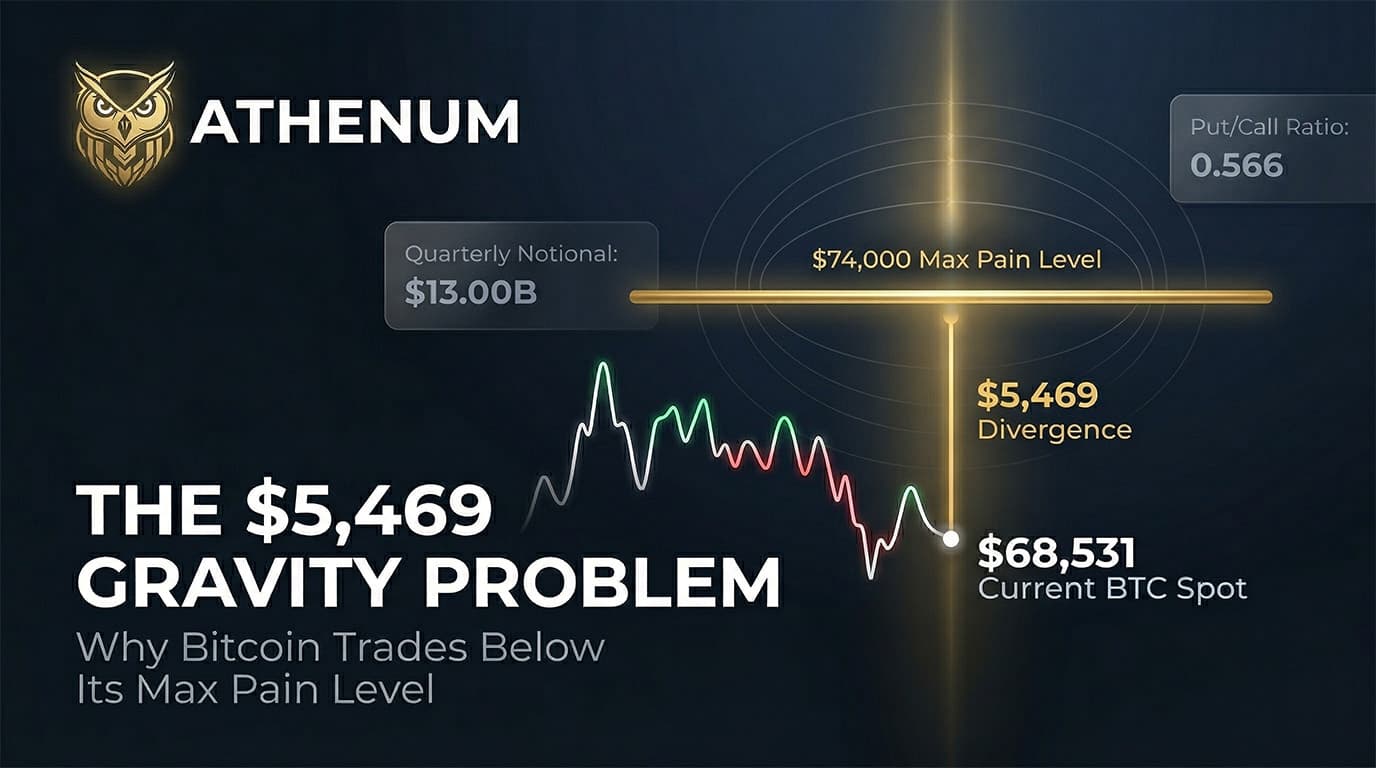
About two hours before the 27 March 2026 quarterly options expiry, Bitcoin traded at $68,531, $5,469 (7.98 percent of spot) below the $74,000 max pain level. Deribit settled the expiry at $68,610.02: max pain did not pull the price up.

Athenum AnalyticsAthenum Analytics
Mar 28, 202611 min
How To Track Crypto Whale Wallets Real Time
Education

How to Track Crypto Whale Wallets in Real Time: The Complete 2026 Guide

Monitor real-time BTC and ETH whale activity with on-chain analytics and orderbook flow. Spot accumulation, exchange inflows, and distribution as it happens.

Athenum AnalyticsAthenum Analytics
Feb 25, 202614 min
Bitcoin Liquidity Analysis Understanding Orderbook Dynamics In 2026
Bitcoin

Bitcoin Liquidity Analysis: Understanding Orderbook Dynamics in 2026

Most traders watch price. Smart traders watch liquidity. Here's everything you need to know about Bitcoin orderbook dynamics in 2026 and why it matters more than ever for protecting your capital.

Jackson LyJackson Ly
Feb 24, 202616 min