What is a spoof score?
An Athenum-proprietary metric, scored 0 to 100, that grades crypto orderbook tape trust by combining cancel ratio, wall lifespan, and persistence.
On 26 March 2025, a single trader on Hyperliquid stacked walls on the JELLY perp orderbook, drove the visible book in one direction, and closed positions before the walls had a chance to fill. JELLY is a high-risk crypto-asset and you may lose all capital. The walls evaporated as price moved.
Hyperliquid's HLP vault took the other side. By the time validators voted to delist the contract and force-settle, the vault sat on a $13.5 million unrealised loss. The walls that "supported" the move never resolved into trades. They were never meant to.
A spoof score tells you which walls behave that way before the cancellation, not after. A reading of 8 looks like the deepest perp book in crypto. A reading of 53 looks like a venue where most large orders never had any intention of being filled.
The same $1 million bid is not the same $1 million bid. Tape trust is the difference, and a spoof score is how you measure it.

What is a spoof score?
A spoof score is an Athenum-proprietary metric, scored 0 to 100, that quantifies how much of a venue's displayed orderbook depth behaves like spoofing rather than real-money intent. Three inputs feed it on a rolling 24-hour window: cancel ratio, average wall lifespan, and persistence of resting size as price approaches.
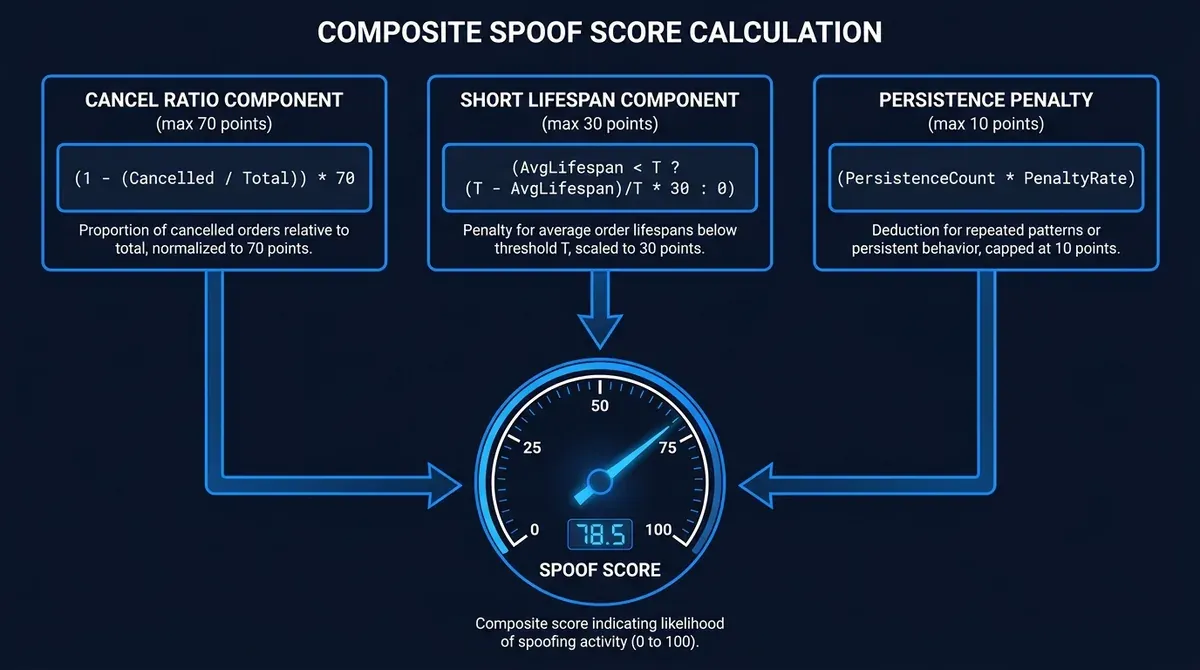
A whale wall is any limit order at or above $500,000 USD notional. The score weights cancel ratio at up to 70 points, wall lifespan at up to 30 points, and the persistence penalty at up to 10 points, then clamps to 100. The bands matter more than the absolute number:
Spoof score | Reading | What it tends to mean |
|---|---|---|
0 to 30 | Low | Walls are mostly real-money intent |
30 to 50 | Moderate | Mixed real and probe orders |
50 to 70 | Elevated | Large walls cancelling within minutes is the modal pattern |
70 plus | High | Most large walls don't survive to fill; phantom-liquidity environment |
A move from below 40 into the 70-plus band over a few hours is what makes the metric a leading indicator.
Real walls sit. Phantom walls don't.
A trader who lets a $5 million bid rest for hours carries real exposure. A trader who cancels the same bid in seven seconds is paying for the display, not the position. If you market-sold $2 million into each wall, what would the fill quality look like, and why would the two venues differ? That gap is what a spoof score compresses into a number.
How is a spoof score calculated?
The cancel-ratio component asks: of whale-sized orders observed over the prior 24 hours, what share were cancelled rather than filled? A venue where 30 percent of walls cancel scores higher than one where 10 percent do. The component is cancel_ratio * 70, capping at 70 points.
The short-lifespan component weights brief walls. A 30-minute average lifespan looks normal; a 30-second lifespan is the signature of probing or spoofing. The formula is (1 / max(lifespan_minutes, 1)) * 30. Walls averaging one minute or longer hit the floor; walls averaging seven seconds max out the contribution at 30 points.
The persistence penalty weights what share of resting size remains as price approaches. A wall that pulls before being touched contributes more than one walked through and partially filled.
The three sum and clamp to 0-100.
A worked example. Venue X reports cancel ratio 0.20, average wall lifespan 90 seconds, persistence 0.7. Cancel component = 0.20 * 70 = 14. Short-lifespan component = (1 / 1.5) * 30 = 20. Persistence penalty = (1 - 0.7) * 10 = 3. Total: 37 points. Moderate band: roughly a fifth of large walls cancel, and typical wall life is short enough to suggest active probing.
Check yourself. A venue reports cancel ratio 0.45, average lifespan 12 seconds, persistence ratio 0.55. What is the composite spoof score, and which interpretation band does it fall into?
>
Answer: Cancel =0.45 * 70 = 31.5. Lifespan =30(term caps once avg drops below one minute). Persistence =(1 - 0.55) * 10 = 4.5. Total: 66, the elevated band. That's roughly where the score crosses from "interpret with caution" to "do not trust as standalone signal."
Why does a spoof score matter?
Most depth measurements treat displayed liquidity as if it were real. A standard market-depth chart renders a $50 million wall the same way regardless of whether the wall sits for 12 hours or 12 seconds. A trader sizing a stop against it will mechanically over-weight phantom depth without a venue-by-venue trust adjustment.
The October 11 2025 cascade is the cleanest documented case [oct-11-2025-cascade]. In the four hours before USDe collateral repriced and triggered cross-margin auto-deleveraging across six exchanges, the BTCUSDT spoof score on Binance peaked at 67. The book looked normal on standard tooling. The score said the depth was substantially decoration. When the cascade hit, the cancellations were already underway.
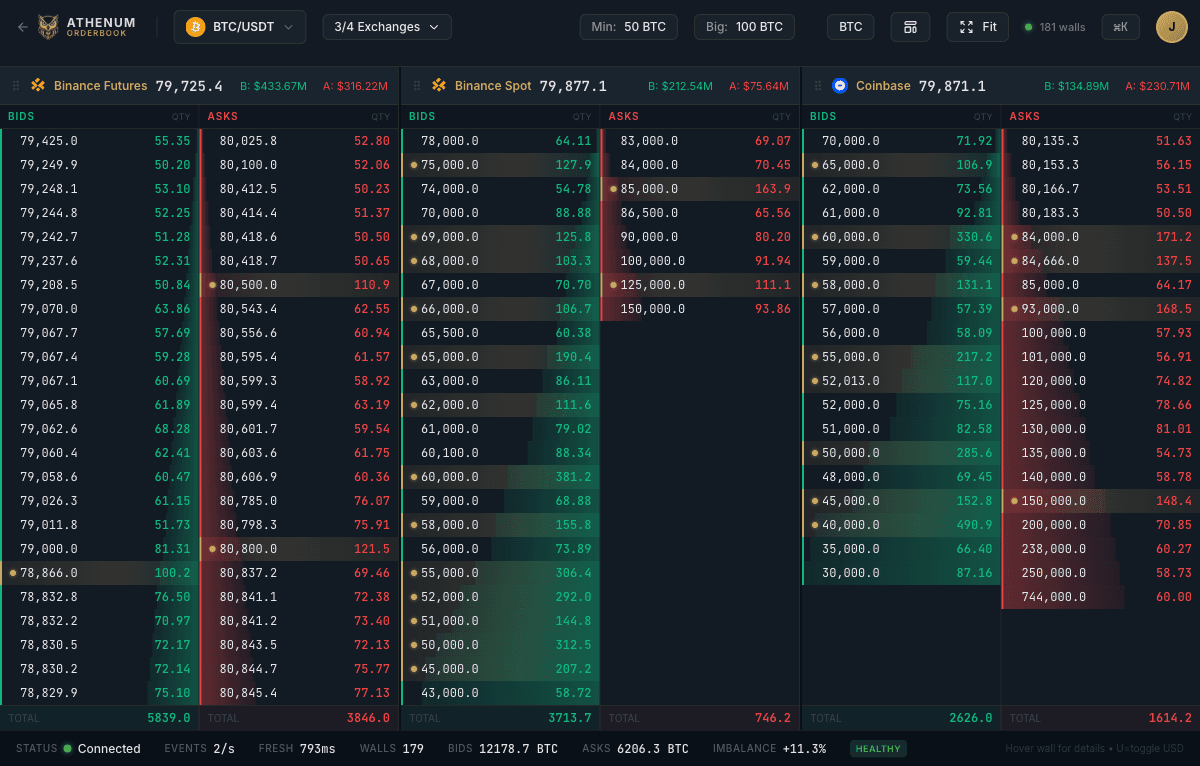
Check yourself. A trader sees a $40 million bid wall on Binance Spot at $80,000 BTC. Spoof score reads 14 there. Coinbase Spot, with a similar wall at the same level, reads 21. Which wall is more likely to absorb a $5 million market sell?
>
Answer: Binance Spot at score 14 is the more credible level. The gap comes from cancel ratio (about 12 versus 28 percent) and lifespan (~80 versus ~20 minutes). On Binance, four of five walls in this size class tend to survive. On Coinbase, closer to one in three cancel first.
When does a spoof score matter most?
The score is most actionable in three windows.
Pre-cascade. When a major venue's score moves from below 40 to above 65 within four hours, the documented signature is a shift toward phantom liquidity that often precedes a directional move. A $42 million bid wall cancelled four minutes before the James Wynn $100M+ Hyperliquid liquidation [james-wynn-100m] is the same pattern at single-trader scale.
Cross-venue arbitrage. When two venues show similar headline depth but spoof scores differ by 30 points or more, sizing across both over-weights one venue's depth.
Single-asset attack windows. The Hyperliquid incident on 26 March 2025 [hyperliquid-jelly-mar-2025] showed how an isolated low-cap perp can be turned into a weapon against the platform's own liquidity vault. Thin perps are where readings are noisiest, and where consequences propagate fastest.
Check yourself. A new perp listing shows spoof score 40 on day one with sample size 800. The same perp shows 55 on day five with sample size 14,000. Should the day-five reading be trusted more or less than the day-one, and what does the sample-size growth imply?
>
Answer: The day-five reading is more reliable; sample size grew roughly seventeen-fold. The score climbed despite that, meaning the cancel-ratio and lifespan distribution worsened as activity accumulated. A score that climbs into a growing sample is a signal of escalating spoof behaviour, not measurement noise.
How to read spoof score on Athenum
Pull the venue-level breakdown on the orderbook quality view. Per-venue spoof score sits alongside cancel ratio, lifespan, and sample size. Filter for sample size above 10,000 to discard low-confidence readings.
Compare to the cross-venue median for the same asset. Twenty points above the median is elevated; thirty above is actionable.
Cross-reference against Athenum's L5 imbalance and wall lifespan on the same venue. A high spoof score combined with strong-bearish L5 and sub-minute median wall lifespan is the documented pre-cascade signature in the cluster. The value is in the intersection.
Live view: orderbook quality. The same view ties back to whale wall mechanics for cluster context.

Frequently asked
What's a normal spoof score for a major venue?
Most venues with active market-maker programs and material institutional flow tend to show readings in the 5 to 25 band on liquid pairs. Readings above 30 reliably indicate cancel ratios are running well above the venue's typical baseline.
Does a high spoof score mean the venue is allowing manipulation?
No. The score measures orderbook behaviour, not intent or legality. Legitimate high-frequency market makers can produce cancel ratios above 80 percent during normal inventory rotation. The score flags structural conditions that elevate cancel ratio independent of manipulative intent.
Can a spoof score predict price direction?
No. The score quantifies book quality, not directional positioning. A high score tells you displayed depth is unreliable; it doesn't tell you whether the next move is up or down. Pair the score with L5 imbalance for a directional reading.
Latest Athenum reading
Venue | Spoof score | Avg lifespan | Cancel ratio | Sample |
|---|---|---|---|---|
Binance Futures | 8.46 | 41,231 s | 12.0% | 614,545 |
Binance Spot | 14.66 | 4,887 s | 20.4% | 33,560 |
Coinbase Spot | 20.81 | 1,245 s | 27.7% | 48,426 |
Hyperliquid Perp | 53.01 | 7.42 s | 32.9% | 88,220 |
Snapshot: 2026-05-08T08:31:41Z
Refreshes quarterly. View live: orderbook quality.
>
The 6.3-times spread between Binance Futures and Hyperliquid Perp on the same asset, in the same minute, is what this metric is built to surface. Hyperliquid's average wall lifespan of 7.42 seconds against Binance Futures' 41,231 seconds is what generates the gap.
Recap
- Reproduce the spoof score formula in your own words. Name the three components and their point caps.
- State which band crosses from "interpret with caution" to "do not trust as standalone signal," and explain the underlying behaviour at that level.
- Identify the documented pre-cascade signature combining spoof score, L5 imbalance, and wall lifespan.
Sources
- SSRN: Anatomy of the Oct 10-11 2025 Crypto Liquidation Cascade
- Solidus Labs: When Whales Whisper, Inside the $20B Crypto Meltdown
- CoinDesk: How James Wynn's $100M Implosion Is a Leverage Tale as Old as Time
- CoinDesk: Hyperliquid Delists JELLYJELLY After Vault Squeezed in $13M Tussle
- Halborn: Explained: The Hyperliquid Hack (March 2025)
How this report was produced
- Data sources: Athenum's orderbook quality endpoint (per-venue spoof score, cancel ratio, average lifespan, sample size); Athenum whale-walls and L5 imbalance feeds for cross-cluster context; primary case-study sources cited in the body.
- Snapshot timestamp: 2026-05-08T08:31:41Z (UTC). Methodology version: orderbook-signal-v1.
- Quantitative analysis was assisted by automated tooling; the editorial judgment, framing, and conclusions are Athenum Research's.
- Last reviewed: 2026-05-08.
Important disclosures
This is a marketing communication. It is not investment advice and has not been prepared in accordance with legal requirements designed to promote investment research independence.
This article is general market commentary published on a regular and impersonal basis. It does not constitute investment, legal, or tax advice, is not a recommendation to buy or sell any asset, and does not consider your individual circumstances. Consult a licensed advisor before acting.
Crypto-assets are highly volatile and you may lose all capital invested. Past performance is not a reliable indicator of future results.
Author position disclosure: The author and Athenum Analytics do not hold a position in BTC, ETH, or JELLY. Any positions are disclosed at time of publication and may change without notice.
Data sources: Athenum sources data from Binance, Coinbase, and Hyperliquid. Athenum has no equity, revenue-share, or referral relationship with these venues.
Athenum Analytics is a data analytics provider and was not compensated by any third party for this content.
Supporting Screenshots
Manus-supplied evidence attached to this draft.
One terminal. All the data.
Liquidations, orderbook depth, whale walls & open interest from 4 exchanges, all real-time, in one place.
No credit card required