Bitcoin and the Cost of Money: How $56 Billion in ETF Capital Broke the Rate Sensitivity Model
For a decade, Bitcoin traded as a leveraged bet on cheap money. When the 30-year mortgage rate dropped, BTC surged. When it spiked, BTC collapsed. The relationship was clean, intuitive, and almost mechanical.
Then, somewhere between January 2024 and today, it broke.
BTC is trading at $72,905 with mortgage rates at 6.37%. The last time rates were at this level, in late 2022, Bitcoin was worth $16,000. Same cost of capital. Four and a half times the price. Something structural changed, and understanding what that something is matters more than any chart pattern or MACD crossover.
The Transmission Mechanism: Why Bitcoin Cares About Interest Rates
Before examining the data, it helps to understand why Bitcoin and mortgage rates were ever correlated at all. Bitcoin has no cash flows, no dividends, no yield. It produces nothing. In classical finance, the value of a non-yielding asset is inversely related to interest rates because of a concept called opportunity cost.
When the 30-year mortgage rate sits at 2.65%, as it did in January 2021, the entire financial system is starving for returns. Savings accounts pay nothing. Treasuries pay next to nothing. Corporate bonds barely cover inflation. Capital floods into risk assets because the opportunity cost of holding something speculative is near zero. You are not giving up meaningful safe returns by allocating to Bitcoin.
When the same rate jumps to 7.8%, as it did in October 2023, the math inverts. A risk-free Treasury bill pays 5.3%. A high-yield savings account pays 5%. Even the most conservative investor earns a real return without taking any risk. The opportunity cost of holding Bitcoin, which can lose 30% in a week, becomes enormous. Rational capital exits risk assets and parks in yield-bearing instruments.
This is not speculation. It is the foundation of how institutional portfolio allocation works. Every pension fund, endowment, and wealth manager runs a risk-free rate into their models. When that rate rises, the hurdle for risky assets rises with it. Bitcoin, as the riskiest major asset in the world, sits at the extreme end of this sensitivity spectrum.
The 30-year mortgage rate serves as a useful proxy here because it reflects long-duration credit conditions, captures both Fed policy and market expectations, and directly affects the largest asset class in America: housing. When mortgages are cheap, liquidity is loose. When they are expensive, the entire economy tightens.
Era 1: The Free Money Rally (2020 to 2021)
In March 2020, the Federal Reserve cut the federal funds rate to zero and launched unlimited quantitative easing in response to the COVID pandemic. The 30-year mortgage rate, which had been hovering around 3.5%, began a descent that would take it to 2.65% by January 2021, the lowest level in the 50-year history of the Freddie Mac survey.
The effect on Bitcoin was immediate and dramatic. BTC was trading around $5,000 in March 2020. By November 2021, it had reached $69,000. A 13x move in 20 months.
This was not coincidence, and it was not driven by retail enthusiasm alone. The M2 money supply expanded by $6.3 trillion between February 2020 and March 2022, a 40% increase in two years. That liquidity needed somewhere to go. With Treasury yields near zero, bonds offered no real return. Equities rallied, but for investors seeking asymmetric upside, Bitcoin became the destination.
Several compounding factors amplified the relationship during this period.
Corporate treasuries entered the market. MicroStrategy began accumulating BTC in August 2020, eventually deploying billions. Tesla purchased $1.5 billion in February 2021. These decisions were explicitly framed as responses to low interest rates and currency debasement concerns.
DeFi yield farming exploded. With traditional yields near zero, crypto-native protocols offered 10-50% annual yields on stablecoin deposits. This pulled additional capital from traditional finance into the crypto ecosystem, indirectly supporting BTC prices.
Retail participation surged. Stimulus checks, reduced spending options during lockdowns, and commission-free trading on Robinhood created millions of new crypto buyers. These participants were less rate-sensitive individually, but collectively they represented the same "reach for yield" behavior that was driving institutional flows.
The result was a period where BTC and mortgage rates moved in near-perfect inverse correlation. Every basis point lower in rates seemed to add another thousand dollars to Bitcoin's price.
Era 2: The Rate Shock (2022)
The Federal Reserve began raising the federal funds rate in March 2022. What followed was the most aggressive tightening cycle in 40 years: 11 rate hikes totaling 525 basis points between March 2022 and July 2023.
The 30-year mortgage rate responded by tripling. From 3.11% in January 2022 to 7.79% by October 2023, it recorded its fastest sustained increase since the Volcker era of the early 1980s.
Bitcoin's response was equally dramatic. From its November 2021 peak of $69,000, it fell to $15,500 by November 2022, a 77% decline. The Terra/Luna collapse in May 2022 and the FTX bankruptcy in November 2022 accelerated the drawdown, but the fundamental driver was the same interest rate mechanism described above.
The math was simple. Why hold a volatile, non-yielding asset when the 6-month Treasury bill pays 5.3%? Institutional capital answered that question by exiting. Venture capital funding for crypto startups collapsed from $33 billion in 2021 to $10 billion in 2023, according to PitchBook data. On-chain activity declined. Exchange volumes cratered.
M2 money supply, which had peaked at $21.7 trillion in March 2022, contracted for the first time in modern history, falling to $20.6 trillion by early 2024. This was unprecedented. The monetary fuel that had powered the bull market was not just slowing; it was shrinking.
The correlation between BTC and mortgage rates during this period was striking. As rates rose from 3% to 7%, Bitcoin fell from $48,000 to $16,000. Every major rate decision moved BTC in the expected direction. The inverse relationship held almost perfectly.
Era 3: The Structural Break (2024 to Present)
This is where the historical model fails.
The 30-year mortgage rate ended 2023 near 7.8% and spent the entirety of 2024 between 6.3% and 7.2%. It declined modestly in early 2025 after the Fed began cutting rates in late 2024 (three cuts totaling 100 basis points brought the fed funds rate to 3.5%-3.75%), but the mortgage rate remained elevated. As of April 9, 2026, Freddie Mac reports the 30-year average at 6.37%.
Under the old model, Bitcoin should have continued languishing in the $20,000-$40,000 range, starved of the cheap liquidity that powered its rallies. Instead, BTC surged from $27,000 in October 2023 to $124,720 by October 2025, a 362% rally with mortgage rates between 6% and 7.5% the entire time.
What changed? One event, more than any other, redefined Bitcoin's demand structure: the approval and launch of spot Bitcoin ETFs in January 2024.

The ETF Effect: A New Buyer Class
Before January 2024, buying Bitcoin required either opening an account on a cryptocurrency exchange, managing private keys, or using a trust product like Grayscale's GBTC, which traded at persistent discounts and carried a 1.5% fee. The vast majority of institutional capital, the pension funds, family offices, registered investment advisors, and sovereign wealth managers that collectively control hundreds of trillions in assets, could not or would not navigate these obstacles.
The spot ETF changed this overnight. BlackRock's IBIT, Fidelity's FBTC, and nine other issuers offered Bitcoin exposure through a standard brokerage account, settled through DTCC, with expense ratios as low as 0.14% (Morgan Stanley's MSBT, launched April 9, 2026). No wallets. No exchanges. No custody risk.
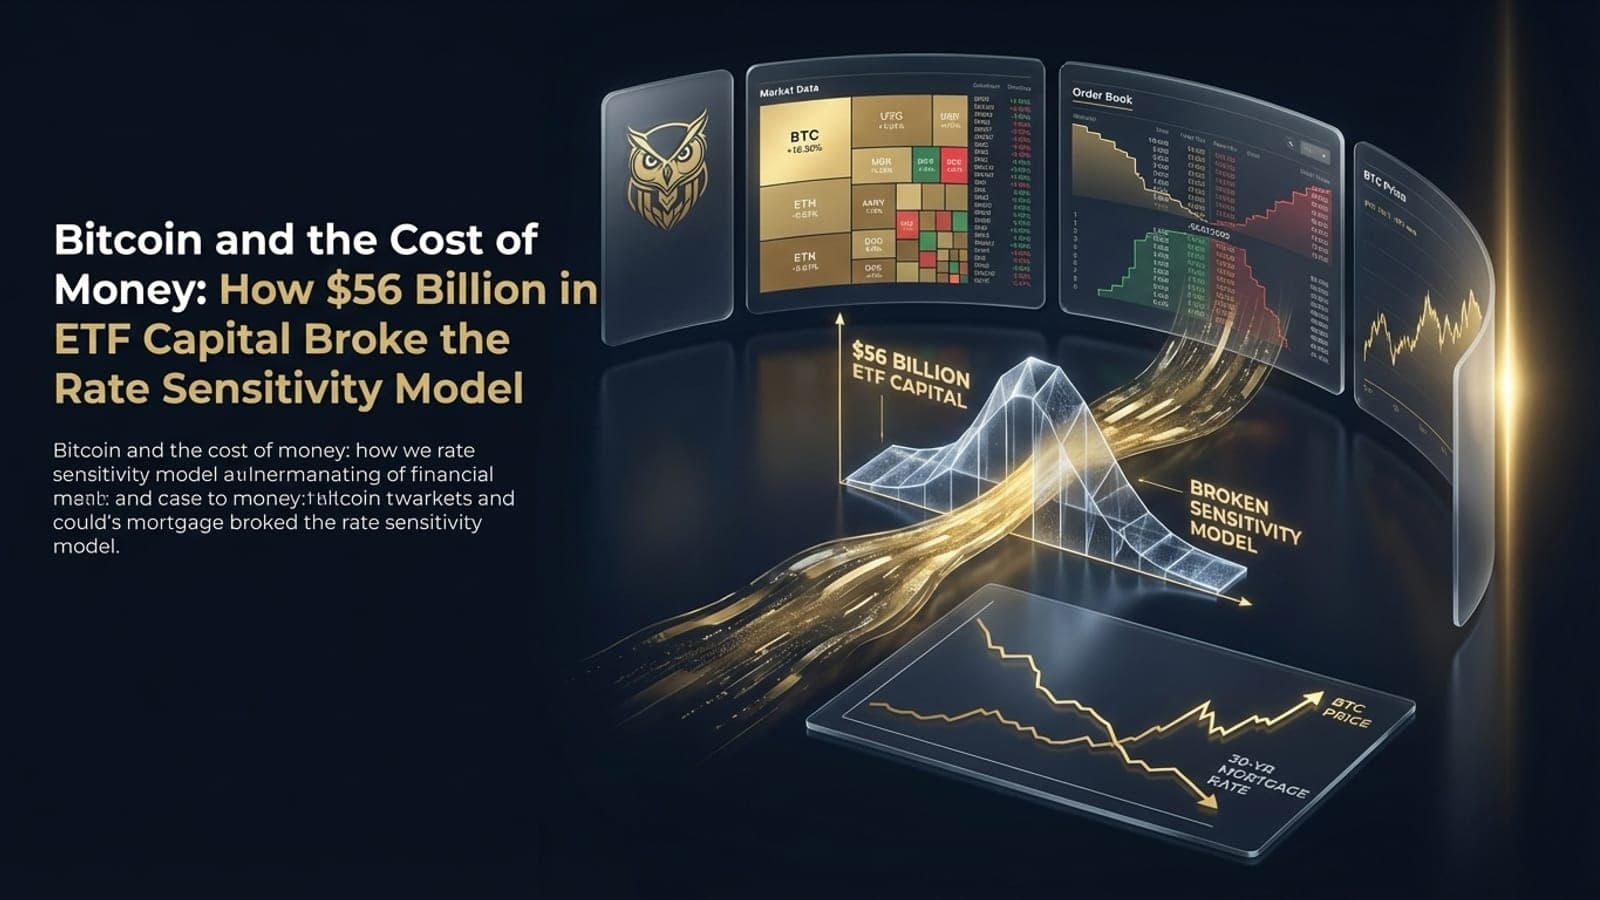
The inflows were staggering. In its first year, the spot Bitcoin ETF complex attracted $35.2 billion in net inflows. By late 2025, total assets under management exceeded $56 billion. As of April 11, 2026, total ETF holdings stand at 721,090 BTC worth $56.75 billion, roughly 3.6% of Bitcoin's circulating supply permanently removed from the free float and held in institutional custody.
This is the structural change that broke the rate sensitivity model. To understand why, consider how these new buyers differ from the participants in Era 1 and Era 2.
Portfolio allocation vs. speculation\n\nETF buyers are not making a leveraged bet on cheap money. They are making a strategic asset allocation decision: 1-5% of a diversified portfolio into a non-correlated alternative asset. This decision is made through an asset-liability framework, not a rate-of-return comparison against Treasuries. A pension fund allocating 2% to Bitcoin through IBIT does not reverse that allocation because mortgage rates moved from 6.3% to 6.5%.
Advisory channel distribution\n\nMorgan Stanley's 16,000 financial advisors can now recommend MSBT directly to their clients. Merrill Lynch, Wells Fargo, and UBS have similar programs. These advisors are managing against long-term financial plans, not trading around interest rate expectations. Once Bitcoin enters a model portfolio, it stays until the model changes, not until rates move.
Structural rebalancing flows\n\nAs BTC price falls, its weight in a model portfolio declines below target. This triggers automatic rebalancing purchases. As BTC price rises above target weight, it triggers partial sales. This creates a countercyclical flow pattern that dampens volatility and provides persistent demand at lower prices, the exact opposite of the speculative flow pattern that dominated Eras 1 and 2.
The data confirms this behavior. On April 7, 2026, while BTC was falling and Crypto Twitter was debating "bull trap" scenarios, ETF investors were net sellers of $2.31 billion worth of BTC. But by April 10, IBIT alone had attracted $1.92K BTC in a single session, with broad-based buying across six issuers totaling 3,350 BTC ($240 million). The total complex is now just $80 million short of reclaiming its full 2025 year-end net inflow level. Institutions sold the initial panic and bought the stabilization, exactly as portfolio rebalancing models would predict.
The Residual Sensitivity
This does not mean Bitcoin is immune to interest rates. It means the sensitivity has structurally decreased. The old model, where BTC was essentially a leveraged call option on liquidity, has given way to a more complex regime where rate sensitivity coexists with persistent institutional demand.
The evidence suggests BTC now has two demand layers.

Layer 1: Rate-sensitive (speculative)\n\nRetail traders, leveraged futures positions, DeFi participants. This capital behaves the way it always has: it enters when money is cheap and exits when it gets expensive. This layer still responds to mortgage rates, funding rates, and Fed policy.
Layer 2: Rate-insensitive (structural)\n\nETF allocations, corporate treasury positions (Strategy/MicroStrategy alone holds over 500,000 BTC), sovereign reserve allocations. This capital responds to portfolio allocation models, not interest rate differentials. It provides a floor under price that did not exist before 2024.
The interplay between these layers explains the 2026 price action. BTC fell from $124,720 (October 2025 all-time high) to $60,000 during the Iran crisis in March 2026. That 52% drawdown was driven by Layer 1 exiting: leveraged positions liquidated, retail panic-sold, funding rates went deeply negative. But it did not fall to $16,000 as it would have in 2022 at similar rate levels, because Layer 2 held. ETF outflows occurred but were modest relative to AUM, and they reversed within weeks.
The Numbers in Context
The chart overlay of BTC and the 30-year mortgage rate tells a clean visual story, but the numbers beneath it reveal the structural shift in concrete terms.

The most telling comparison is the last column. In November 2022, BTC was at $16,000 with zero ETF capital providing structural support. Today, at nearly identical mortgage rates, BTC trades at $73,000 with $56.7 billion in ETF AUM. The difference, roughly 4.5x in price, can be almost entirely attributed to the change in demand structure.
M2 money supply has also shifted. At $22.6 trillion, it is growing at 4.8% year-over-year, marking 24 consecutive months of increases. This is the opposite of the M2 contraction that accompanied the 2022 crash. However, M2 velocity remains depressed at 1.41, well below the pre-pandemic level of 1.7+, which means this liquidity is not circulating through the economy as aggressively as the raw supply figure suggests.
What This Means for What Comes Next
The practical implication is that the old heuristic, "rates up, Bitcoin down; rates down, Bitcoin up," is no longer sufficient. It is not wrong, but it is incomplete. The more accurate framework is:
Rate changes still matter for BTC's speculative layer (Layer 1), which drives short-term volatility and can produce 30-50% drawdowns from peak. But rate changes no longer determine BTC's structural valuation floor (Layer 2), which has risen permanently due to ETF-driven institutional adoption.
The current macro environment tests this framework directly. CPI just printed 3.3%, driven by a 21.2% surge in gasoline prices due to the war in Iran. The Fed is on hold at 3.5%-3.75%. The bond market, via breakeven inflation rates, prices the energy shock as transitory: 5-year breakevens at 2.57% versus 10-year breakevens at 2.34%. Mortgage rates at 6.37% are high but stable.
Under the old model, 3.3% CPI with no prospect of rate cuts would be unambiguously bearish for Bitcoin. Under the new model, it is a headwind for Layer 1 (speculative flows will remain cautious) but largely irrelevant for Layer 2 (BlackRock added $269 million in a single session this week while CPI was printing hot).
The cost of money still matters. It just no longer matters as much as it used to. And the $56.7 billion in ETF capital sitting beneath the market is the reason why.
Athenum's live analytics allow traders to track ETF flows and macro regime shifts in real time. Chart built using Athenum's Custom Chart Builder, which overlays 250+ macro and crypto series in a single interface. Explore the complete data terminal at athenum.xyz.
One terminal. All the data.
Liquidations, orderbook depth, whale walls & open interest from 4 exchanges, all real-time, in one place.
No credit card required