Table of Contents6 sections
Practise with worked lessons
- Separate leverage, margin and liquidation risk
Leverage and margin are different risks. Calculate initial margin for one position at two leverage settings; a maintenance buffer is not a liquidation price.
TLDR: The 10x vs 100x leverage decision comes down to one thing above all: how far the price can move against you before the position is liquidated. At 10x an isolated long survives a 9.6% drop; at 100x it dies on a 0.6% wick. With Bitcoin near $63,000 on 2026-07-08 and implied volatility at 40.3, a routine daily move alone wipes out anything above roughly 50x. This guide compares the two settings on the three things that actually change, liquidation distance, fees, and funding, with a worked BTC example you can reproduce in the free Athenum leverage calculator, and it explains why more leverage almost never means more profit.
What actually changes when you move from 10x to 100x leverage?
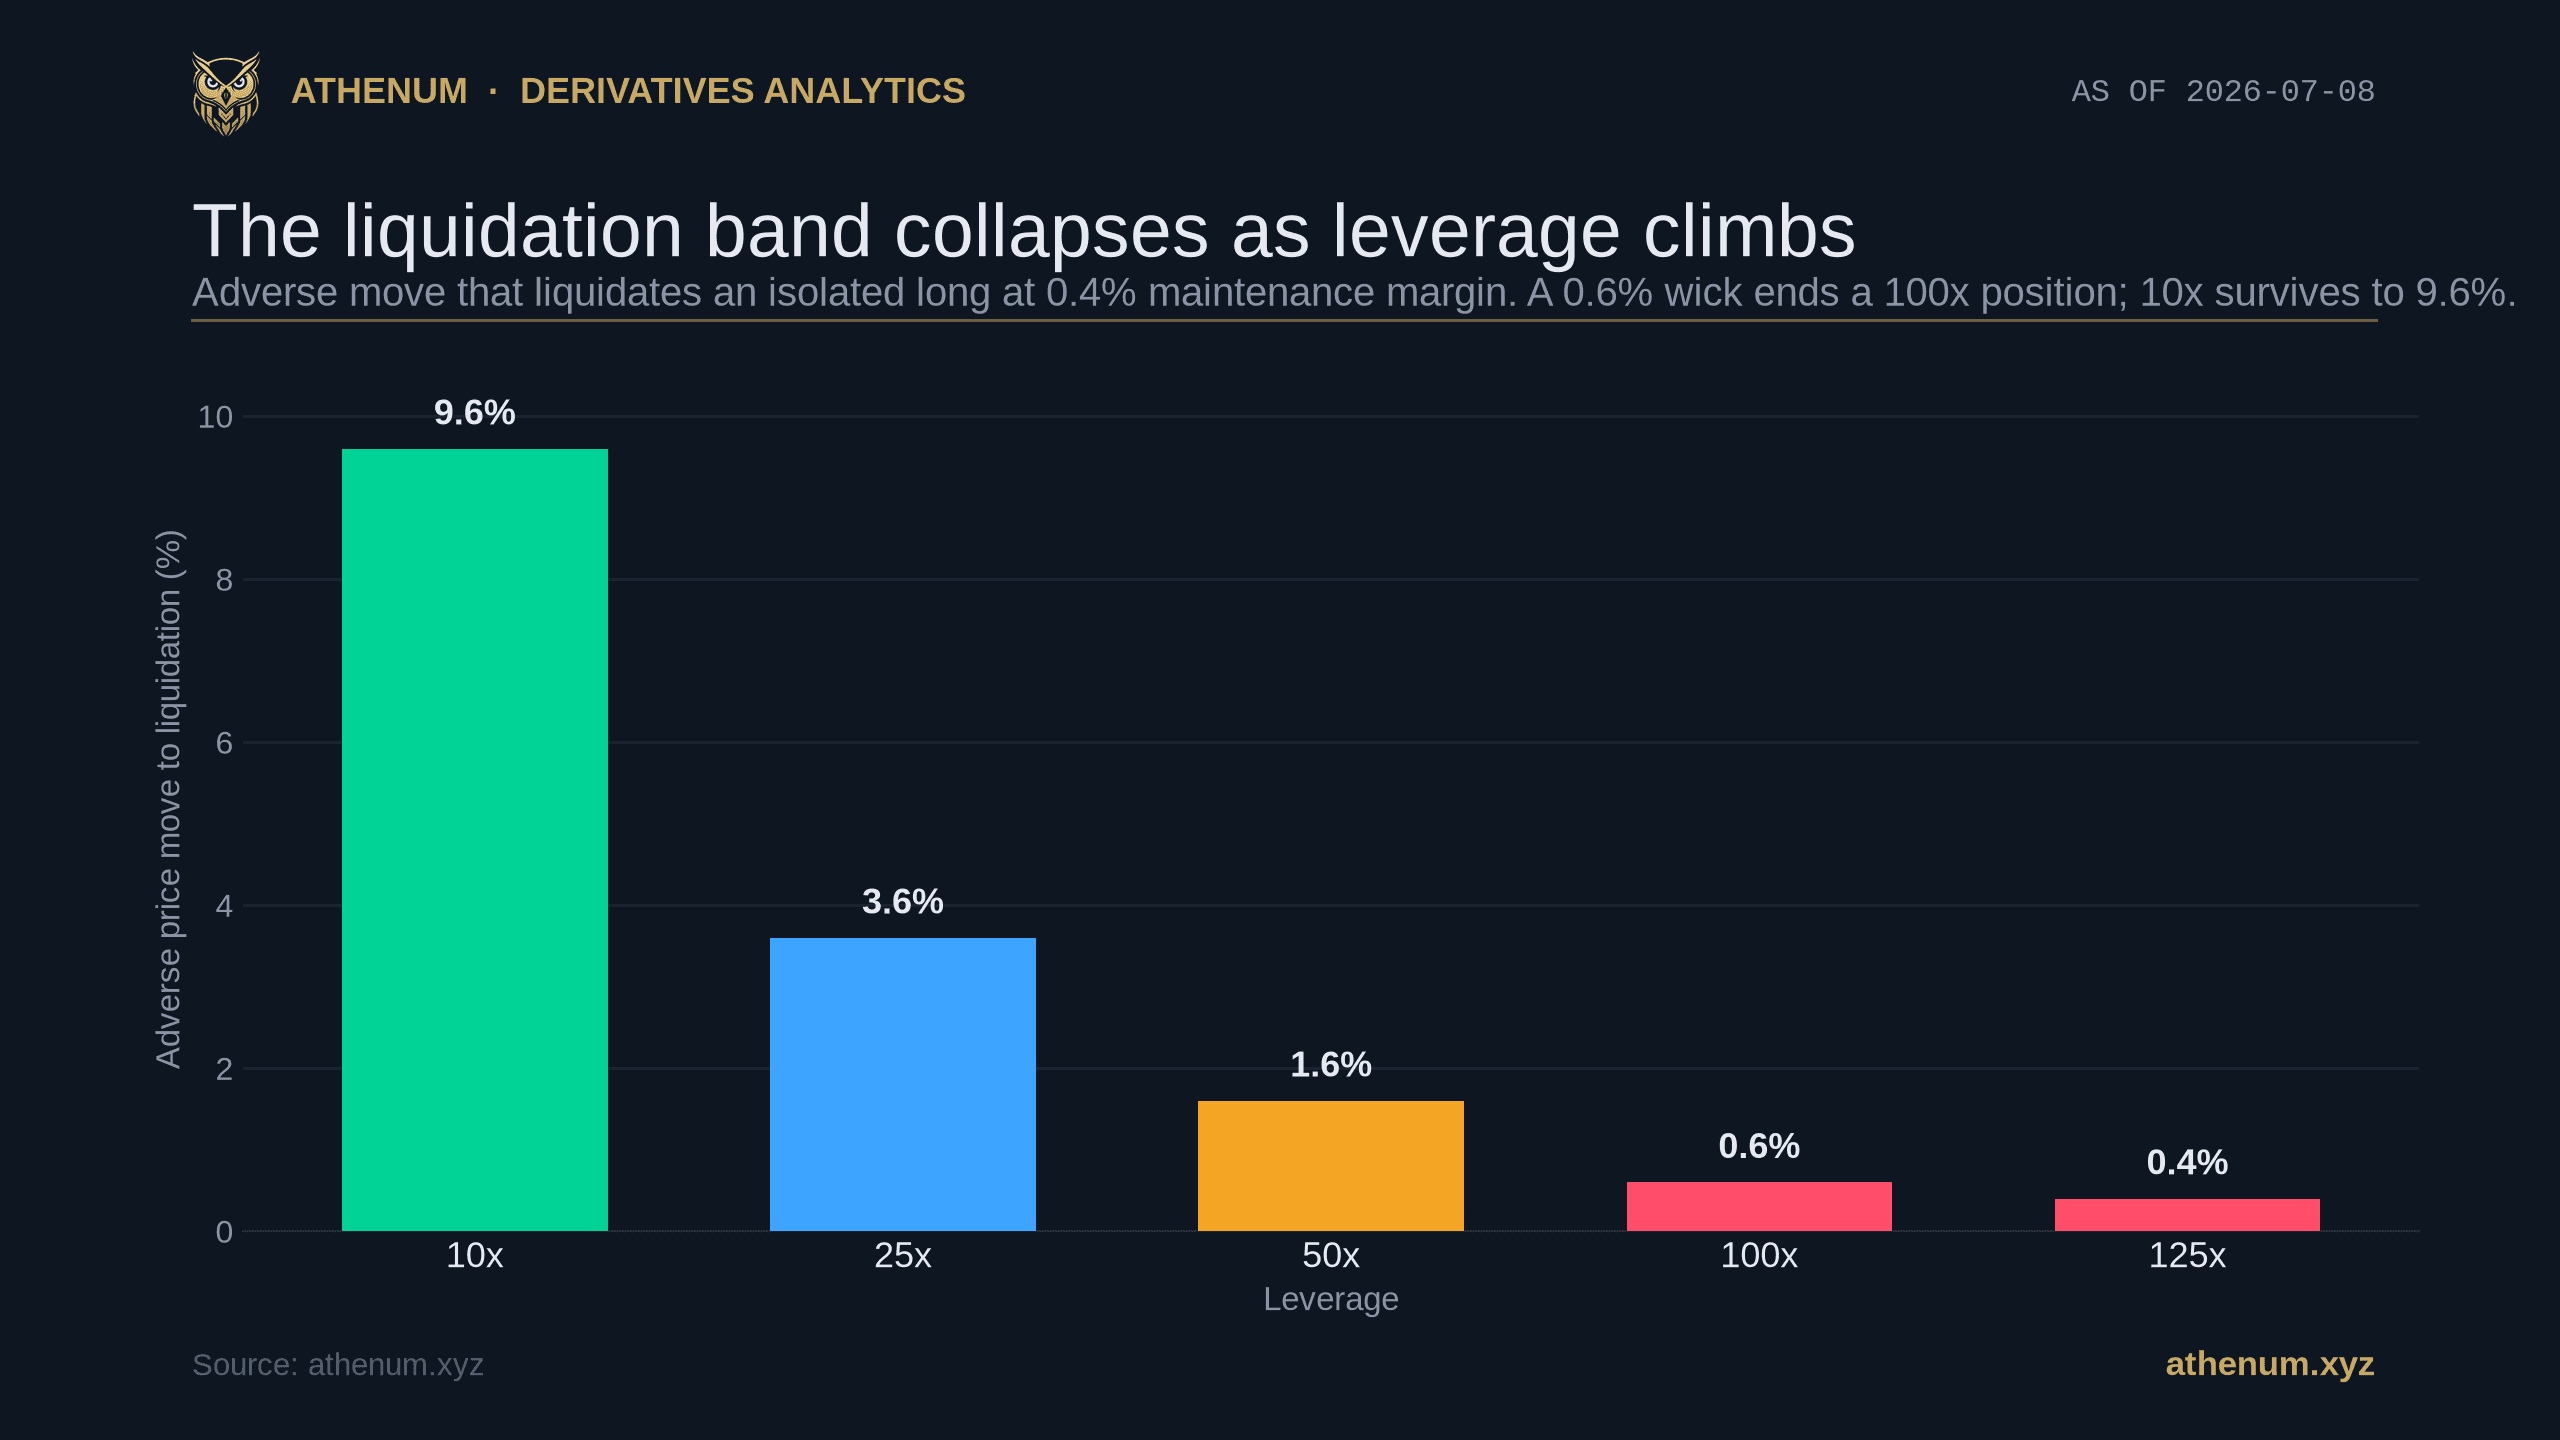
Leverage does not change your profit and loss per dollar of price movement; a 1% move on a $10,000 position is $100 whether you posted $1,000 or $100 of margin. What leverage changes is how much margin you tie up, how close your liquidation sits, and how heavily fees and funding weigh on that margin. Those three levers are the entire 10x versus 100x decision, and they all move against you as leverage rises. The table below holds the position size fixed and shows what each leverage setting does at a 0.4% maintenance margin, the tier-1 rate Athenum's calculator uses.
Leverage | Margin (% of notional) | Adverse move to liquidation | Round-trip fee (% of margin) |
|---|---|---|---|
10x | 10% | 9.6% | 1.0% |
25x | 4% | 3.6% | 2.5% |
50x | 2% | 1.6% | 5.0% |
100x | 1% | 0.6% | 10.0% |
125x | 0.8% | 0.4% | 12.5% |
Read the table as one story: every step up in leverage shrinks the buffer between your entry and your liquidation while it enlarges the fee bite on the margin you posted. 125x is Binance's maximum on BTC (Bybit caps Bitcoin perpetuals at 100x), and the 0.4% figure there assumes the 0.4% maintenance margin of the smallest tier. Real venues raise the maintenance margin as your position grows, so a large 100x position is liquidated even sooner than 0.6%.
How close is your liquidation price at 10x versus 100x?
For an isolated long, the liquidation price is approximately the entry price times (1 minus 1/leverage plus the maintenance margin rate), so the adverse move to liquidation is roughly (1/leverage minus the maintenance margin). That is a first-order estimate: it ignores the taker fee you pay to close and any funding you have already paid, both of which drain equity and pull the real liquidation slightly closer. Take a single $10,000 long on Bitcoin at a $63,000 entry and change only the leverage:
- At 10x you post $1,000 of margin, and liquidation sits at $56,952, a 9.6% drop worth $6,048 of price. - At 100x you post $100 of margin, and liquidation sits at $62,622, a 0.6% drop worth just $378 of price.
Same trade, same $10,000 of exposure, but the 100x version dies if Bitcoin ticks down by the width of a normal one-minute candle. You can reproduce both numbers in the free Athenum leverage calculator: set the entry to 63000, the position to 10000, the direction to long, and toggle the leverage from 10x to 100x to watch the liquidation price and the distance-to-liquidation update live. The dedicated liquidation price calculator does the same for a target you enter yourself, and the mechanics of what happens when that price is hit are covered in how liquidation cascades happen.

The free Athenum leverage calculator: a $10,000 BTC long at $63,000 liquidates at $62,622 (0.60% away) at 100x on just $100 of margin, versus $56,952 (9.6% away) at 10x, using a 0.4% maintenance margin.
Why does 100x leverage cost so much more in fees and funding?
Fees and funding are charged on your notional position size, not on the margin you posted, so raising leverage keeps the cost the same in dollars while shrinking the margin it eats into. A round trip at a 0.05% taker fee, the standard rate on Binance and OKX in 2026, costs 0.10% of notional. On a $10,000 position that is $10 whether you use 10x or 100x. But $10 is 1% of a $1,000 margin at 10x, and a full 10% of a $100 margin at 100x. Funding works the same way: perpetual positions on Bitcoin exchange funding every 8 hours, at 00:00, 08:00 and 16:00 UTC, calculated on notional, so at 100x a single funding payment can cost several percent of your margin before the price has moved at all.

One round trip at a 0.05% taker fee is 0.10% of notional but 10% of your margin at 100x versus 1% at 10x; funding on notional scales the same way.
This is why high-leverage scalping is so hard to keep profitable: at 100x you start each trade already 10% of margin in the hole on fees, and every 8-hour funding cycle adds more. You can model the exact drag on your own numbers with the profit and loss calculator before you ever place the order.
Does higher leverage actually make you more money?
No. Higher leverage raises the size of your position relative to your margin, but it does not improve your edge, and it sharply raises the chance that ordinary volatility liquidates you before your idea has time to work. The distance-to-liquidation is the number that matters, and at high leverage it falls below the market's normal daily noise. Bitcoin's implied volatility sat at 40.3 on 2026-07-08, which corresponds to a routine one-day move of roughly 2%. That single fact settles the argument:
- A 0.6% move liquidates a 100x position, and Bitcoin covers that distance in minutes on a quiet day. - A routine 2% daily move, a one-standard-deviation day, wipes out both 50x and 100x outright. - It takes a 3.6% day, which arrives several times a month, to reach a 25x liquidation, and a rare 9.6% move to threaten 10x.

Bitcoin implied volatility (DVOL) at 40.3 on 2026-07-08 implies a typical daily move near 2%, more than triple the 0.6% that liquidates a 100x long.
So the trader on 100x is not making a bigger bet on direction; they are making a bet that the market will not move normally, and it always does. The risk and reward ratio of the trade decides whether an edge exists at all, and the Kelly criterion decides how much of your account to stake once it does. Neither one gets better because you moved a slider from 10x to 100x.
So what leverage should you actually use?
There is no single correct number, but the framework is simple: choose the leverage that keeps your liquidation outside the range the market moves in normally, then size the position so a stop-out costs a fixed small fraction of your account. In practice that pushes most directional Bitcoin trades toward the low end, roughly 3x to 10x, where a normal 2% day cannot end the trade and a genuine 9.6% move is required. Work backward from your invalidation level rather than forward from the maximum the exchange offers:
1. Decide the price at which your idea is wrong, and measure the percentage distance from your entry. 2. Pick a leverage whose liquidation sits comfortably beyond that level, so your own stop, not the exchange, closes the trade. 3. Size the position so that hitting the stop costs a set 1% to 2% of your account, using isolated margin so one bad trade cannot reach the rest of your balance.
Isolated and cross margin change this calculation, since cross margin backs the position with your whole wallet and pushes liquidation much further away at the cost of risking everything; the margin calculator guide walks through both. The wider discipline of sizing, stops, and survival is the subject of the complete risk management guide.
The bottom line
10x versus 100x is not a choice about ambition, it is a choice about how much room you leave the market to breathe. 100x hands the exchange a 0.6% trigger, pays 10% of your margin in round-trip fees, and gets liquidated by a single normal day, while 10x survives a 9.6% move for a tenth of the fee drag. Pick the leverage from your invalidation level, keep it low enough that routine volatility cannot end the trade, and size by risk rather than by the maximum on offer. Athenum aggregates live derivatives data across 14 exchanges and gives away 34 free calculators, with no account, no email, and no usage limits. Run your own entry and leverage in the free Athenum leverage calculator, then start a free 7-day Pro+ trial of the full Athenum terminal, no card required.
One terminal. All the data.
Liquidations, orderbook depth, whale walls & open interest from 4 exchanges, all real-time, in one place.
No credit card required

Athenum Analytics
Athenum Analytics is our three-person editorial team covering crypto derivatives, market data and macroeconomic context.