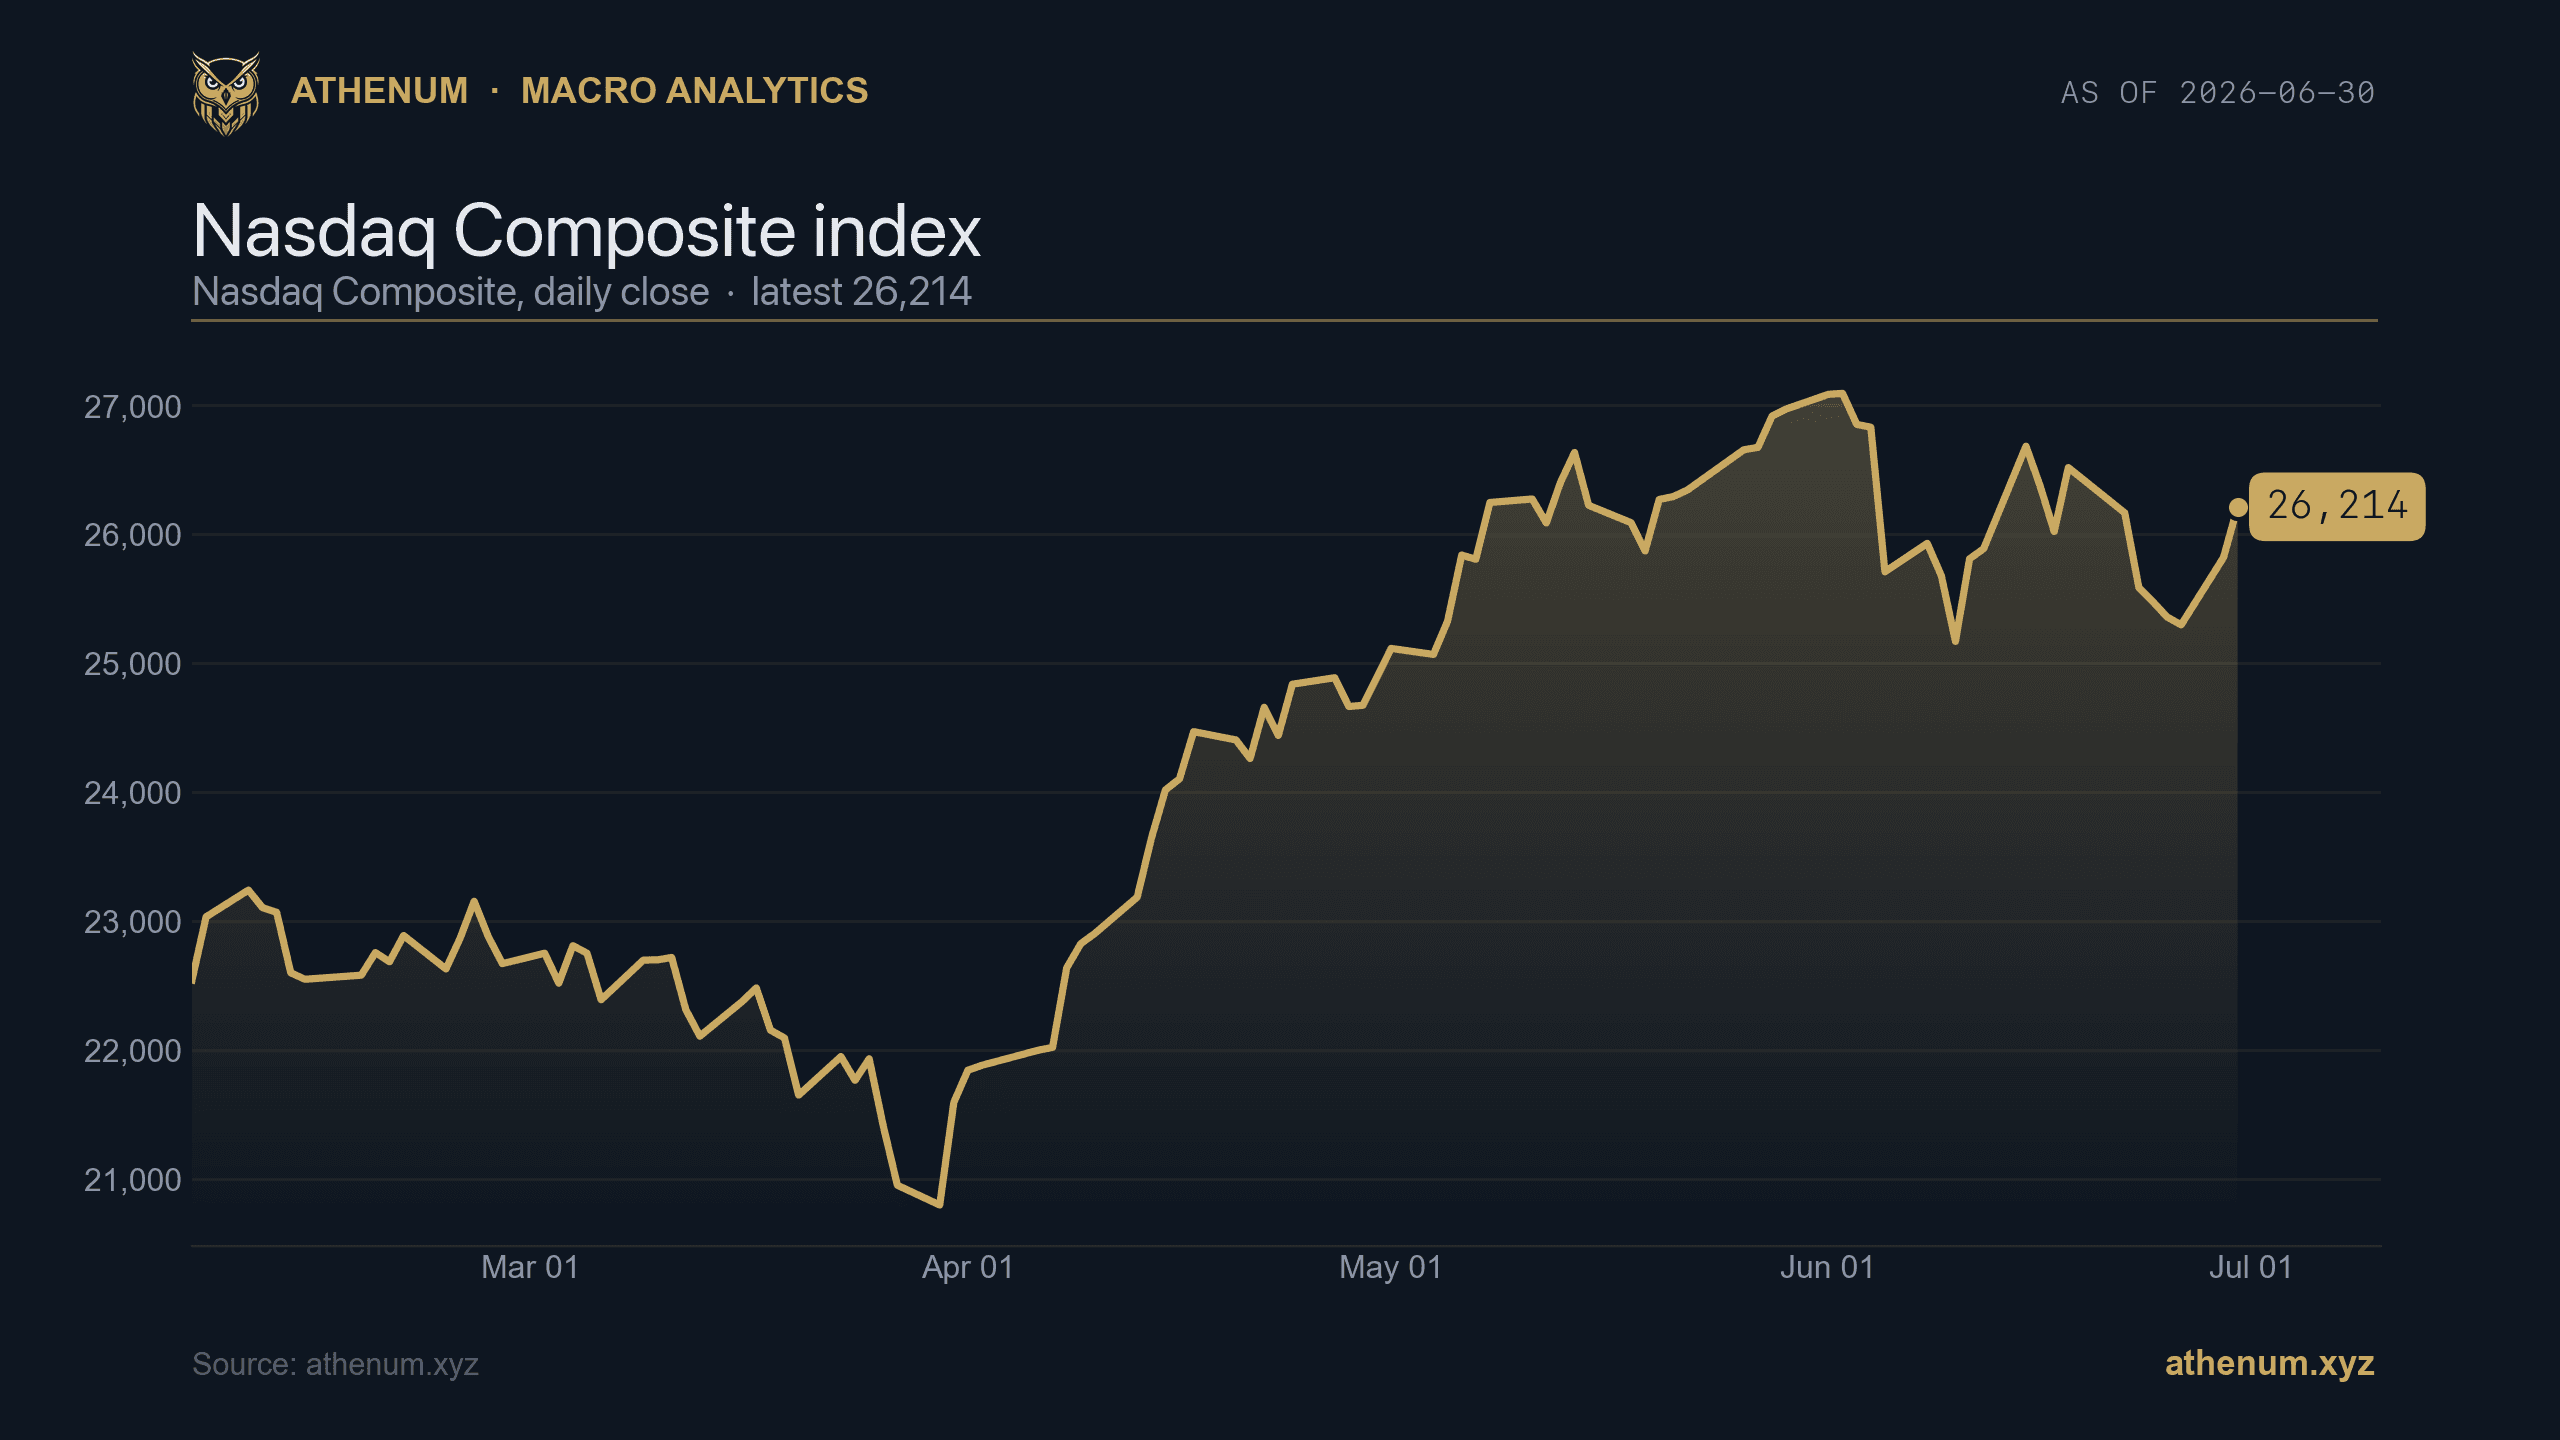
Nasdaq Composite index at 26,214 as of 2026-06-30, Athenum macro series chart showing the April 2026 dip

Bitcoin Nasdaq Correlation: How Closely Crypto Tracks Tech Stocks in 2026

Athenum Analytics
Athenum Analytics
6 min read

TLDR: The Bitcoin Nasdaq correlation is now structurally high: the rolling reading spiked to a record near 0.96 in April 2026, meaning roughly 92% of Bitcoin's price variance could be explained by equities. As of 2026-07-01 the tape is calm, with the Nasdaq Composite at 26,214, the VIX near 17, and Bitcoin around $59,260. But Bitcoin still swings far harder than stocks: its own volatility index (DVOL) reads 43.4 against a VIX near 17, and futures open interest of $17.0B with a long/short account ratio of 1.87 shows the crowd leaning long. This post explains what the correlation is, why it moves, and how to read it with first-party data.

Bitcoin was pitched for years as an uncorrelated asset. That story broke. Since spot ETFs pulled institutional money into the same risk buckets as tech stocks, Bitcoin and the Nasdaq now rise and fall together far more often than not, and the link tightens exactly when it hurts most: during sell-offs.

Is Bitcoin still correlated to the Nasdaq in 2026?

Yes, and the correlation is now structurally high rather than occasional. Independent market data showed the Bitcoin to equities correlation hitting a record 0.96 in April 2026, up from a long-run average closer to 0.4. Earlier in the year the relationship whipsawed violently, swinging from -0.68 to +0.72 in about two weeks in February 2026. A reading of 0.96 implies that roughly 92% of Bitcoin's price movement lined up with what stocks were doing, which is not diversification, it is a high-beta extension of the same market.

The transmission mechanism is flows. Spot Bitcoin ETFs took in more than $2.4 billion in April 2026 alone, and that capital answers to the same macro forces as equities: rate expectations, inflation prints, and global risk sentiment. When a risk-on day lifts the Nasdaq, the same appetite bids Bitcoin, and when risk comes off, both get sold together.

What does the Bitcoin Nasdaq correlation look like right now?

Calm. As of 2026-07-01 the equity backdrop is risk-on and quiet: the Nasdaq Composite is at 26,214 and the VIX, the equity market's fear gauge, sits near 17, a level that signals low expected stock volatility. Bitcoin trades around $59,260 in that same regime.

VIX equity volatility index at 17.65 as of 2026-06-29, Athenum macro series chart

VIX at 17.65 (2026-06-29), down from a spike above 31 in early April 2026. That April stress is when the Bitcoin to Nasdaq correlation peaked near 0.96.

Here is the current cross-asset read from Athenum data:

Metric

Reading

As of

Nasdaq Composite

26,214

2026-06-30

VIX (equity vol)

17.65

2026-06-29

Bitcoin spot

$59,260

2026-07-01

Bitcoin DVOL (crypto vol)

43.4

2026-07-01

BTC futures open interest

$17.0B

2026-07-01

BTC long/short account ratio

1.87

2026-07-01

The pattern to watch is asymmetry. Research through 2026 shows the correlation is not symmetric: Bitcoin tends to follow Nasdaq sell-offs closely but sometimes ignores equity rallies. In practice that means the diversification you hoped for disappears in a crash and only partly shows up in a rally.

How much more does Bitcoin move than the Nasdaq?

A lot more. Correlation measures direction, not size, and on size Bitcoin is in a different league. Bitcoin's own forward-looking volatility index (DVOL) reads 43.4 as of 2026-07-01, while the VIX is near 17. That gap, roughly 2.5 times, is why Bitcoin is best understood as a high-beta risk asset: it points the same way as the Nasdaq but takes larger steps in both directions.

Bitcoin DVOL implied volatility index at 43.4 as of 2026-07-01, Athenum chart

Bitcoin DVOL at 43.4 (2026-07-01), about 2.5 times the VIX near 17. Same direction as stocks, much larger swings.

So a 1% move in the Nasdaq on a correlated day rarely means a 1% move in Bitcoin. It often means several times that, which is exactly why position sizing matters more for crypto than for a tech-stock portfolio. If you size trades with leverage, model the downside first: our crypto leverage calculator shows liquidation price and margin for a given size before you commit, and the funding rate calculator shows the carry cost of holding that leverage.

What is crypto positioning doing while stocks are calm?

Leaning long, with real money committed. Bitcoin futures open interest stands at $17.0B as of 2026-07-01, and the long/short account ratio is 1.87, meaning close to two long accounts for every short. A crowded long into a calm, correlated tape is the setup that turns an equity wobble into an outsized crypto flush, because leveraged longs get liquidated far faster than a diversified stock book.

Bitcoin futures open interest at $17.0B as of 2026-07-01, Athenum metric chart

BTC futures open interest at $17.0B (2026-07-01). Elevated open interest plus a long/short ratio of 1.87 means a crowded long into a correlated market.

Bitcoin long short account ratio at 1.87 as of 2026-07-01, Athenum metric chart

BTC long/short account ratio at 1.87 (2026-07-01): close to two long accounts for every short, a crowded long into a calm equity tape.

This is the practical takeaway of a high Bitcoin Nasdaq correlation: crypto risk and equity risk are no longer separate bets. When the Nasdaq is quiet and crypto positioning is crowded and levered, a single risk-off catalyst can hit both at once, and the leveraged side moves first. For the pure macro side of this, the dollar, the VIX and real yields, see our companion piece on macro drivers and crypto, and for the positioning side see the long/short ratio and open interest.

How to track the Bitcoin Nasdaq correlation yourself

You need three things on one screen: an equity risk gauge, Bitcoin's own volatility, and crypto positioning. Athenum aggregates crypto derivatives data across 14 exchanges (funding, open interest, liquidations, CVD, options max pain and ETF flows) alongside macro series like the Nasdaq, the VIX and the dollar, so you can read the risk regime and the crypto leverage in the same place.

1. Watch the equity regime: a rising VIX from a low base is the classic tell that the correlation is about to tighten and drag Bitcoin. 2. Compare Bitcoin's DVOL to the VIX to gauge how much extra risk you are taking versus a stock index. 3. Track open interest and the long/short ratio: a crowded, levered long into a correlated market is the fragile setup.

Try it free: start a 7 day Pro+ trial with no card and put the Nasdaq, the VIX and live Bitcoin derivatives on one screen.

The bottom line

Bitcoin in 2026 is not a hedge against stocks, it is a leveraged expression of the same risk appetite that drives the Nasdaq. The correlation reached a record near 0.96 this year, it is asymmetric and worst in sell-offs, and Bitcoin's volatility runs roughly 2.5 times the VIX. Right now the tape is calm, with the Nasdaq at 26,214, the VIX near 17 and Bitcoin around $59,260, but a crowded long, with $17.0B of open interest and a 1.87 long/short ratio, means the crypto side is positioned to move hardest when the correlation tightens. Read the two markets as one, and size accordingly.

Juggling CoinGlass, Hyblock & TradingLite tabs
Paying $100+/mo across fragmented tools
Stale data you can’t trust for entries

One terminal. All the data.

Liquidations, orderbook depth, whale walls & open interest from 4 exchanges, all real-time, in one place.

100+ pairs tracked live
Try It Free

No credit card required

Athenum Analytics
Author

Athenum Analytics

Wisdom Over Chaos