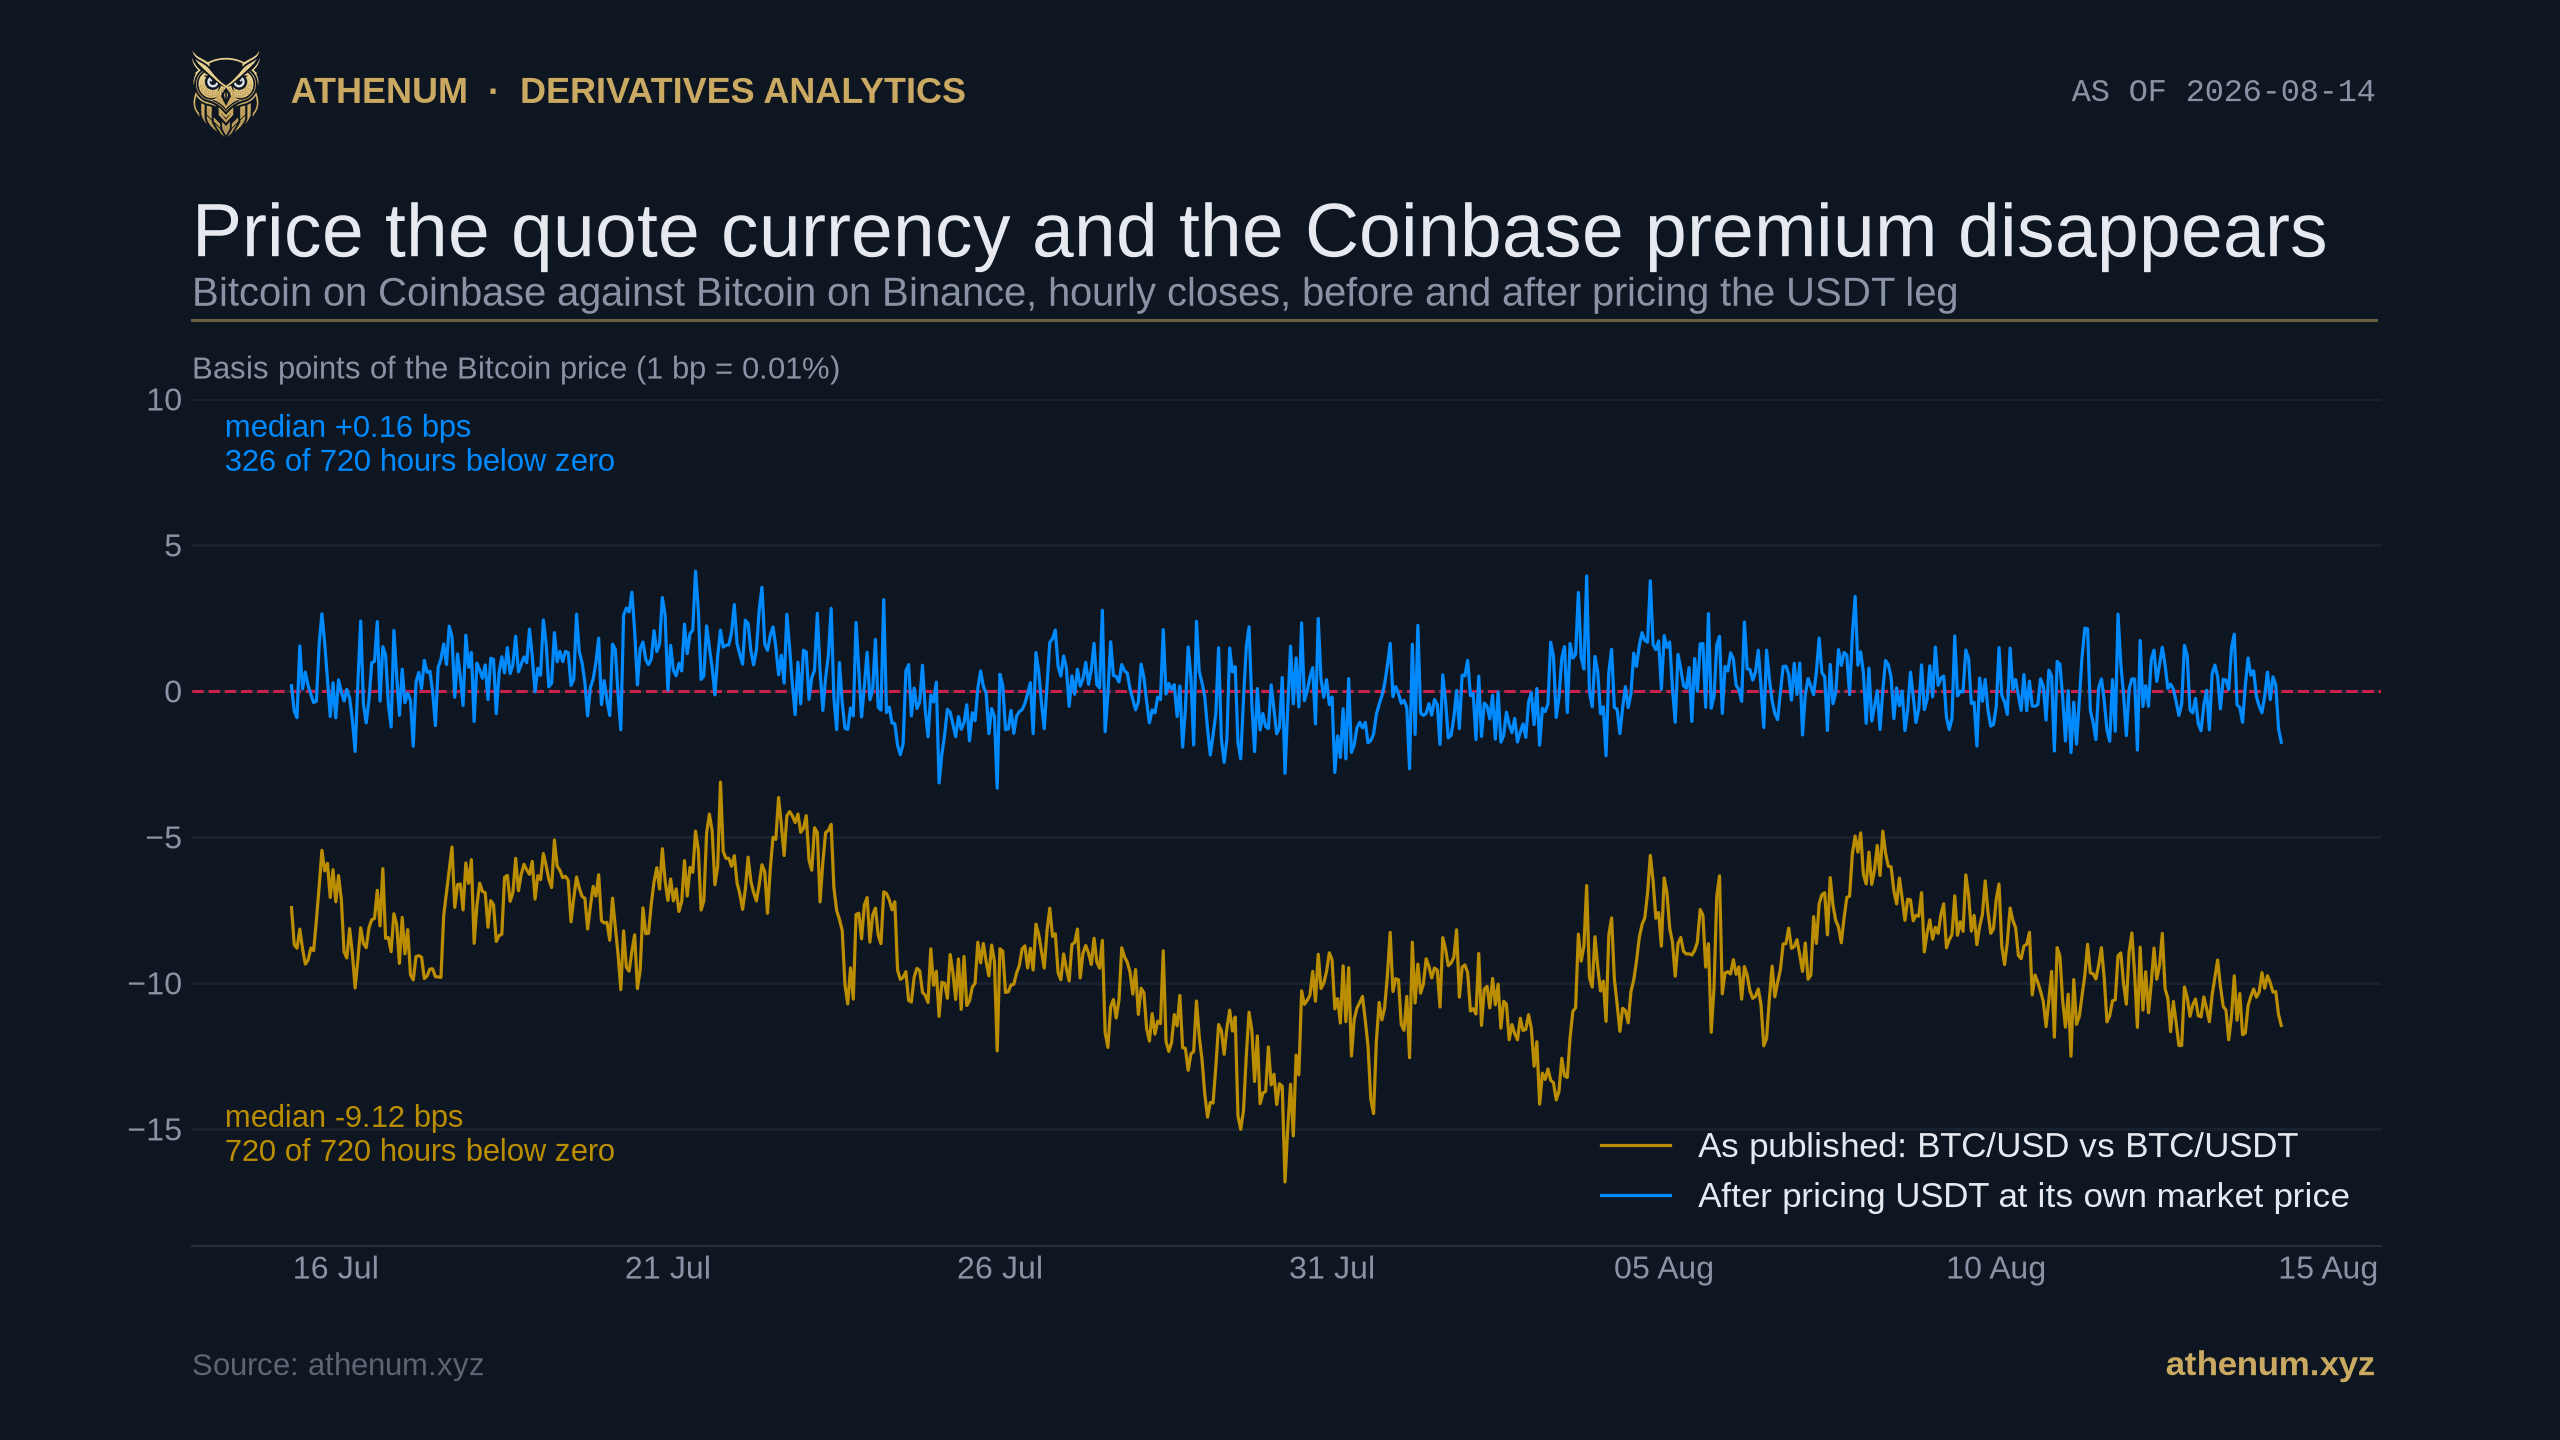
TLDR. The Coinbase premium compares Bitcoin priced in US dollars on Coinbase with Bitcoin priced in USDT on Binance, and traders read it as US demand. Over the 720 hourly closes from 2026-07-15 08:00 UTC to 2026-08-14 07:00 UTC it was negative in every single hour, with a median of minus 9.12 basis points, which is 57.31 US dollars at the 62,848.68 dollar close that ended the window. Over the same 720 hours USDT never closed an hour at or above a dollar on either venue we measured: median 0.99908 on Coinbase and 0.99903 on Kraken. The two legs are quoted in different currencies, and one of those currencies was about 9 basis points cheap. Price it, and the premium's median moves to plus 0.16 basis points, 394 of the 720 hours change sign, and what is left is no wider than the gap between two ordinary dollar venues. The number most people read as American selling pressure was, for this window, mostly the price of Tether.
What is the Coinbase premium, and what did it do over the last 720 hours?
It is the percentage gap between Bitcoin on Coinbase, which quotes against the US dollar, and Bitcoin on Binance, which quotes against USDT. A positive reading is usually read as US buyers paying up, a negative one as US sellers leaning on the price. Our own explainer on the Coinbase premium index sets out the standard construction and the standard reading, and the longer piece on it as an institutional signal covers how desks use it, with one caveat: that piece says our engine normalizes the stablecoin effect away, and the measurement below is why we are correcting it.
The confound we are about to measure is not a new idea and we did not find it. NYDIG's research desk has made the argument twice in print, in October 2025 and again in February 2026, writing that a correct construction "requires adjusting BTC-USDT prices into USD terms using the market price of USDT-USD" and that the unadjusted number "becomes a proxy for the USDT-USD exchange rate". Our own earlier write-ups flagged it more weakly, in words rather than numbers: the June explainer notes that a deviation in the USDT peg can move the spread without telling you anything about Bitcoin demand, and our June 30 read of a negative premium says the index "can also move on stablecoin basis shifts". What we add here is the hourly panel, the controls, and the size of what is left over.
We pulled the hourly closes each venue publishes on its own public endpoint, kept the hours both venues share, and dropped the newest bar of every series because it is still filling. That leaves 720 completed hours ending 2026-08-14 07:00 UTC. The gap was negative in all 720 of them. The median was minus 9.12 basis points, the middle half ran from minus 10.54 to minus 7.50, and the full range from minus 16.82 to minus 3.12.
One clarification before that unanimity gets oversold. A run of 720 negatives out of 720 sounds like an iron law, and it is nothing of the sort: the mean sits 9.09 basis points below zero with a standard deviation of 2.18, so zero is more than four standard deviations away and a distribution shifted that far would be expected to stay on one side. The interesting number is not the count. It is the 9 basis point shift itself, and where it comes from.
Was USDT actually trading below a dollar?
In every hour of the window, on two venues that have no reason to agree with each other. On Coinbase the median USDT/USD close was 0.99908, on Kraken 0.99903, which is minus 9.2 and minus 9.7 basis points against a dollar of par. Neither venue printed a single hourly close at or above 1.0000. The two prices track each other closely: the median difference between them was 0.2 basis points, with a middle half of minus 0.3 to plus 0.9. Two more dollar-quoted venues agreed at the moment we checked them, 2026-08-14 09:18 UTC: Bitstamp at 0.99893 and Gemini at 0.99888.

USDT against the US dollar, hourly, on two independent venues. The dashed line at 1.0000 is par, which is what the issuer redeems at before its fees, and neither venue closed an hour there. The gap between the two venues stays inside a basis point for most of the window, which is what makes the level credible rather than a quirk of one order book.
This is not a thin quote taken from a corner of the market. Over the 24 hourly bars ending 2026-08-14 07:00 UTC, the USDT/USD book turned over 141.1 million USDT on Kraken and 28.2 million on Coinbase. The comparison that makes that concrete is inside one venue: over the same bars Kraken's USDT/USD book did 2.03 times the notional of Kraken's own BTC/USD book, which traded 1,098.78 BTC at a volume-weighted 63,368.82 dollars, about 69.6 million dollars. USDT's total turnover across all markets is far larger than any of this, but almost all of it is USDT acting as the quote currency, and a market quoted in USDT cannot price USDT.
What happens to the premium once you price the quote currency?
In this window, it disappears. The arithmetic is simple enough to check on a napkin: Bitcoin priced in dollars should equal Bitcoin priced in USDT multiplied by the price of USDT in dollars. Do that hour by hour and the median gap moves from minus 9.12 basis points to plus 0.16, which at the closing price is plus 1.01 dollars instead of minus 57.31. The middle half of the adjusted series runs from minus 0.63 to plus 1.00 basis points, and 326 of the 720 hours, or 45.3%, remain below zero, which is what a series centred on nothing looks like.

Day by day, with the spread inside each day drawn rather than hidden. The gold and rust lines are two different measurements, one taken from the Bitcoin market and one from the stablecoin market, and they move together: the widest day was 2026-07-29 at minus 12.57 basis points against a USDT discount of minus 12.55 that day. The blue band shows how little is left afterwards.
Hour by hour the two series correlate at plus 0.833, an r-squared of 0.694, so pricing the quote currency removes 69.4% of the variance in the published number. In level terms the match is closer still: the median USDT discount of minus 9.2 basis points is 100.9% of the median published gap of minus 9.12. Every day in the window tells the same story: all 31 daily medians of the published gap are negative, while 14 of 31 daily medians of the adjusted series are, which is a coin toss.

Each dot is one hour. The dashed line is not a fit, it is the identity: the place where the published gap would be exactly the USDT discount and nothing else. The cloud sits on that line rather than beside it. The vertical scatter around it has a standard deviation of about 1.2 basis points, and that scatter, not the level, is the part of the premium that is actually about Bitcoin.
Which USDT price you use matters a little, and we would rather show that than pick the flattering one. Adjusting with Kraken's USDT quote, the deeper of the two books, instead of Coinbase's puts the median at plus 0.43 basis points rather than plus 0.16. Both answers are within half a basis point of zero, and the 0.27 basis point difference between them is about thirty times smaller than the effect being measured.
Could this be a Coinbase story rather than a currency story?
That is the obvious objection, and the data answers it directly: hold the quote currency fixed and the gap vanishes, whichever venues you compare. Over the same 720 hours, Bitcoin in dollars on Kraken sat a median of plus 0.05 basis points from Bitcoin in dollars on Coinbase, Bitstamp minus 0.01 from Coinbase, and Kraken plus 0.03 from Bitstamp. The median absolute gap across those three dollar pairings is 0.74 basis points, against 9.12 for the dollar-against-USDT comparison.
Comparison, same 720 hours | Quote currencies | Median gap (bps) | Middle half (bps) |
|---|---|---|---|
Coinbase BTC/USD vs Binance BTC/USDT, as published | USD against USDT | -9.12 | -10.54 to -7.50 |
The same pair, with USDT priced | USD against USD | +0.16 | -0.63 to +1.00 |
Kraken BTC/USD vs Coinbase BTC/USD | USD against USD | +0.05 | -0.76 to +0.91 |
Bitstamp BTC/USD vs Coinbase BTC/USD | USD against USD | -0.01 | -0.65 to +0.65 |
Kraken BTC/USD vs Bitstamp BTC/USD | USD against USD | +0.03 | -0.63 to +0.83 |
Only the first row mixes two currencies, and it is the only row that is not centred on zero.

Five ways of comparing the same Bitcoin across venues, drawn on one axis. Three of the five distributions are centred within a tenth of a basis point of zero and a fourth within two tenths. The one that is not is the only comparison in the set where the two sides are quoted in different currencies, and pricing that currency moves it into the same cloud as the others.
There is a second reading in that picture worth keeping. The adjusted series has a standard deviation of 1.21 basis points; Kraken against Bitstamp, two dollar venues with no currency question between them, has 1.23. Whatever US demand signal survives in this window is not larger than the ordinary disagreement between two spot exchanges.
What does one exchange with two order books show?
The test that removes the most alternative explanations needs no second exchange at all. Binance runs a BTC/USDT book and a BTC/USDC book side by side, same venue, same asset, same matching engine, same fee schedule, same users, different quote currency. Across the same 720 hours the BTC/USDC price sat a median 7.58 basis points below the BTC/USDT price.
Now predict that number using nothing from the Bitcoin market: take the price of USDT and the price of USDC in each hour and ask what the gap should be. Over the window USDC traded at a median of minus 2.0 basis points against the dollar on Kraken and USDT at minus 9.2 on Coinbase, and running the two prices hour by hour predicts a median gap of minus 7.40 basis points. The observed median was minus 7.58. Taking the difference within each hour, the median is minus 0.02 basis points with a middle half of minus 0.85 to plus 0.91; hour by hour the two series track at an r-squared of 0.54, so about half the hour-to-hour movement is still unexplained.

One exchange, one asset, two order books. The observed price difference between the USDC book and the USDT book is drawn against what the two stablecoin prices alone predict it should be, and the second line is not fitted to the first. The median of the hour-by-hour differences between them is 0.02 basis points, about 13 cents on a 62,849 dollar Bitcoin, while the two medians themselves are 0.18 basis points apart.
A flow story has a hard time with that one. The buyers on both Binance books face the same venue, the same fees and the same rails, so the standing difference between the two prices is the unit each book is quoted in, and the stablecoin market prices that unit directly. What the r-squared says is that the level is explained and the hour-to-hour wobble largely is not.
Why does Tether trade below a dollar at all?
Because the discount is smaller than the fee you would pay to close it, and the issuer publishes both numbers. Tether's terms of service, in the paragraph headed "Issuances and Redemptions", set the price at par and then qualify it: "the redemption price payable by Tether for one Tether Token will be one unit of the Fiat currency to which it is pegged", "less fees, where applicable", available only to a "verified customer of Tether" and "subject to minimum redemption amounts". The fee schedule publishes the figures: a 100,000 US dollar minimum on any acquisition or redemption, 0.1% to acquire, and to redeem "the greater of 1,000 dollars or 0.1%", plus a 150 dollar verification fee.
Put those numbers next to the measurement and the mechanism stops being vague. 0.1% is 10 basis points, and the median discount we measured is 9.2. So the trade that would drag USDT back to a dollar, buy it cheap and redeem it at par, does not clear its own fee even for a fully onboarded counterparty redeeming millions. Below 1,000,000 dollars it is worse, because the 1,000 dollar floor binds: at the 100,000 dollar minimum the effective fee is a full 100 basis points. The peg is not a line, it is a band roughly 10 basis points wide on the redemption side, and for these 720 hours the price sat just inside the cheap edge of it.
One clause in the same terms deserves a mention in a post about a metric people read as US demand: Tether's terms make any "U.S. Person (except for Eligible Contract Participants agreed by Tether, in its sole discretion)" a Prohibited Person, barred from holding the token at all. The one group whose buying the index is supposed to measure is the group formally excluded from the redemption channel that sets the token's floor.
What matters for reading the premium is that the discount is small, persistent and measurable, not why it exists. This post makes no claim about Tether's reserves or its solvency, and nothing here is a stress signal: a few basis points is what the peg looks like in quiet conditions. Our note on stablecoin exchange flows covers the quantity side of the same asset, which is a separate question from its price.
What should you actually do with the premium now?
Three rules, in order of how much they change the reading.
1. Compare like quote currency, or price the difference. Coinbase against Kraken or Bitstamp needs no adjustment. Coinbase against Binance, Bybit, OKX or Bitget does, because those are USDT books.
2. Treat anything inside roughly ten basis points as unresolved. In this window the entire published signal was smaller than the quote-currency term sitting inside it.
3. Expect the sign to flip. It did in 394 of 720 hours, always from negative to positive, which is the difference between reading "US sellers" and reading "nothing to see".
The same discipline applies to the derivatives side, where the unit is stated but the rate is not comparable across venues without care. Reading Athenum's live cross-venue feed for the completed 2026-08-14 08:00 UTC hour, funding on the Bitcoin perpetual ran from minus 0.01293% on Bybit to plus 0.01000% on Bitget per eight hours, with Deribit at plus 0.00031%, Binance at plus 0.00500% and OKX at plus 0.00848% among them. That is a spread of 0.02293 percentage points between the cheapest and the dearest place to be long, the third widest of the last 169 hours against a median of 0.0085 and a middle half of 0.0069 to 0.0099, both computed with Hyperliquid converted to the common eight-hour basis first, for the reason the next sentence gives. Hyperliquid is in that feed too and is the unit trap in miniature: it settles funding every hour, not every eight, and its reading for the same hour is plus 0.00125%. Multiply by eight to put it on the same basis as the rest and it is plus 0.01000%, which does not leave it third cheapest on the list, it ties it with Bitget for the dearest. We re-checked the extremes at the venues themselves: Bybit's own ticker put its next funding rate at minus 0.01083% at 2026-08-14 09:00 UTC, Bitget's at plus 0.01000%, and Hyperliquid's own endpoint returned 0.0000125 per hour, so both the sign split and the unit gap are facts about the venues rather than artifacts of one feed. You can turn any of those into a holding cost with the Athenum funding rate calculator, and our measurement of how often each venue prints a negative rate shows how venue-specific that sign is.
It is worth being concrete about the size of the spot effect too. At the 2026-08-14 07:00 UTC close of 62,848.68 dollars, 9.12 basis points is 57.31 dollars per Bitcoin. On a 100,000 dollar position it is 91.18 dollars of apparent edge that is really a currency conversion, well inside a retail spot taker fee, and unlike a taker fee it never appears on the ticket. You can put it next to the fees you actually pay in the Athenum PnL calculator. At 2026-08-14 08:47 UTC, a single instant read from each venue's ticker rather than from candles, the published gap was minus 11.67 basis points, USDT was at 0.99895 on Coinbase and 0.99893 on Kraken, and the adjusted gap was minus 1.17. Kraken's dollar price sat 0.10 basis points from Coinbase's at the same moment.
What are the limits of this measurement?
Five, and the first two are the ones that would change the number.
The window is one month and one asset. Thirty days of Bitcoin is a regime, not a law, and the adjustment does not always leave nothing behind: NYDIG measured a quote-adjusted premium of nearly 5% in October 2025, an episode in which the signal was real and survived the correction. If USDT trades at a dollar next month, the correction goes to zero and the published premium becomes readable as it stands.
The adjustment depends on which USDT price you use. Coinbase and Kraken differ by a median 0.2 basis points, which moves the adjusted median between plus 0.16 and plus 0.43. There is no single official USDT price, only quotes.
Fees and transfer frictions are not modelled. After adjustment the residual is 0.16 basis points, well inside what withdrawal costs, taker fees and settlement timing can produce on their own, so we make no claim about what that residue means.
Some community indicators publish a volume-weighted version across a wider venue set than the two-venue construction we tested, though the providers who publish the index itself hardcode the two venues. A wider basket changes the number but not the term we are describing, because every USDT-quoted venue in it carries the same quote-currency offset.
This is a measurement, not a forecast. A negative premium that is really a stablecoin discount says nothing about the next move in Bitcoin, and neither does the adjusted series.
One more, and it is against us. The Coinbase premium reading published on our own site is the same raw gap the rest of the industry publishes, so everything above applies to our number as much as anyone else's, and we are fixing our end of it rather than only writing about it. Yesterday's post on the perpetual discount ran into the neighbouring version of the same problem from the other side: exchange index baskets mix USD-quoted and USDT-quoted legs, so a venue that converts one to the other embeds a tether price in the index that decides your liquidation.
Every price above came off an endpoint you can call yourself, and the cross-venue funding beside it came off Athenum and its live normalized feed. Sitting next to that feed are 34 calculators that stay free: they ask for no account, they collect no email address, and they put no limit on how often you use them. If you would rather see every venue's rate on one screen than reconstruct it, the terminal opens on a free 7 day Pro+ trial without a card.
One terminal. All the data.
Liquidations, orderbook depth, whale walls & open interest from 4 exchanges, all real-time, in one place.
No credit card required
