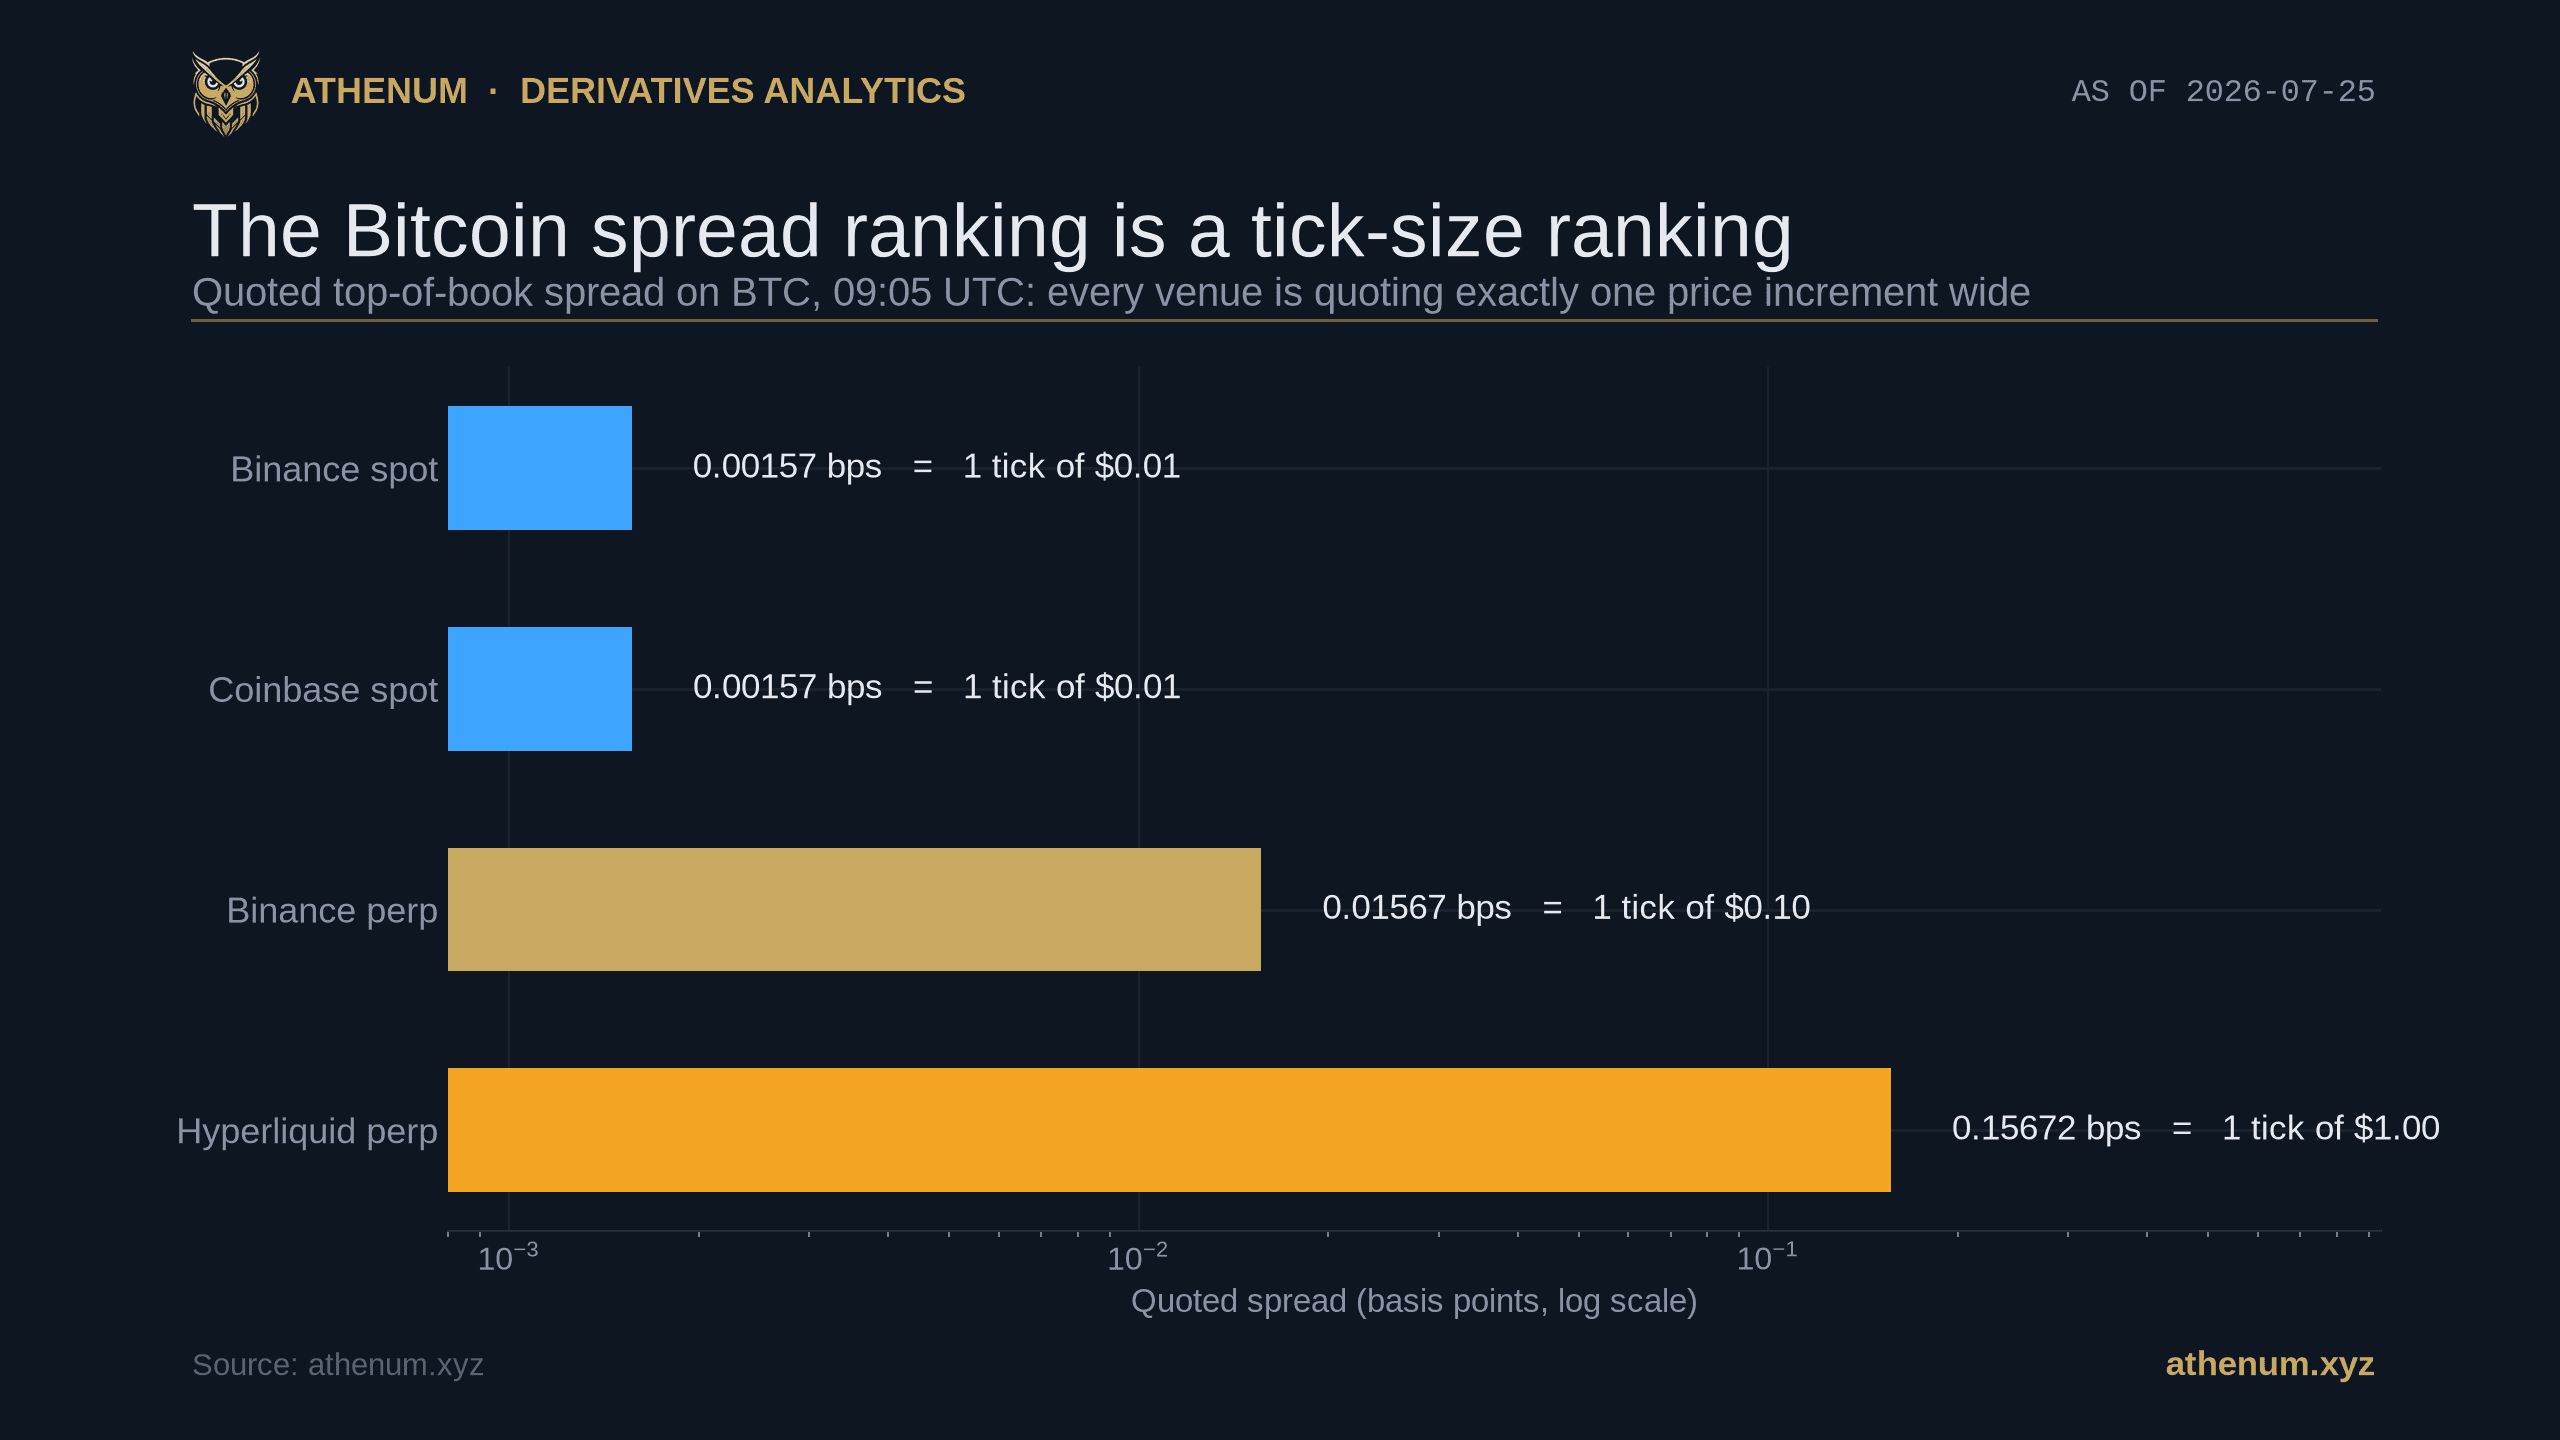
TLDR: The quoted crypto bid-ask spread on a deep venue is usually not a liquidity reading at all. It sits at exactly one tick, the smallest price increment the exchange allows, so ranking venues by quoted spread mostly ranks their tick sizes. In a cross-venue snapshot at 09:05 UTC on 2026-07-25, 12 of the 12 Bitcoin, Ether and Solana books sampled were quoting exactly one tick wide, and the Bitcoin spread spanned a 100x range from 0.00157 bps to 0.15672 bps only because the increment ranged from $0.01 to $1.00. Read size at the touch, the fee, and the currency each venue quotes in instead.
What is the crypto bid-ask spread, and what does it measure?
The crypto bid-ask spread is the gap between the best bid, the highest price a resting buyer will pay, and the best ask, the lowest price a resting seller will accept. It is quoted either in currency or, so venues and assets can be compared, in basis points: the spread in dollars divided by the mid price, multiplied by 10,000. At 09:05 UTC on 2026-07-25 the Bitcoin book on Binance perp showed a best bid of $63,812.40 and a best ask of $63,812.50, a $0.10 gap on a $63,812.45 mid, which is 0.01567 bps.
The textbook reading is that the spread is what a market maker charges for standing between buyers and sellers, so a narrower spread means more makers competing and a more liquid market. That reasoning is sound, but it only works while the spread is free to move. On the most heavily traded crypto pairs it is not free to move, because it has already hit a floor the exchange sets rather than the market.
Why is the same Bitcoin spread 100 times wider on one venue than another?
Because the price increment is 100 times larger, and nothing else has to change. The snapshot at 09:05 UTC on 2026-07-25 put Binance spot and Coinbase spot at 0.00157 bps, Binance perp at 0.01567 bps and Hyperliquid perp at 0.15672 bps. That is a 100x range on the same asset in the same minute. Line the quotes up against the increment each venue publishes and the range collapses into a single fact: every one of them was quoting the minimum.
Venue (BTC) | Quoted spread | Spread in dollars | Price increment | Spread in ticks |
|---|---|---|---|---|
Binance spot | 0.00157 bps | $0.01 | $0.01 | 1 tick |
Coinbase spot | 0.00157 bps | $0.01 | $0.01 | 1 tick |
Binance perp | 0.01567 bps | $0.10 | $0.10 | 1 tick |
Hyperliquid perp | 0.15672 bps | $1.00 | $1.00 | 1 tick |

Priced in each venue's own increment, the 100x range at 09:05 UTC on 2026-07-25 collapses: all four Bitcoin books were quoting exactly 1 tick.
What is a tick size, and when does it pin the spread?
A tick size is the minimum price increment an exchange lets an order use. A book quoted in $0.10 steps cannot show a spread of anything smaller, so once makers have competed the quote down to a single step the spread physically stops moving. Microstructure research calls a book in that state tick-constrained, and an instrument that lives there a large-tick asset. The important consequence is statistical: the reading is not wrong, it is censored from below. It can still tell you the spread is no wider than a tick, but it can no longer tell you how much tighter the competition would have driven it. That is also why one observation proves nothing on its own; what matters is the fraction of time a book sits on its floor.
Two of the four venues here quote Bitcoin in $0.01 steps and one in $0.10 steps. Hyperliquid perp publishes a rule rather than a fixed number: prices carry at most five significant figures, with whole numbers always permitted, so its increment moves with the price decade. Near $63,808 that works out to $1.00. Below $10,000 the increment would tighten to $0.10, but it does not loosen above $100,000, because whole numbers stay legal however many significant figures they carry. The rule scales downward only, and $1.00 is the floor. None of that is a statement about how much size is available. It is a quoting convention, and venues revise these increments periodically, so read them from the venue's own published specification on the day you compare.

The ranking is not stable across assets: at 09:05 UTC on 2026-07-25 Hyperliquid perp quoted the widest Bitcoin spread at 0.15672 bps and the tightest Solana spread at 0.13563 bps.
The cleanest way to see that the ranking is an artifact is to change the asset and watch the order reverse. At 09:05 UTC on 2026-07-25 Hyperliquid perp quoted Bitcoin about 10 times wider than Binance perp did, at 0.15672 bps against 0.01567 bps. In the same snapshot it quoted Solana about 10 times tighter, 0.13563 bps against 1.35621 bps. No liquidity moved between those two lines. Only the price decade changed, and with it the size of one tick.
In this particular snapshot every book was sitting on its floor, which is the cleanest possible version of the point and also the reason to state the limit of it plainly. A single moment is not a property of a market. The deepest books sit on their floor almost all of the time, and thinner ones lift off it often enough that the honest instruction is to measure the fraction of time a venue is pinned rather than to read one quote and generalize.
Does a tighter crypto bid-ask spread mean a deeper market?
No, and the same snapshot shows why. Binance spot and Coinbase spot were quoting Bitcoin at the identical 0.00157 bps, because both use the same $0.01 increment. Behind that identical quote, Binance spot held $588,446 across the best bid and best ask while Coinbase spot held $44,969, a 13x difference at 09:05 UTC on 2026-07-25. Two venues, one spread, two very different markets.

At 09:05 UTC on 2026-07-25 Binance spot held $558,164 at the bid and $30,282 at the ask, $588,446 together, against $38,637 and $6,332 at Coinbase spot, $44,969 together: a 13x gap behind an identical 0.00157 bps quote.
Size at the touch is a snapshot and it moves second to second, so read it as a sample rather than a constant. The point is not the exact figure, it is that the spread and the depth behind it are separate measurements and can disagree by more than an order of magnitude. Depth also depends on how wide a band you measure, which is the trap covered in order book imbalance and liquidity walls, and on which price you are measuring from, which is why mark price, index price and last price are worth separating before you compare venues at all.
What does crossing the crypto bid-ask spread actually cost?
Far less than the fee sitting next to it. On a $10,000 Bitcoin order at 09:05 UTC on 2026-07-25, crossing the quoted spread cost between $0.0016 and $0.1567 depending on the venue. Binance publishes a 0.05% taker fee for a regular user on its USD-margined futures, which on that same order is $5.00, charged on the way in and again on the way out: roughly 32 times the widest of those spreads one way, and about 3,192 times the tightest. Every venue sets its own schedule and its own discounts, so check yours, but the shape of the comparison does not change.

Crossing the quoted spread on a $10,000 Bitcoin order cost $0.0016 to $0.1567 at 09:05 UTC on 2026-07-25, against $5.00 in taker fee at 0.05%.
A wider tick is still a real cost to a taker, and worth saying plainly: crossing on Hyperliquid perp cost 100 times what it cost on Binance spot at 09:05 UTC on 2026-07-25. It is a cost, it is simply not evidence that the venue is thinner.
Then there is the number that looks biggest of all, and it is the one most worth being careful with. At 09:05 UTC on 2026-07-25 the Bitcoin mid ranged from $63,779.84 on Coinbase spot to $63,843.54 on Binance spot, a $63.70 difference, or 9.98 bps, about 64 times the widest quoted spread on any single one of these books. Most of that is not a Bitcoin dislocation. The Coinbase book is quoted in dollars and the Binance book is quoted in Tether, and Tether trades a little under a dollar, so the bulk of the gap is the stablecoin basis rather than a move anyone can capture. Priced in the same unit the two books agree to within roughly half a basis point. That is the same lesson one layer up: check what a venue quotes in before you compare what it quotes, because the unit can move the number more than the market does. Where you trade and what you are quoted in both matter more than how tight that venue's quote looks, and the same care applies to the funding and fee drag broken down in how to calculate crypto futures PnL.
How should you compare execution cost across venues?
Turn it into a fixed sequence so a tick-size artifact can never sneak into the comparison:
1. Convert the quoted spread into ticks before comparing anything. Divide the spread in currency by the venue's published price increment. If the answer is one, that reading is sitting on its floor and is censored from below, so it can tell you the spread is not wider than a tick and nothing else. Rank on it and you are ranking increments. 2. Compare like increments only. Two books quoting $0.01 steps are comparable to each other; a $0.01 book and a $1.00 book are not, which is exactly the 100x illusion in the chart above. 3. Read size at the touch, then depth in a fixed band. Identical quotes hid a 13x depth difference at 09:05 UTC on 2026-07-25, so depth is where the real comparison lives. 4. Price the fee, because at these spread levels it is the dominant cost. Put your entry, exit and fees into the free PnL calculator and compare the total, not the quote. 5. Check the quote currency, then the cross-venue price gap. A dollar-quoted book and a Tether-quoted book will show a gap of several basis points that is the stablecoin basis, not an opportunity. Once both sides are in the same unit, the free arbitrage calculator prices whatever is left after costs. 6. Size the position against your own risk, not the venue's quote, in the free position size calculator.
Which venues does this cross-venue comparison cover?
The order book readings above come from four venues sampled in the same minute, two spot books and two perpetual books, so they are directly comparable rather than stitched together from different moments. The one thing to hold in mind is the quote currency: two of these books price Bitcoin in dollars and two in Tether. The wider derivatives picture behind them, open interest, funding and positioning, is normalized across 14 exchanges, which is what makes a cross-venue reading possible in the first place. Where that leverage actually sits is broken down in open interest by exchange, and who is paying for it is in taker versus maker flow.
Athenum normalizes live derivatives data across the 14 exchanges it covers and keeps all 34 calculators free, with no account, no email capture, and no usage limits. Compare the real cost of a trade in the free PnL calculator, then open the live Athenum terminal and watch the books side by side instead of ranking them by a number the exchange already decided.
One terminal. All the data.
Liquidations, orderbook depth, whale walls & open interest from 4 exchanges, all real-time, in one place.
No credit card required
