Table of Contents5 sections
Practise with worked lessons
- Build the full ledger for a spot–perpetual basis trade
Calculate both legs, basis change, funding and fees of a spot–perpetual basis trade. Stress a widening basis and margin needs before calling the hedge low risk.
TLDR. The crypto futures basis term structure is the futures-minus-spot gap plotted across every expiry, so it tells you what leverage costs and how much traders will pay to hold exposure over time. As of 2026-07-13, with BTC spot near $63,111, the Bitcoin futures curve is in a mild contango: annualized basis sits in the low single digits, roughly +3.8% to +4.3% across the liquid contracts. That is positive but muted, well below the double-digit annualized basis that marks euphoric leverage demand, so the curve is pricing steady, unexcited carry rather than a crowded long. The nearest one-to-three-day contracts print wild numbers on 2026-07-13, from about +8% to +37% annualized, because annualizing a few dollars of gap over a day or two is meaningless. Read the signal from the liquid quarterly and longer contracts, not the front week.
What is the futures basis, and what does the term structure tell you?
The basis is the futures price minus the spot price, usually written as an annualized percentage so contracts of different lengths are comparable. When futures trade above spot the basis is positive and the market is in contango; when they trade below spot the basis is negative and the market is in backwardation. The term structure is that whole set of readings plotted against time to expiry, so instead of one number you see the price of leverage at every horizon. Contango is the normal state for Bitcoin: a long futures position saves you the cost and custody of holding spot, so buyers pay a premium, and that premium is the annualized basis. A curve where the premium widens further out means traders will pay a lot to be long ahead, which is aggressive demand; a flat, low, or inverted curve means they will not, or are paying to be short. Reading the shape and the level, not just the front-month number, is what turns a price quote into a positioning signal.
What does the BTC basis term structure look like on 2026-07-13?
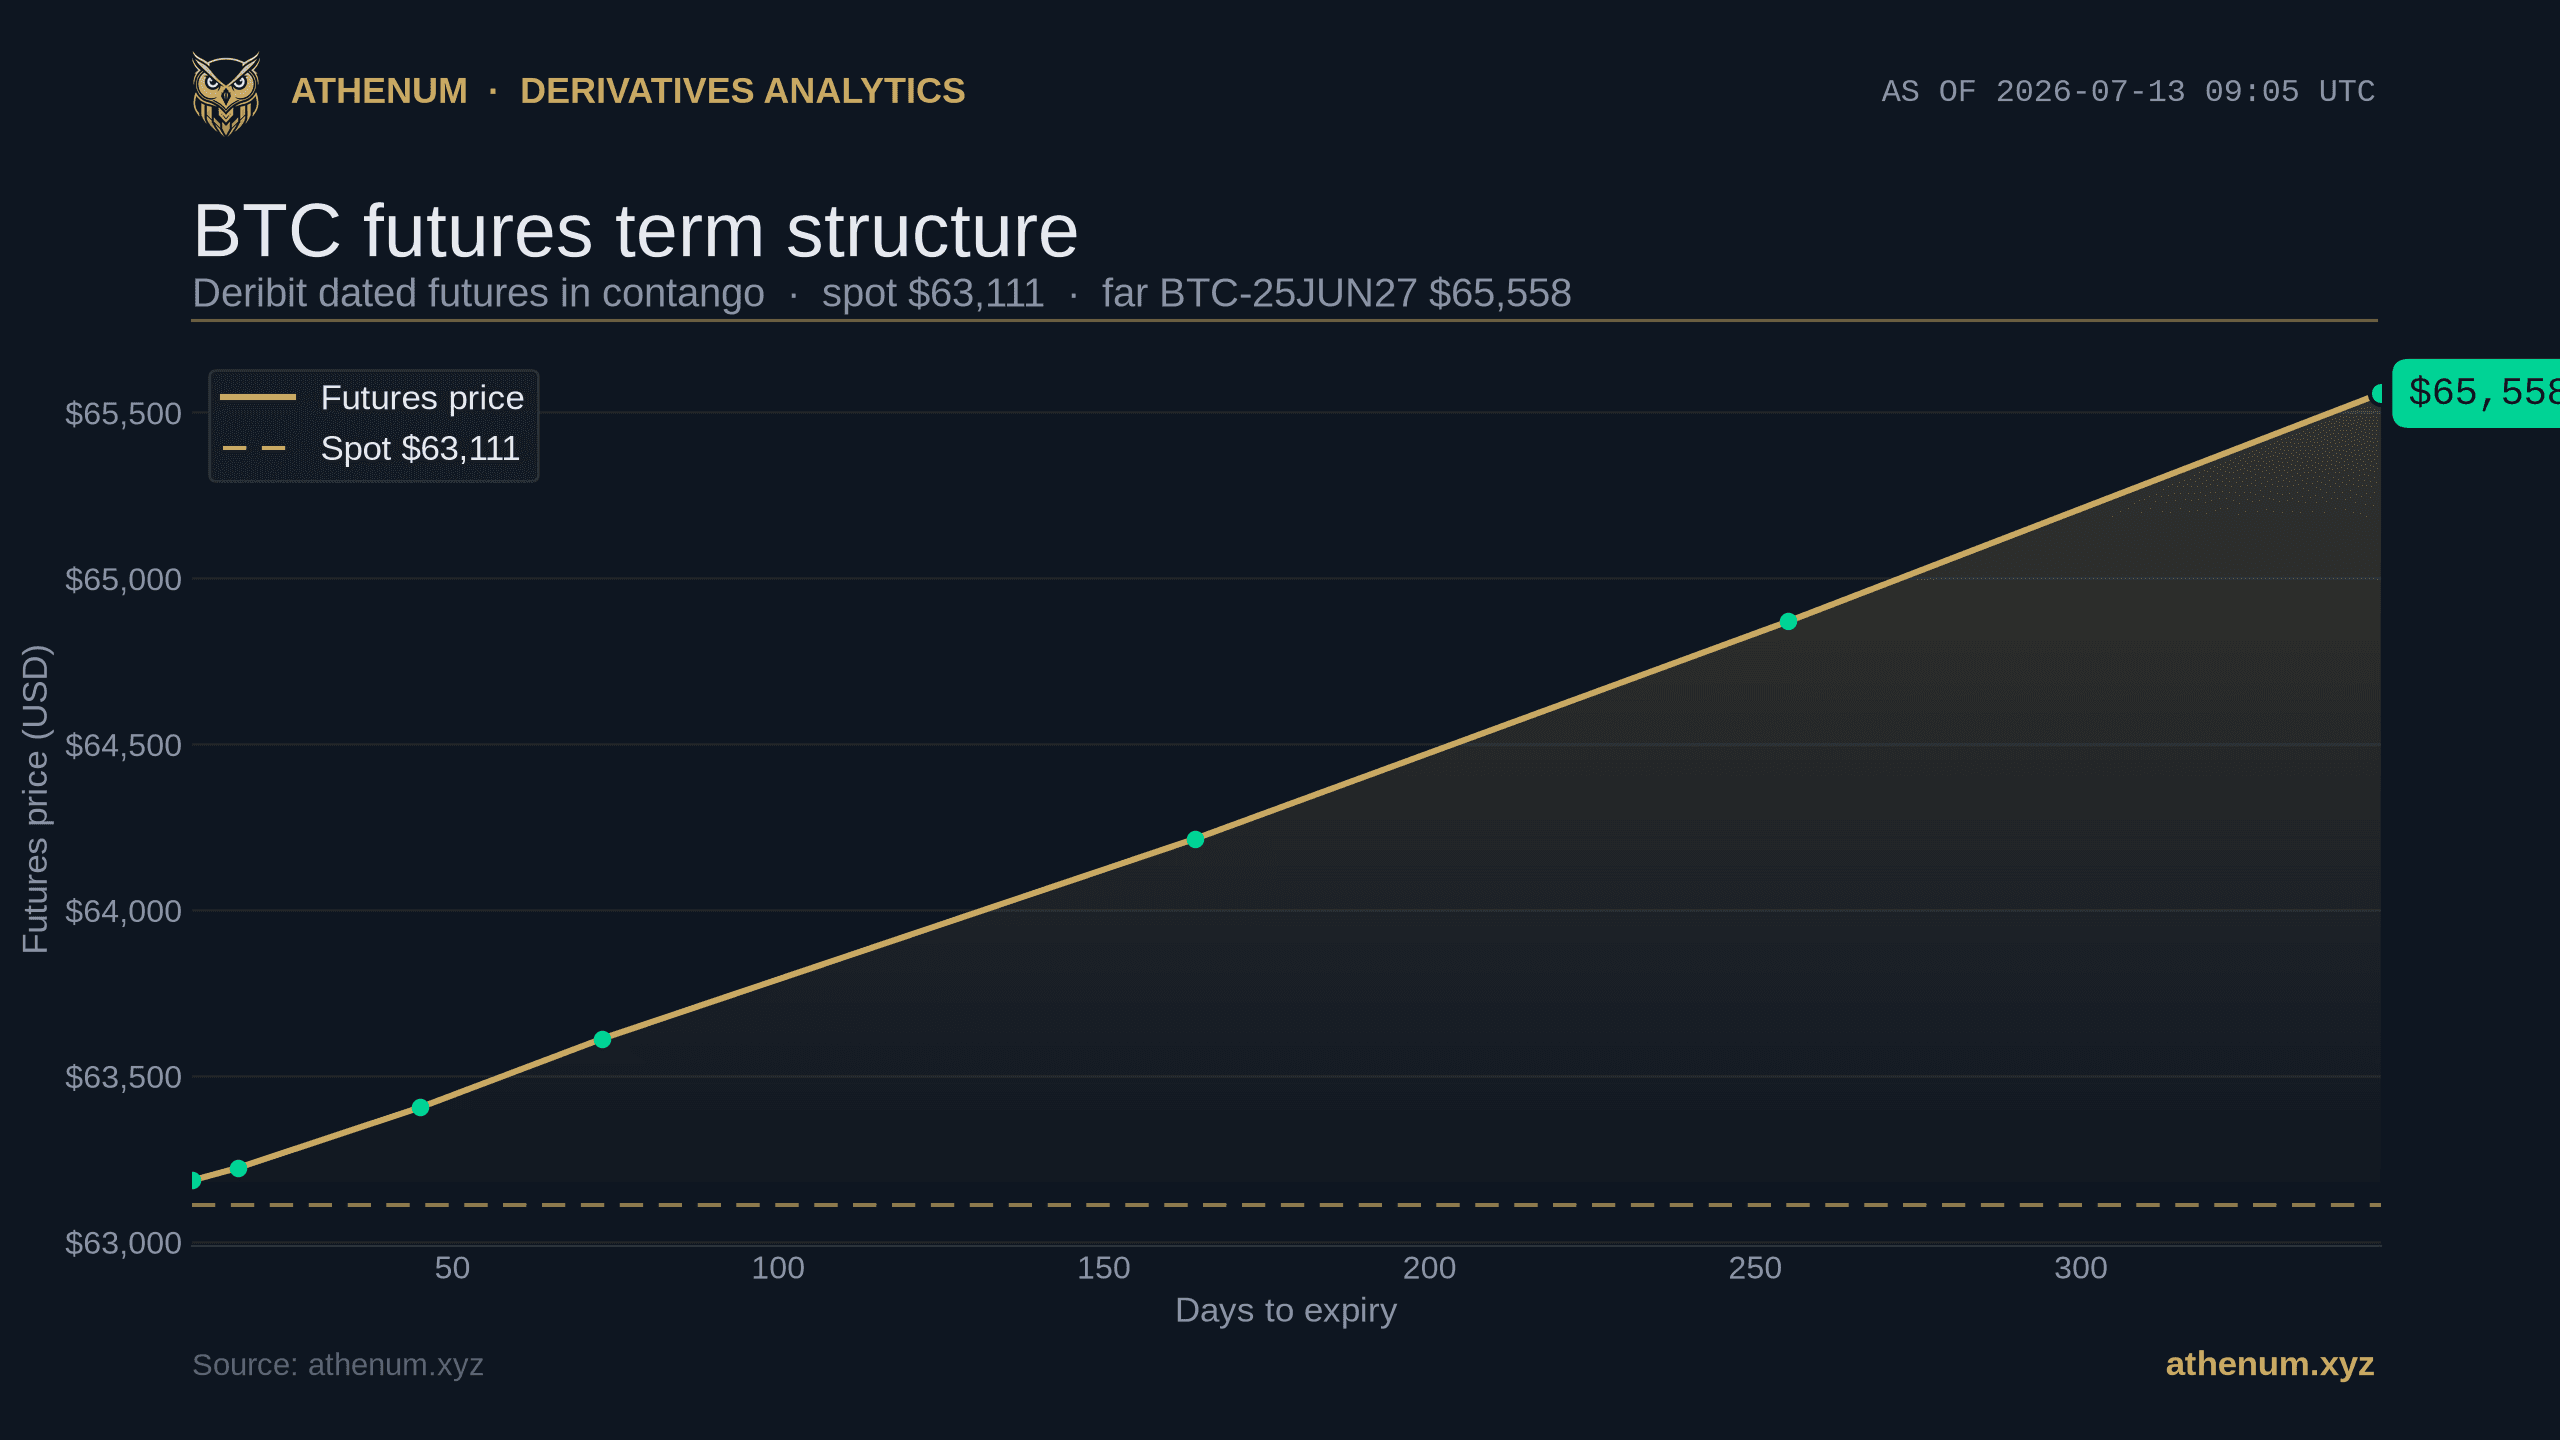
As of 2026-07-13, with spot near $63,111, the Bitcoin futures curve, read from Athenum's live cross-exchange feed, is in a clean, mild contango, and the annualized basis stays in the low single digits from the front contract out to a year.
Expiry | Days to expiry | Annualized basis (2026-07-13) |
|---|---|---|
24 Jul 2026 | 10 | +4.3% |
31 Jul 2026 | 17 | +3.8% |
28 Aug 2026 | 45 | +3.8% |
25 Sep 2026 | 73 | +4.0% |
25 Dec 2026 | 164 | +3.9% |
26 Mar 2027 | 255 | +4.0% |
25 Jun 2027 | 346 | +4.1% |

BTC annualized basis by tenor on 2026-07-13: a quiet contango clustered in the low single digits, +4.3% near-dated to about +4.1% a year out.
What matters more than the exact slope is the level. In calm-to-normal conditions Bitcoin term basis has often sat in the high single digits, and in euphoric phases it has spiked into the 20% to 40% annualized range as leveraged longs crowd in. At roughly +3.8% to +4.3% across the curve on 2026-07-13, this reading is subdued: the market is in contango, but it is a quiet contango that prices modest, orderly demand for leverage rather than an expensive, crowded long.
Why do the nearest contracts show such wild basis numbers?
Because annualizing a tiny gap over a day or two magnifies it into a meaningless percentage. On 2026-07-13 the 16 Jul 2026 contract, 2 days from expiry, sat about $127 above spot, which annualizes to about +37%, while the 15 Jul 2026 contract sat only about $24 above spot and annualized to about +14%. Those are not signals, they are arithmetic: a few dollars of tracking difference, divided by one or two days and multiplied out to a full year, swings the annualized number by tens of percent.

Near-dated BTC futures basis on 2026-07-13: gaps of a few dollars annualize to +8% to +37%, which is arithmetic, not a signal.
The practical rule is to ignore the front few days and read the term structure from the liquid dated contracts, the quarterly and longer expiries, where a real premium accrues over enough time to mean something.
Does the same contract cost the same on every exchange?
No, and the gap is a small, real edge. The same expiry can carry a different annualized basis on different venues, because each order book has its own supply of leverage and its own balance of hedgers and speculators. On 2026-07-13 the 25 Sep 2026 contract showed an annualized basis of about +3.97% on Deribit versus +3.48% on Binance, a spread of roughly 0.5 of a percentage point, and the 25 Dec 2026 contract was +3.89% on Deribit versus +3.53% on Binance, about 0.36 points apart.

Same BTC expiry, different venue, on 2026-07-13: Deribit prints a richer basis than Binance on both dated contracts.
Those spreads are what a cash-and-carry desk arbitrages: sell the richer venue, buy the cheaper, and collect the difference. For everyone else they are a reminder that a single quoted basis hides real venue-to-venue variation, which is exactly what a normalized cross-exchange feed is built to show. The full market-neutral version, long spot against a short future to harvest the premium, is the cash and carry trade.
How do you read the basis term structure yourself?
You can turn the curve into a repeatable check in four steps:
1. Drop the front week. Ignore contracts inside a few days of expiry, because their annualized basis is annualization noise, not a signal. 2. Read the level before the slope. Low-single-digit annualized basis is calm, high single digits is healthy demand, and 20% or more is the crowded-long warning that has preceded past unwinds. 3. Compare tenors. A curve that widens as it goes out means traders are paying up to be long further ahead; a flat, low, or inverting curve means that demand is soft. 4. Check the same expiry across venues. A persistent gap between two exchanges on one contract is the cash-and-carry spread, and it tells you where leverage is cheapest to fund.
The perpetual you actually trade is the front of this same curve: perpetual funding is the basis compressed into an eight-hour payment, so a rich futures curve and persistently positive funding are the same story told two ways. To turn a basis into a dollar carry, the free funding rate calculator and arbitrage calculator price the payment and the cross-venue spread, so you can size the trade before you put it on.
Every basis number above comes from Athenum's live derivatives feed across 14 exchanges, and the 34 calculators alongside it are free, with no account, no email, and no usage limits. Price the carry yourself in the free funding rate calculator, then open the live Athenum terminal to watch the curve move.
One terminal. All the data.
Liquidations, orderbook depth, whale walls & open interest from 4 exchanges, all real-time, in one place.
No credit card required

Athenum Analytics
Athenum Analytics is our three-person editorial team covering crypto derivatives, market data and macroeconomic context.