Table of Contents6 sections
- What are the three numbers that tell you how the crypto options market is positioned?
- How much movement is the options market pricing in?
- Is the options market leaning bullish or bearish?
- How do you price a single option and read its risk?
- How do you read implied volatility, put/call, and open interest together?
- The bottom line
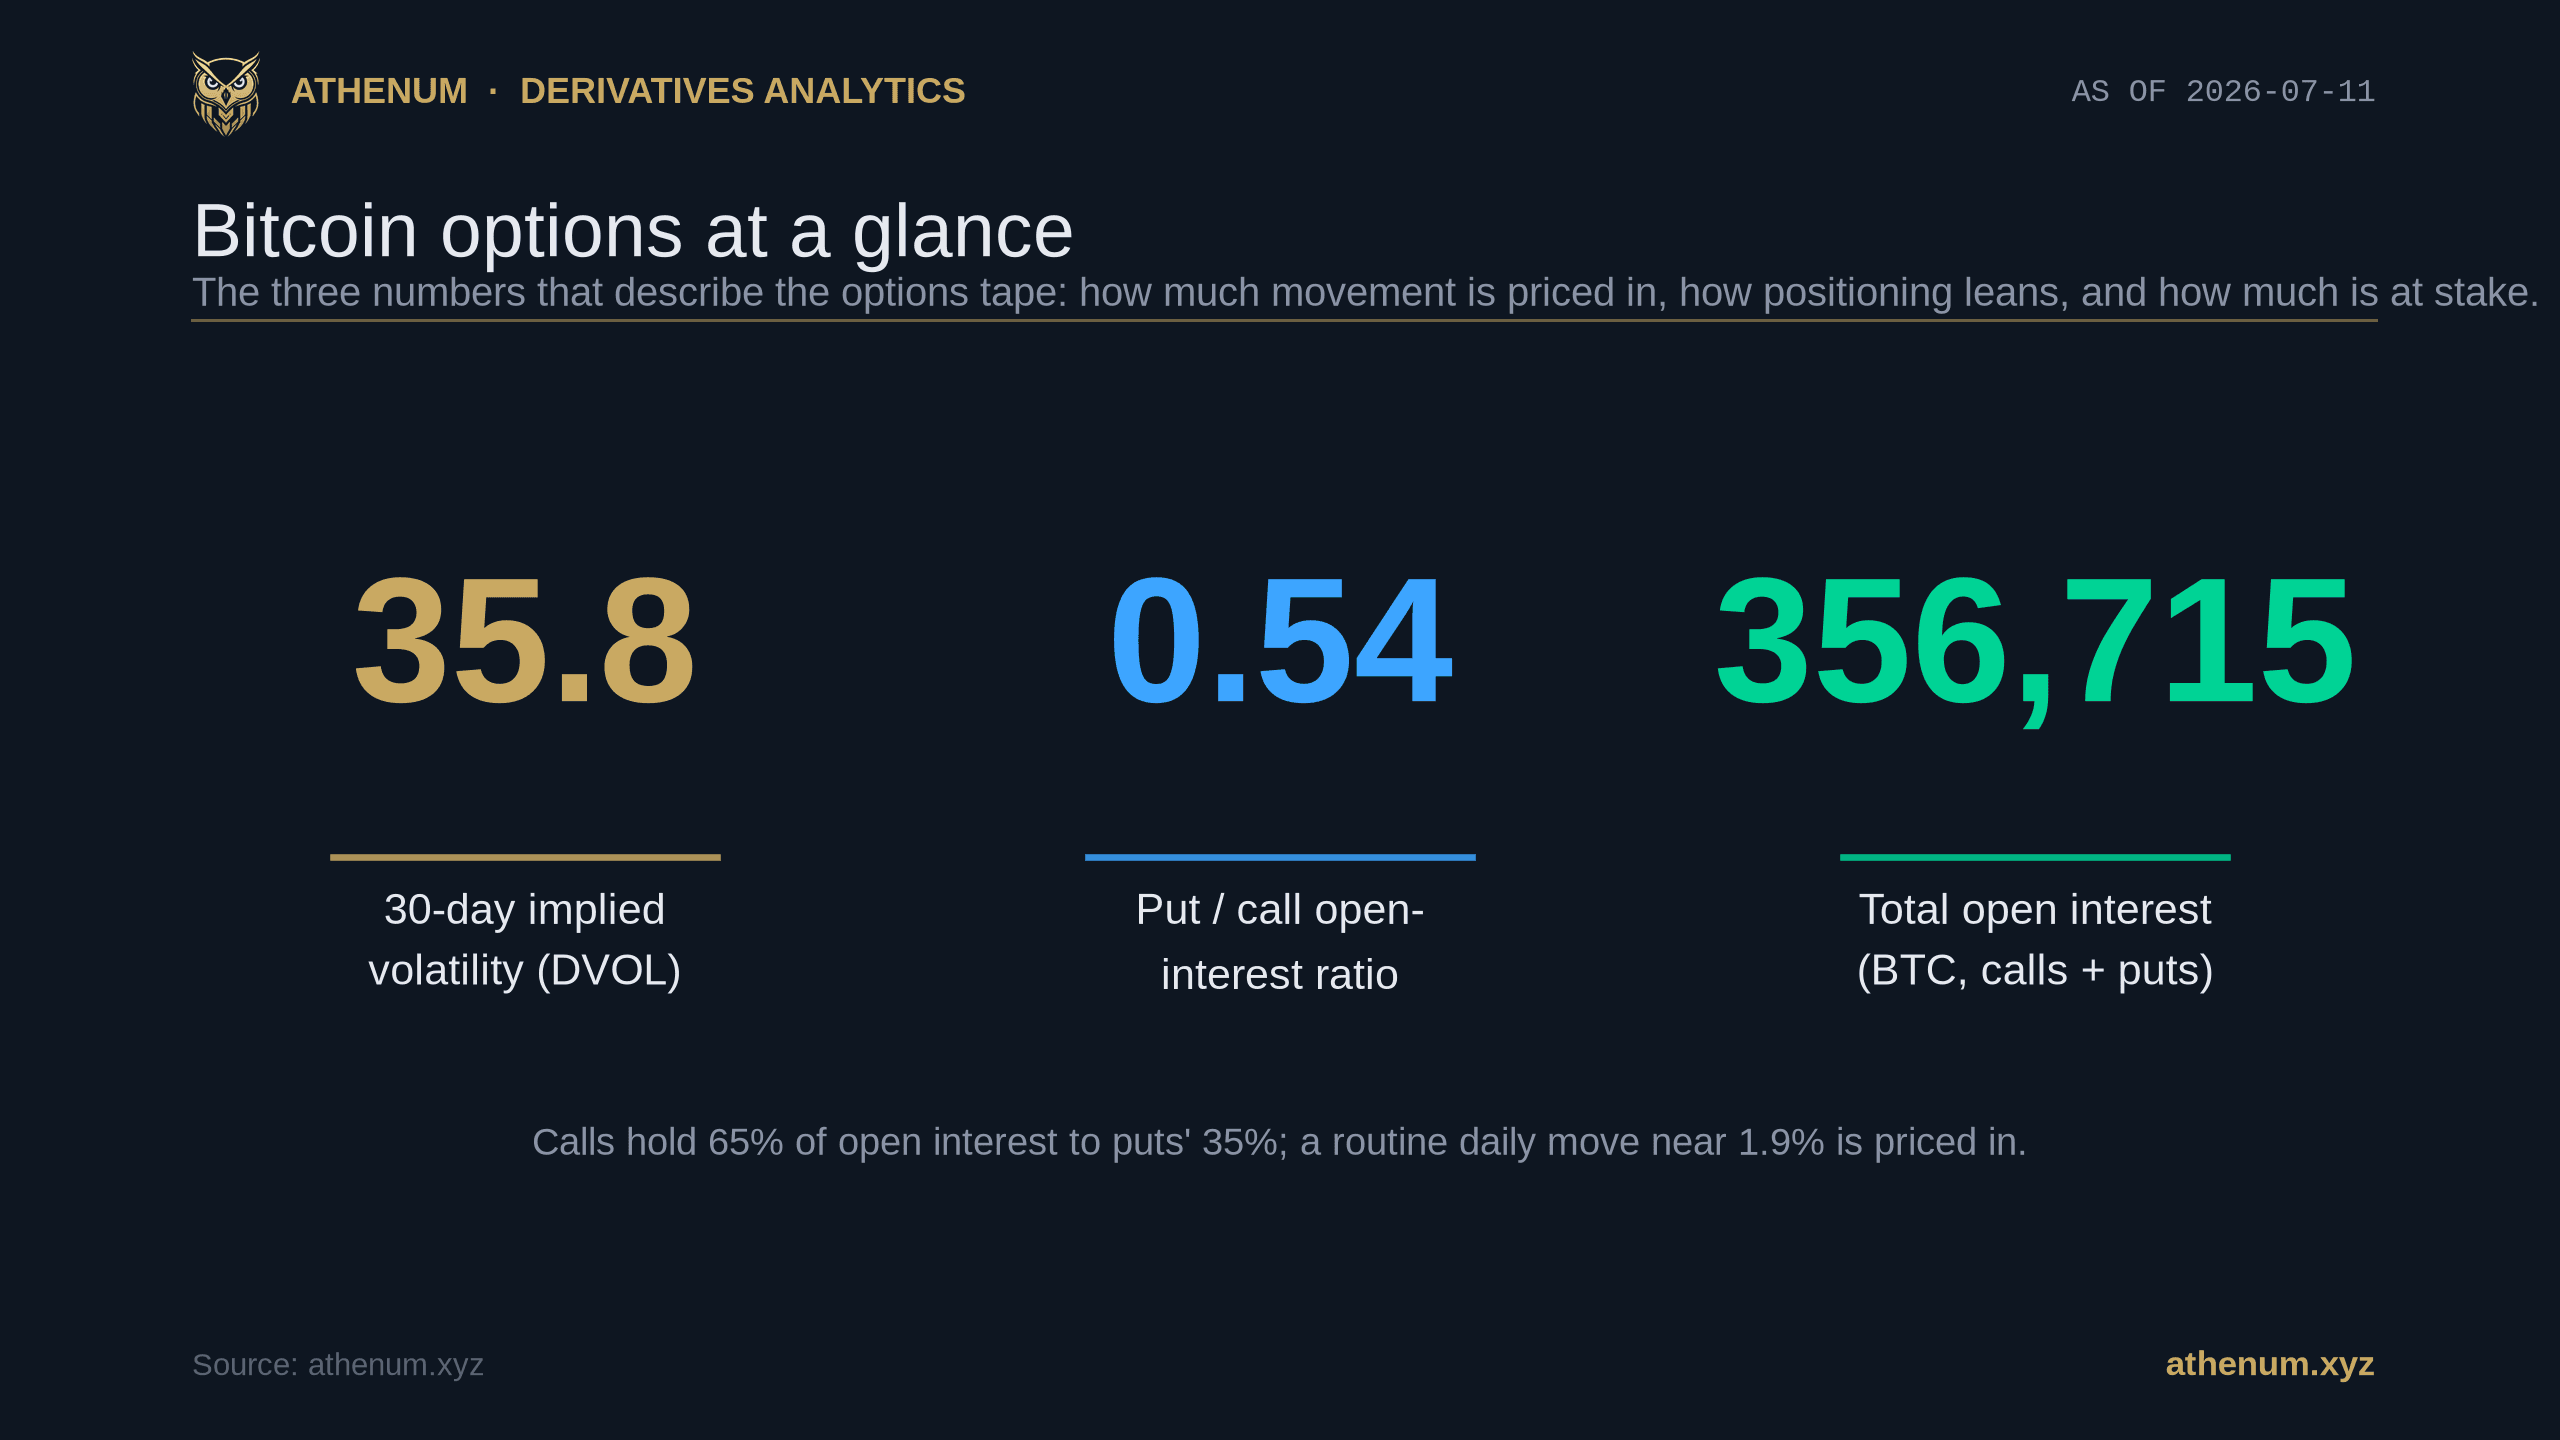
TLDR: The crypto options market is read through three numbers you can check live, not by guesswork. Implied volatility, tracked by Deribit's DVOL index, tells you how much movement is priced in; on 2026-07-11 Bitcoin's DVOL sat at 35.8, which implies a routine daily move near 1.9%. The put/call open-interest ratio tells you how positioning leans; at 0.54 it was call-heavy, with 231,152 BTC of call open interest against 125,563 BTC of puts. Open interest tells you how much is actually committed; 356,715 BTC across both sides. This guide explains what each number means, how to read them together, and how to price a single option yourself in the free Athenum calculators, no account required.
What are the three numbers that tell you how the crypto options market is positioned?
Reading the options market does not require a Bloomberg terminal or an options desk. Three public numbers do most of the work, and each answers a different question. Implied volatility answers "how much movement is the market paying for?" The put/call ratio answers "which way is positioning leaning?" And open interest answers "how much money is actually on the table?" Taken together they turn a wall of strikes and expiries into a two-line read on sentiment and risk. The table below shows each metric, what it measures, its live Bitcoin reading on 2026-07-11, and the signal it carries.
Metric | What it measures | Live BTC reading (2026-07-11) | What it is telling you |
|---|---|---|---|
Implied volatility (DVOL) | Expected 30-day annualized move priced into options | 35.8 | A routine daily move near 1.9% is priced in |
Put/call OI ratio | Open put interest divided by open call interest | 0.54 | More calls than puts open, a call-heavy lean |
Open interest | Total value of live option contracts | 356,715 BTC | Calls hold 65% of the open interest, puts 35% |
None of these three is a price prediction. They are a description of what other traders have already paid for and committed to, which is exactly why they are useful: they show you the crowd's positioning before the move, not after it. The rest of this guide takes each number in turn and then reads all three as one picture.
How much movement is the options market pricing in?
Implied volatility is the single number that says how large a move the options market expects. It is quoted as an annualized percentage, and Deribit's DVOL index is the standard 30-day forward gauge for Bitcoin. To turn an annualized figure into a daily one, divide by the square root of the number of days in a year: a DVOL of 35.8 divided by the square root of 365 is about 1.87%, so the market is pricing a typical one-day Bitcoin move near 1.9%. When DVOL rises, every option gets more expensive because a bigger move is expected; when it falls, premium drains out of the market.

Bitcoin implied volatility (DVOL) at 35.8 on 2026-07-11 implies a typical daily move near 1.9 percent; the index ranged from about 35.8 to 40.6 over the prior week.
Implied volatility only means something next to realized volatility, the move the market actually delivered. When implied sits above realized, options are pricing more movement than has been happening, so premium is relatively rich; when implied sits below realized, options look cheap against recent reality. That comparison is the entire basis of volatility trading, and it is covered in depth in realized vs implied volatility in crypto options. For now the takeaway is simpler: a DVOL of 35.8 is a subdued reading for Bitcoin, closer to the calm end of its range than to the fear levels that can push implied volatility above 70, and it frames every other options number you are about to read.
Is the options market leaning bullish or bearish?
The put/call ratio measures which side of the book carries more open interest. It is open put interest divided by open call interest, so a reading below 1 means more calls are open than puts, and a reading above 1 means the reverse. On 2026-07-11 Bitcoin's put/call open-interest ratio was 0.54, meaning puts held a little more than half the open interest that calls did. In share terms, calls held 65% of the total and puts 35%, the call-heavy tilt that crypto options usually show because so much of the flow is upside speculation and covered-call yield rather than downside hedging.

Bitcoin options open interest leans to calls: 231,152 BTC of calls (65 percent) versus 125,563 BTC of puts (35 percent), a put/call ratio of 0.54.
A call-heavy ratio is generally read as a risk-on lean, but the number rewards nuance rather than a reflex:
1. A ratio well below 1, like 0.54, says positioning is tilted toward upside, which is the crypto default rather than a strong bullish signal on its own. 2. A ratio climbing toward or above 1 says traders are buying downside protection, which often accompanies falling prices or rising fear. 3. Extremes cut both ways: an unusually low ratio can mark complacency near a top, and an unusually high one can mark capitulation near a bottom, so the metric is often read against its own recent range, not as an absolute.
Open interest itself is the context that makes the ratio meaningful. A put/call ratio built on thin open interest is noise; the same ratio on 356,715 BTC of committed contracts is a real map of where the market is positioned. Open interest works the same way in futures, where it pairs with the long/short ratio to show crowd positioning, as explained in the long/short ratio and open interest. And because so much open interest clusters at round strikes, it feeds directly into the max-pain price, the strike where the most option value expires worthless.
How do you price a single option and read its risk?
The three market-wide numbers set the scene, but eventually you want to price one specific contract. That is what the Black-Scholes model does: it takes the spot price, the strike, the days to expiry, the risk-free rate, and the implied volatility, and returns a fair value plus the Greeks that describe the option's risk. Feeding the live DVOL of 35.8% into a worked example makes the abstract number concrete. With Bitcoin near $64,200 on 2026-07-11, a 30-day call struck at $65,000 at 35.8% volatility and a 4% rate is worth about $2,357, with a delta of 0.49.

The free Athenum Black-Scholes calculator: a 30-day 65,000 dollar Bitcoin call at spot 64,200 and 35.8 percent implied volatility prices at 2,356.58 dollars with a 0.49 delta and 73.38 vega.
The Greeks are where a single price becomes a risk profile. Delta of 0.49 means the call gains roughly 49 cents per dollar Bitcoin rises and approximates a 49% chance of finishing in the money. Vega of 73.38 means the option gains about that many dollars for each one-point rise in implied volatility, which is why buying options right before DVOL jumps pays and buying after it spikes hurts. Theta of about -47 per day is the time decay you pay to hold it. You can price any contract yourself in the free Black-Scholes calculator, switch it into implied-volatility mode to back out the volatility from a market price, and map the profit and loss of full strategies in the options profit calculator.
How do you read implied volatility, put/call, and open interest together?
Any one of these numbers in isolation can mislead. Read together, they form a single sentence about the market. The method is a short checklist you can run in under a minute:
1. Start with implied volatility to size the expected move. A DVOL of 35.8 says plan for daily swings near 1.9% and weekly swings near 5%, so set strikes and stops outside that noise, not inside it. 2. Check the put/call ratio for the lean. At 0.54 the book is call-heavy, the crypto norm, so there is no crowded hedge to fade; a jump toward 1 would flag new demand for downside protection. 3. Weight it by open interest. With 356,715 BTC committed and 65% of it in calls, the positioning read is real rather than thin-book noise, and the heaviest strikes mark the levels the market will defend into expiry. 4. Cross-check against realized volatility and price. If implied is far above what the market is actually delivering, premium is rich; if a call-heavy book meets a falling price, the crowd is offside and forced selling can follow.
That sequence turns three raw readings into one call: on 2026-07-11 Bitcoin options were pricing a calm-to-normal 1.9% daily move, leaning gently bullish through a call-heavy book, on a healthy 356,715 BTC of open interest, with no crowded hedge to unwind. Every input is a live, dated number you can re-check rather than a vibe.
The bottom line
The crypto options market looks intimidating because it is presented as a grid of hundreds of strikes and expiries, but three numbers carry most of the signal. Implied volatility says how far the market expects price to travel, the put/call ratio says which way positioning leans, and open interest says how much conviction sits behind it. On 2026-07-11 those read 35.8, 0.54, and 356,715 BTC: a normal expected move, a call-heavy lean, and real committed size. Learn to read them together and you can size a trade and gauge sentiment before the move instead of after. Athenum aggregates live derivatives data across 14 exchanges and gives away 34 free calculators, with no account, no email, and no usage limits. Price your own option in the free Black-Scholes calculator, then start a free 7-day Pro+ trial of the full Athenum terminal, no card required.
One terminal. All the data.
Liquidations, orderbook depth, whale walls & open interest from 4 exchanges, all real-time, in one place.
No credit card required

Athenum Analytics
Athenum Analytics is our three-person editorial team covering crypto derivatives, market data and macroeconomic context.