Table of Contents5 sections
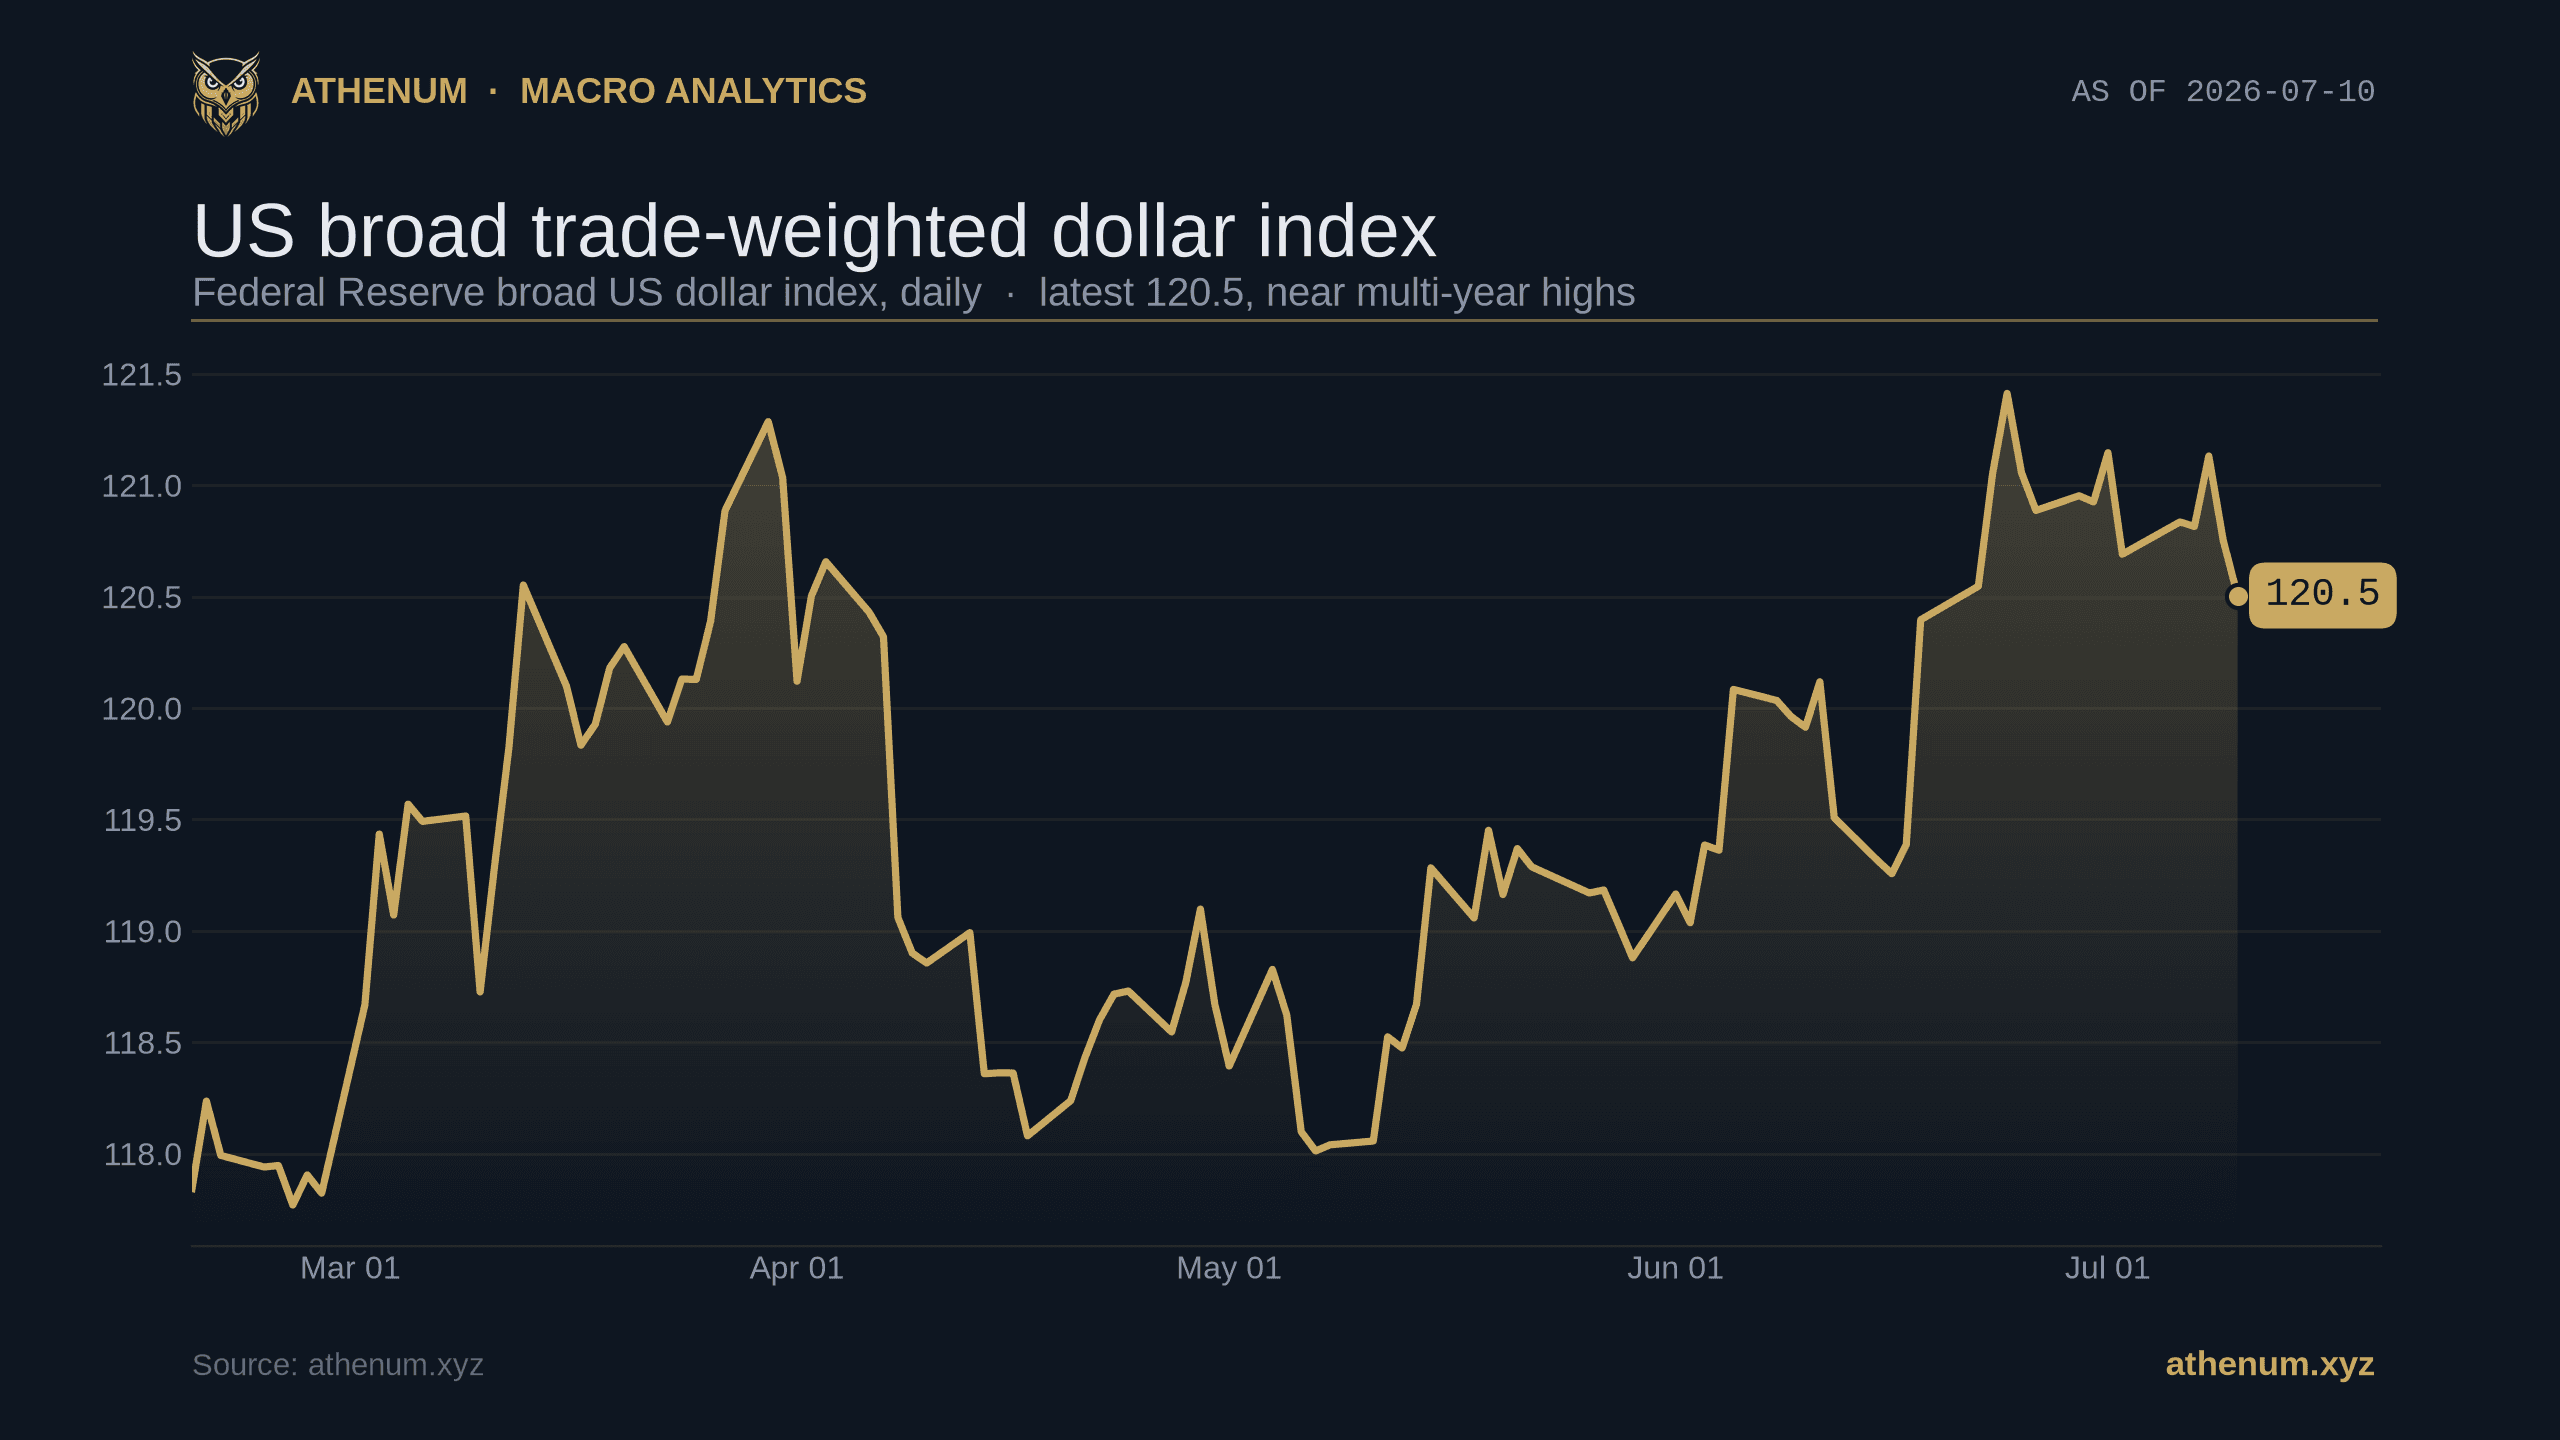
TLDR. The dollar index is the market's single best gauge of dollar strength, and through 2026 it has been the macro tide under Bitcoin. The Federal Reserve's broad trade-weighted dollar index sits near 120.5, close to multi-year highs, while the widely quoted ICE dollar index, ticker DXY, trades near 100.8, just below its recent cycle high; over the same stretch the US 10-year real yield has climbed to 2.36% by mid-July 2026. A firmer dollar and higher real yields are a headwind for a non-yielding asset, and Bitcoin has repriced from above $93,000 at the start of the year to the low $60,000s, near $64,600 on 2026-07-15. The catch: the dollar to Bitcoin correlation is real but not constant. It reached about -0.90 in April 2026, the most negative since 2022, yet flipped close to +1.00 in early 2026 when both fell together. Read the dollar as a slow-moving backdrop, not a mechanical inverse switch, then cross-check it against live crypto positioning.
What is the dollar index, and why do crypto traders watch it?
The dollar index measures the US dollar against a basket of other currencies, so one number tells you whether the dollar is broadly strong or weak. Two versions matter, and they are scaled differently. The one traders quote most is the ICE US Dollar Index, ticker DXY, a basket weighted heavily toward the euro; it trades near 100.8 in mid-July 2026, inside a 52-week range of roughly 95.6 to 101.8 and just below its recent cycle high. The broader measure is the Federal Reserve's trade-weighted broad dollar index, which spans far more trading partners and sits near 120.5, also close to multi-year highs. Different scales, same message: in 2026 the dollar has been firm, and it is the chart at the top of this post.
Crypto traders watch the dollar because it is a proxy for global liquidity and the price of risk. When the dollar strengthens, dollar-denominated funding gets scarcer, financial conditions tighten worldwide, and capital tends to rotate out of the far end of the risk curve, where Bitcoin sits. A strong dollar rarely triggers a crypto move by itself, but it sets the tide the whole risk complex has to swim against, which is why it belongs on a crypto trader's macro dashboard even though it never appears in an order book. The dollar is only one of several macro gauges worth reading against crypto, and the Athenum macro backdrop roundup reads it alongside equity volatility and real yields; this post zooms in on the dollar itself, the single gauge with the most direct claim on crypto liquidity.
Does a stronger dollar really push Bitcoin down?
Directionally, yes, and 2026 is a clean illustration. The mechanism is not magic, it is opportunity cost and liquidity. Bitcoin pays no yield, so when the risk-free real return rises, the bar an unproductive asset has to clear rises with it. The US 10-year real yield, the inflation-protected TIPS yield, has climbed from about 1.8% in February to 2.36% by mid-July 2026, and a strong dollar is the currency-market face of those same tight conditions. Against that backdrop Bitcoin has repriced lower all year, from above $93,000 in January to a 21-month low near $60,000 at the end of June, and it was trading around $64,600 on 2026-07-15.

US 10-year real yield climbing through 2026 to 2.36%: the rising real return that raises the opportunity cost of holding a non-yielding asset like Bitcoin.
None of this makes the dollar a sell signal for crypto on its own. It makes it context. A rising dollar and rising real yields together say the macro wind is blowing against risk, which is why rallies into a strong-dollar tape tend to be shallower and pullbacks deeper, and why the crypto side has spent 2026 grinding lower rather than trending up. The same slow-moving conditions show up elsewhere in the macro picture, from Athenum's read on the yield curve and credit spreads to how closely Bitcoin tracks the Nasdaq on Athenum, which is the equity-risk version of the very same story.
How reliable is the dollar to Bitcoin correlation?
Less than the headlines imply, because the correlation itself moves. The inverse relationship is real and can get extreme: Bitcoin's 30-day correlation with the DXY reached about -0.90 in April 2026, the most negative reading since 2022, with roughly 81% of Bitcoin's price variation statistically linked to the dollar over that window. But earlier in the same year the sign flipped. In late January and early February 2026 the correlation ran close to +1.00, because the dollar and Bitcoin fell together as markets repriced risk wholesale, and it swung back toward -1.00 only from mid-April as the dollar rallied and Bitcoin stalled.
Period (2026) | Dollar and Bitcoin behavior | 30-day correlation |
|---|---|---|
Late Jan to early Feb | Both fell together, risk repricing | near +1.00 |
Mid-March to early April | Both recovered together | positive |
Mid-April onward | Dollar up, Bitcoin stalled | toward -0.90 |
Two lessons follow. First, treat the dollar as a regime variable, not a tick-by-tick signal: it tells you which way the tide runs over weeks, not what the next candle does. Second, other forces can override it. Spot Bitcoin ETF flows, which reached roughly $1.97B in their strongest month of 2026, add a source of demand that is largely independent of the dollar, and that kind of cross-current is exactly what breaks a clean inverse for stretches at a time. If you want the dollar-independent side of the equation, the Athenum spot Bitcoin and Ether ETF flow explainer is where institutional demand shows up as a number.
How does the dollar's pressure show up in live crypto positioning?
If the dollar is the tide, derivatives positioning is the water level you can actually read, and right now it reads orderly, not euphoric. On Athenum's cross-exchange feed on 2026-07-15, aggregate BTC perpetual funding was +0.0086% per 8 hours, roughly +9% annualized, positive but close to the neutral baseline rather than the elevated readings that mark a crowded, over-levered long. Funding is also uneven across venues: it ran +0.0100% on Binance and OKX and +0.0099% on Bybit, but only +0.0018% on Deribit and +0.0012% on Hyperliquid, a spread of about 0.0088 percentage points per 8 hours between the richest and the cheapest venue.

BTC perpetual funding across venues on 2026-07-15: +0.0100% on Binance and OKX down to +0.0012% on Hyperliquid, aggregate +0.0086% per 8h, positive but far from euphoric.
Open interest tells the same measured story. Aggregate BTC futures open interest was about $17.9B on 2026-07-15, concentrated on Binance at 38.5% of the total, then Bybit at 20.1%, with Hyperliquid (13.0%), Bitget (12.8%), OKX (10.7%) and Deribit (4.2%) making up the rest, and the crowd only modestly net long at a 1.17 long to short ratio. That is a market carrying leverage without being stretched on it, which fits a strong-dollar regime: traders are cautious, funding sits near neutral, and no single venue is running away with a crowded long.

BTC futures open interest by venue on 2026-07-15: $17.9B aggregate, led by Binance at 38.5%, leverage spread across six major venues rather than piled into one.
How do you read the dollar and crypto leverage together?
You can turn the macro plus positioning cross-check into four repeatable steps:
1. Read the dollar as a regime, not a trigger. Note whether the DXY and the broad dollar index are trending up or down over weeks; up is a headwind for crypto, down is a tailwind, and neither one times the trade. 2. Confirm with real yields. A strong dollar paired with rising real yields, like the 2.36% reading in mid-July 2026, is a genuine tightening; a strong dollar with falling real yields is a weaker headwind. 3. Check whether the correlation is on or off. If the dollar and Bitcoin are moving inversely, the macro tide is in control; if they are moving together, a risk-repricing or a flow like ETF demand has taken over, and the dollar signal is muted for now. 4. Cross-check live positioning. Rich, one-sided funding and a lopsided long to short ratio into a strong dollar is a fragile setup; near-neutral funding like the +0.0086% per 8h reading on 2026-07-15 says the leverage is not yet crowded. Price the cost of that funding in the free Athenum funding rate calculator, then size the position in the Athenum leverage calculator before you act.
The numbers behind this post come from Athenum's live cross-exchange derivatives feed, 14 exchanges in one normalized view, alongside 34 free calculators with no account, no email, and no usage limits. Watch the dollar, real yields and live crypto positioning in one place: open the Athenum terminal and read the macro tide against the leverage yourself.
One terminal. All the data.
Liquidations, orderbook depth, whale walls & open interest from 4 exchanges, all real-time, in one place.
No credit card required

Athenum Analytics
Athenum Analytics is our three-person editorial team covering crypto derivatives, market data and macroeconomic context.