Table of Contents8 sections
- What is the Estimated Leverage Ratio (ELR) in crypto?
- What is the exact ELR formula?
- How is ELR calculated, step by step?
- What is a high vs low ELR, and what does each mean?
- What are real ELR readings for BTC and ETH?
- How do traders actually use ELR?
- What are the most common ELR mistakes?
- See leverage build-up across the market in one view
TLDR: The crypto Estimated Leverage Ratio (ELR) is a venue-level ratio of derivatives open interest to the coin reserves held on that same exchange, both measured in native coin units, so the number is dimensionless. As defined by CryptoQuant (where the metric originated) and mirrored by Glassnode, ELR = exchange futures open interest / exchange coin reserve. It estimates how leveraged the crowd is, because it cannot see individual margin and instead infers leverage from how large open interest is relative to the coins sitting on the venue as collateral. A rising ELR means leverage is building and the market is getting fragile and squeeze-prone. A falling ELR means traders are de-risking and forced-flow risk is lower. Critically, this is NOT open interest divided by market cap, which is a different "leverage ratio" that gets conflated with ELR all the time.
What is the Estimated Leverage Ratio (ELR) in crypto?
The Estimated Leverage Ratio is an exchange-level (or aggregated-across-exchanges) ratio of derivatives open interest to the coin reserves held on that same exchange. It is an ESTIMATE, which is what the word "Estimated" signals, because no public metric can read individual traders' margin or position sizes. Instead it infers average crowd leverage from one observable relationship: how big is open interest relative to the coins available on the venue to back those positions?
CryptoQuant, where the metric originated and is most widely cited, states it plainly: "Estimated Leverage Ratio = Open Interest / Amount of Reserve ... ELR for a derivative exchange tells us how much leverage is used by users on average." Glassnode defines its "Futures Estimated Leverage Ratio" identically, as "the ratio of the open interest in futures contracts and the balance of the corresponding exchange." Because the numerator (open interest) is one input here, it helps to first understand what open interest actually measures before layering the ratio on top of it.
What is the exact ELR formula?
The canonical formula is a single division with both legs denominated in the same coin units:
ELR = Exchange Futures Open Interest / Exchange Coin Reserve
- Numerator: total open interest in perpetual and futures contracts on the exchange for a given asset, expressed in coin units (for example, BTC or ETH, not USD). - Denominator: the amount of that same coin held in wallets attributable to the exchange, its on-chain reserve available as margin, in the same coin units.
Because both legs are in native coin terms, the price cancels out and the ratio is unitless. ELR rises if open interest grows OR if exchange reserves fall (coins withdrawn to self-custody). It falls if open interest shrinks OR reserves grow. The aggregated "all-exchanges" version sums open interest across tracked venues over the summed reserves of those venues.
How is ELR calculated, step by step?
Here is the canonical methodology in order:
1. Pick the asset and venue. ELR is computed per asset (BTC, ETH, and so on) for a single exchange, or aggregated across a basket of tracked venues. 2. Measure futures open interest in coin units. Take the total notional open interest in that asset's perpetual and futures contracts, then express it in the native coin (for example, BTC), not in dollars. 3. Estimate the exchange's coin reserve. Use on-chain wallet clustering and attribution to sum the coins held in wallets the provider assigns to that exchange. This is the collateral base. 4. Divide. ELR = open interest (coin) / reserve (coin). Both legs share the same unit, so the output is a small dimensionless number. 5. Compare to the asset's own recent range. There is no universal threshold. Read the trend and where the current print sits versus the last several months for that specific asset and provider. 6. Confirm with context. Pair ELR with directional and cost signals before acting (more on that below).
What is a high vs low ELR, and what does each mean?
Because both legs are in coin units, raw ELR is a small number, roughly 0.1 to 0.8 in practice for BTC and ETH. "High" is relative to recent history, not an absolute line in the sand. Here is the interpretation at a glance:
Rising or high ELR. Open interest is expanding faster than reserves, or coins are leaving exchanges while OI holds. More of the positioning is leveraged rather than spot-backed, so the market is crowded, fragile, and squeeze and cascade prone. Read: tighten risk and watch funding and liquidation heatmaps.
Falling or low ELR. Traders are closing positions or coins are returning, and open interest is shrinking relative to reserves. Less of the market is leveraged, so forced-liquidation risk is lower even under stress. Read: a healthier backdrop with lower forced-flow risk.
A sharp ELR spike to local extremes is a classic "primed for a flush" warning. CryptoQuant explicitly noted that leverage falling since late 2025 reduced cascade risk, which is the falling-ELR case in action.
What are real ELR readings for BTC and ETH?
These dated, checkable data points show how ELR moves with the cycle. Treat the exact decimals as approximate, since they come from reputable outlets citing CryptoQuant data rather than read off the live chart.
1. BTC ELR peaked at ~0.2709 on Apr 25, 2025, its highest since Jan 10, 2023, after rising from ~0.236 (Apr 20) to ~0.264 (Apr 22). (CryptoQuant data via CryptoSlate, Apr/May 2025.) 2. BTC ELR ~0.184 in Jan 2026, the highest reading since Nov 2025. (CryptoQuant via TheCryptoBasic/Yahoo Finance, Jan 22, 2026.) 3. BTC ELR hit a yearly high of ~0.26 on Feb 13, 2026. (CryptoQuant data via CCN, Feb 2026.) 4. ETH ELR reached an all-time high of ~0.751 in the week of Mar 19, 2026, read as more than 75% of ETH trading on the venue using leverage, alongside ~$6.6B ETH open interest on Binance and record-low ETH exchange reserves. (CryptoQuant via FXStreet, Mar 19, 2026.) 5. ETH ELR ~0.55 in the week leading into Oct 10, 2025, immediately preceding the largest-ever single-day deleveraging of more than $19B liquidated (~1.62M accounts, ~87% longs) on Oct 10, 2025. (CryptoQuant/CoinDesk/CoinGecko, Oct 2025.)
Note that ETH runs structurally higher than BTC, and ELR overall has drifted higher over time as exchange reserves fell to multi-year lows while open interest grew.
How do traders actually use ELR?
ELR is read primarily as a trend and regime gauge of crowd leverage and fragility, not as a standalone timing trigger.
Rising ELR = leverage build-up. Open interest is expanding faster than exchange reserves, so a larger share of positioning is leveraged rather than spot-backed. That raises the risk of a long or short squeeze, a deleveraging event, and a liquidation cascade. Markets become primed for sharp, OI-driven volatility. ETH's record-high ELR runs preceding the Oct 10, 2025 cascade are the textbook example.
Falling ELR = de-risking. Traders are closing positions, open interest is shrinking relative to reserves, and the odds of cascading forced liquidations drop even during stress.
Because ELR is direction-agnostic, it tells you the system is stretched but not which way it breaks. Pair it with how open interest differs from trading volume to separate real position build-up from churn, with the OI-weighted funding rate to read positioning bias and cost of carry, and with the long/short ratio for directional crowding. When a high ELR sets up the conditions, understanding why over-leveraged systems unwind in cascades tells you what the flush looks like.
What are the most common ELR mistakes?
1. Denominator confusion (the biggest one). Canonical ELR uses EXCHANGE RESERVES, not market cap. There is a separate "leverage ratio" defined as global open interest / market capitalization (Delphi Digital's framing, and TradingView community scripts such as LordOfTheBlockchains' "Crypto Leverage Ratio [Market Cap / Open Interest]"). That OI/market-cap version is a market-wide gauge and is NOT what CryptoQuant or Glassnode call ELR. Citing OI/market-cap as "ELR" is the most common error. 2. Reserve estimation error. Exchange reserves are inferred from on-chain wallet attribution. Custody reshuffles, cold-wallet moves, and large transfers can spike or drop the denominator and create artificial ELR moves. Different providers cluster wallets differently, so absolute values differ between CryptoQuant and Glassnode. Compare a series only to itself. 3. Coin vs USD denomination. Both legs must be in coin units. Mixing USD open interest with coin reserves silently embeds price and breaks the estimate. 4. No fixed threshold. Falling exchange balances push ELR structurally higher over years, so a "record high" can partly reflect shrinking reserves, not just more leverage. Read the trend, never a static cutoff. 5. It is an estimate, and directionless. It captures average leverage on tracked centralized venues only. It misses DEX and perp-DEX open interest and OTC margin, and it does not tell you which way the market breaks. Pair it with funding, long/short ratio, and OI delta.
Glassnode also publishes a separate idea, "Leverage Position Openings/Closures," inferred from price versus open-interest co-movement with no reserve or market-cap denominator at all. Do not conflate that with ELR either.
See leverage build-up across the market in one view
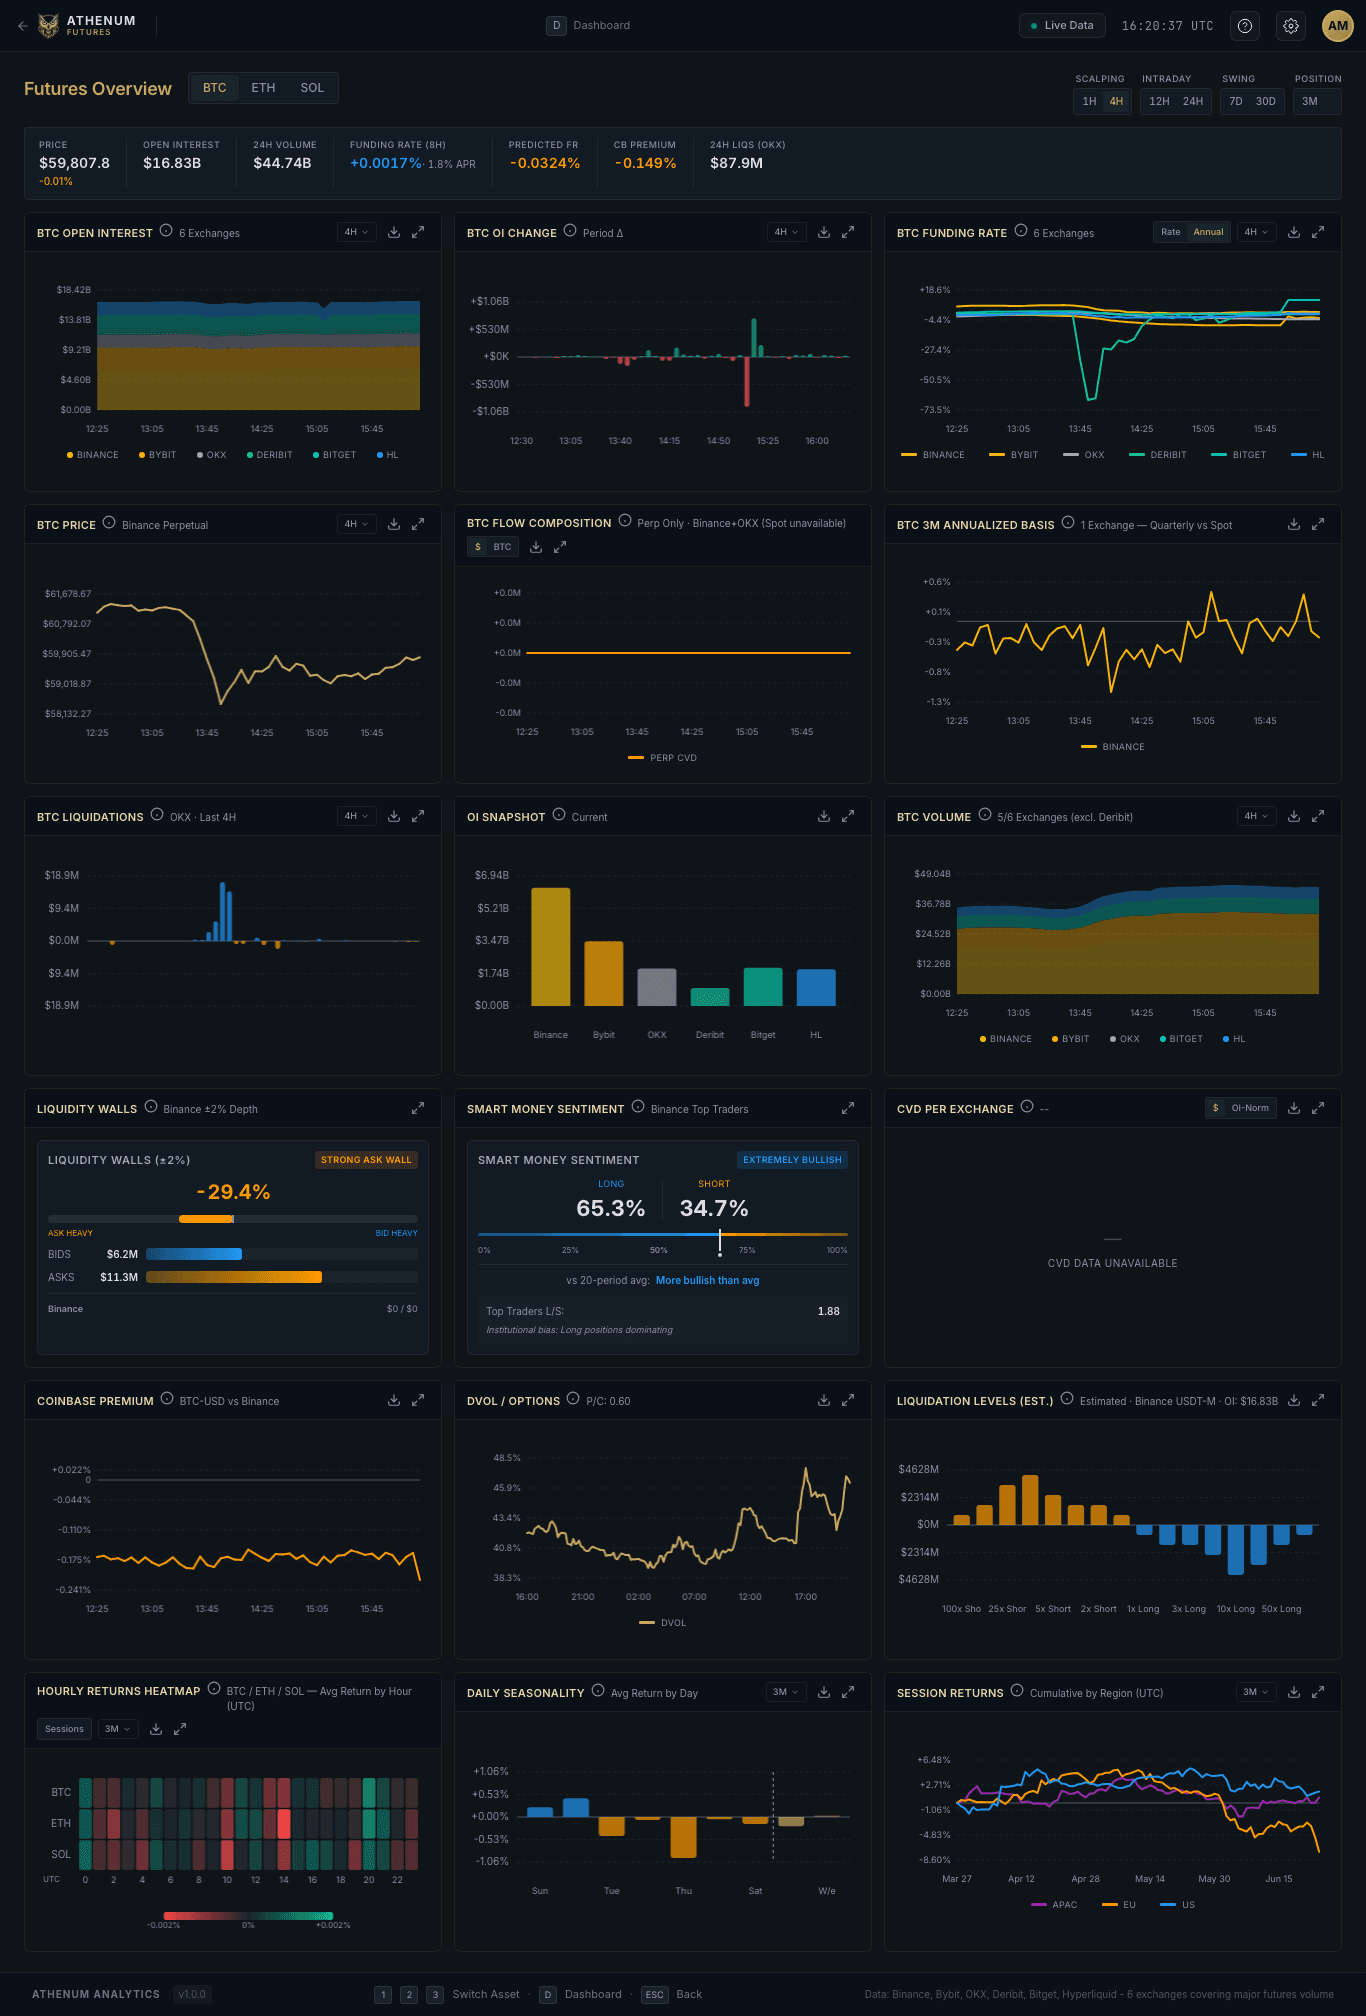
ELR is most useful when you can watch open interest, funding, and liquidation pressure together, across venues, in real time. Athenum is a live self-serve crypto and derivatives analytics terminal that combines order flow, derivatives, and macro/institutional data in a single view across 14 exchanges, the only terminal that brings all three together. It also ships 28 free /tools calculators, including a leverage calculator to size positions against your own liquidation distance.

Aggregated BTC futures open interest at $18.0B on 2026-08-03, between $17.0B and $18.2B over eight days, about 7%. Mind the denomination: this aggregate is in dollars, while the ELR formula above needs both legs in coin units. The axis starts at $17.0B, not zero.
Crypto trades 24/7, and so does the leverage picture. Start free, or take the real 7-day Pro+ trial with no card required at **app.athenum.xyz/auth** and watch ELR-style leverage build-up unfold live.
*Data points are dated as of the cited sources (Apr 2025 through Mar 2026) and reflect CryptoQuant data reported via secondary outlets. Exact decimals are approximate; compare any ELR series only to its own history. This is market education, not financial advice.*
One terminal. All the data.
Liquidations, orderbook depth, whale walls & open interest from 4 exchanges, all real-time, in one place.
No credit card required

Athenum Analytics
Athenum Analytics is our three-person editorial team covering crypto derivatives, market data and macroeconomic context.