Table of Contents6 sections
Practise with worked lessons
- Separate leverage, margin and liquidation risk
Leverage and margin are different risks. Calculate initial margin for one position at two leverage settings; a maintenance buffer is not a liquidation price.
TLDR: Leverage on a crypto futures trade comes down to three numbers you can compute yourself: required margin (position size divided by leverage), liquidation price (the level where your margin is exhausted), and ROI (PnL divided by margin). At 10x, a 5.8 percent favorable price move turns into roughly a 58 percent return on margin, and the same 10x multiplies your downside risk. This guide walks through each formula with a real worked example, then hands you the free crypto leverage calculator on Athenum so you can run the same math on any pair before you size a position. As of 2026-06-23, with BTC trading near $62,300, getting the liquidation number right is the difference between a managed trade and a surprise.
What is leverage and how do you calculate required margin?
Leverage is the ratio between the size of the position you control and the margin you post as collateral. A 10x position means you control ten dollars of exposure for every one dollar of margin, so a small amount of capital commands a much larger trade. That is the appeal and the danger at once, because the same multiple that magnifies your gain on a favorable move magnifies your loss on an adverse one.
The formula is straightforward:
Required margin = Position size / Leverage
For a $10,000 position at 10x leverage, required margin is $10,000 / 10 = $1,000. That $1,000 is the entire collateral at risk in isolated margin mode. If the trade moves against you far enough to consume it, the position is liquidated and the margin is gone.
How do you calculate the liquidation price for a leveraged position?
The liquidation price is the level at which your losses equal your posted margin, so the exchange force-closes the position to avoid negative balance.
A common first approximation for an isolated long is:
Naive liquidation (long) = Entry x (1 - 1 / Leverage)
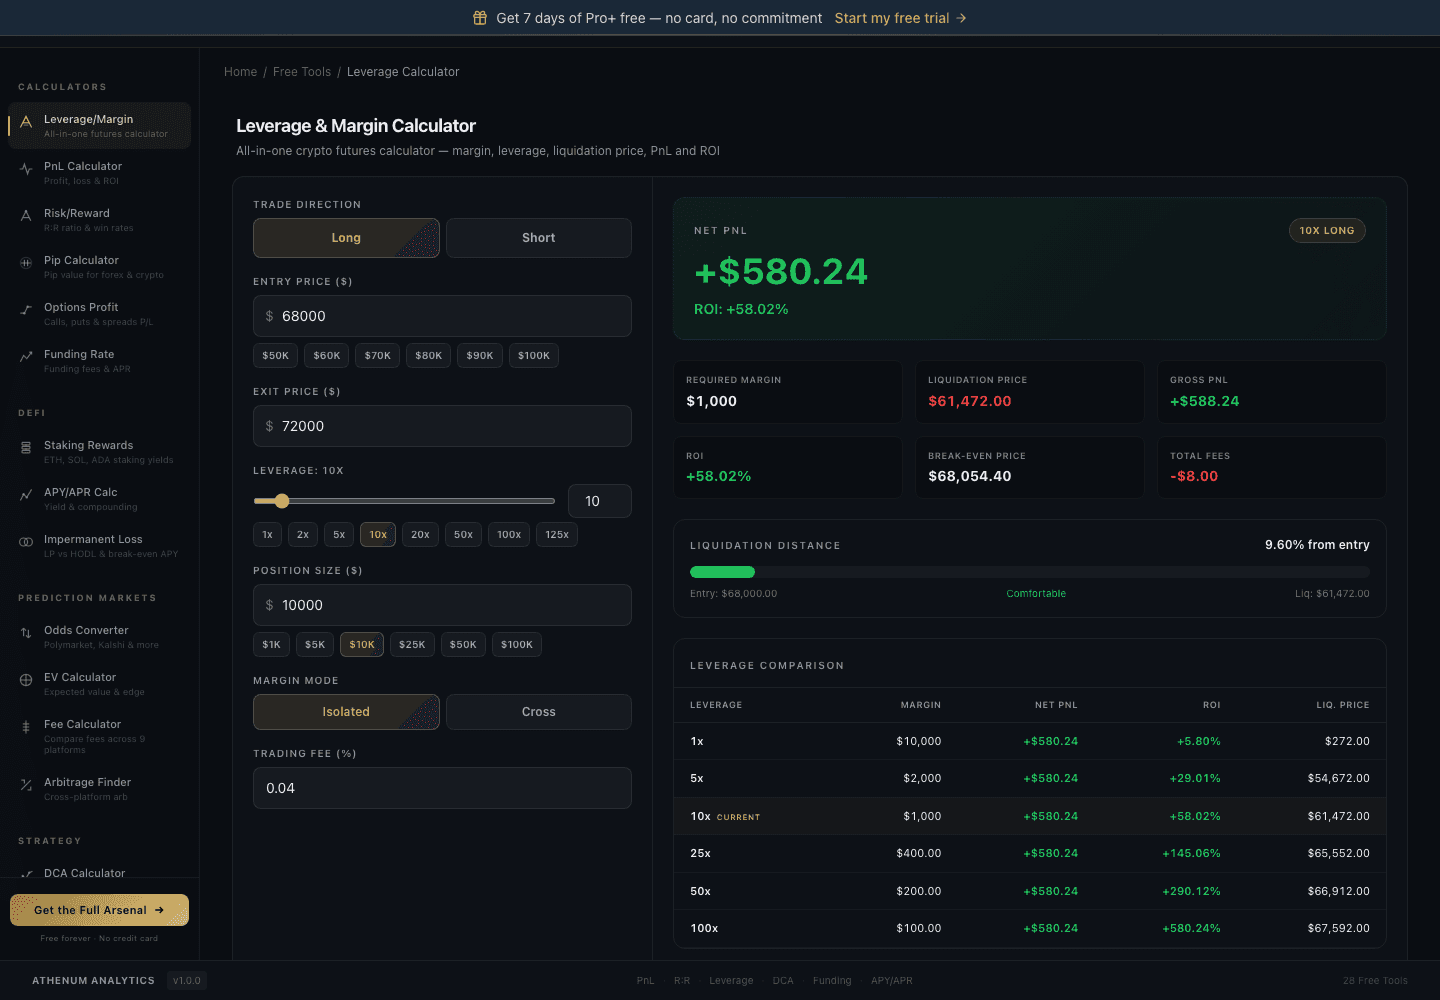
For a 10x long entered at $68,000, that gives $68,000 x (1 - 0.10) = $61,200. The naive figure is useful for intuition, but it is not the number a real exchange uses. The actual liquidation price sits slightly closer to entry, at $61,472.00 in this example, because exchanges require a maintenance margin (a small minimum margin buffer that must remain in the position) and they reserve for closing fees. Both eat into your buffer, so liquidation triggers earlier than the naive formula suggests. For a short, the direction flips: liquidation sits above entry, at roughly Entry x (1 + 1 / Leverage), again pulled slightly toward entry by maintenance margin and fees.

Athenum free crypto leverage and margin calculator, 10x long worked example, 2026-06-23
You do not have to compute this by hand. The free crypto leverage calculator on Athenum applies the maintenance-margin-adjusted formula and returns the same $61,472.00 figure shown above. One important note on which price triggers it: exchanges liquidate against the mark price, not the last traded price, which is why the level can fire before the last print reaches it. We cover that distinction in mark price vs index price vs last price.
How does leverage change the liquidation price?
The higher the leverage, the thinner the margin buffer, so the liquidation price moves much closer to entry. Holding the same $68,000 entry, the calculator shows how the liquidation price compresses as leverage rises:
1x: liquidation near $272, effectively unleveraged.
5x: liquidation at $54,672.
10x: liquidation at $61,472.
25x: liquidation at $65,552.
50x: liquidation at $66,912.
100x: liquidation at $67,592, where a move of only about 0.6 percent against you is enough to wipe the position.
At 1x you would need price to fall almost to zero. At 100x, a tiny adverse move liquidates you, and clustered liquidation levels near the current price are exactly what fuel cascade dynamics, which we break down in how liquidation cascades happen in crypto futures.
How do you calculate PnL and ROI on a leveraged trade?
PnL is driven by the underlying price move applied to your full position size, not just your margin. ROI then measures that PnL against the margin you actually posted.
ROI = Net PnL / Margin
Work the example: a 10x long, $10,000 position, entered at $68,000 and exited at $72,000.
1. Compute required margin: $10,000 / 10 = $1,000.
2. Compute gross PnL: the price move is ($72,000 - $68,000) / $68,000 = 5.882 percent. Applied to the full $10,000 position, gross PnL is +$588.24.
3. Subtract fees: at a 0.04 percent trading fee on entry and exit, total fees are -$8.00, giving net PnL of +$580.24.
4. Compute ROI: $580.24 / $1,000 = +58.02 percent.
A 5.882 percent price move produced a 58.02 percent return on margin. That is the leverage multiplier at work: roughly 10x the percentage price move, less fees. The break-even price for this trade is $68,054.40, which is the entry adjusted upward to cover round-trip fees. Below break-even the position is unprofitable even though it is still well above the $61,472.00 liquidation level.
A 3-step methodology for sizing any leveraged trade
1. Set your margin and position: decide how much margin you are willing to lose, then derive position size from your leverage (Position size = Margin x Leverage). Treat the margin as the maximum you can lose on an isolated position.
2. Find your liquidation price before you enter: use the maintenance-margin-adjusted liquidation figure, not the naive 1 / Leverage shortcut, and confirm there is room between it and the price levels you expect the market to test.
3. Project PnL, ROI, and break-even: model the favorable and adverse cases so the reward justifies the liquidation risk, and confirm your target sits comfortably beyond break-even after fees.
The fastest way to run all three steps is the calculator at https://www.athenum.xyz/tools/leverage-calculator, which returns margin, liquidation price, break-even, gross and net PnL, and ROI from a single set of inputs. It is one of the 28 free tools on Athenum's free tools page, alongside funding, basis, and position-sizing calculators. Athenum's broader self-serve terminal covers live derivatives data across 14 exchanges, but the calculator itself is a standalone free tool you can use without an account.
Bottom line
Three formulas carry most of the weight: margin is position size divided by leverage, ROI is PnL divided by margin, and liquidation price is the maintenance-margin-adjusted level where your collateral runs out. The naive Entry x (1 - 1 / Leverage) shortcut gets you in the neighborhood, but real liquidation sits closer to entry once maintenance margin and fees are counted, which is why the worked 10x long liquidates at $61,472.00 rather than $61,200. Run your own numbers on Athenum before every position so the liquidation level is never a surprise.
One terminal. All the data.
Liquidations, orderbook depth, whale walls & open interest from 4 exchanges, all real-time, in one place.
No credit card required

Athenum Analytics
Athenum Analytics is our three-person editorial team covering crypto derivatives, market data and macroeconomic context.