Practise with worked lessons
- Plan a liquidity sweep and reclaim as a testable setup
Define the reference level, sweep, reclaim and invalidation before entry. See how a 2:1 chart ratio becomes 1.5:1 after costs, and log failed sweeps too.
A "stop hunt" sounds like intent, as if one actor reaches in and grabs your stop. The more useful framing is mechanical. Leverage stacks at predictable price levels, those positions carry forced exit prices, and price tends to travel toward the largest pools of that forced liquidity because filling them is where size gets done. When price reaches the pool, clears it, and snaps back, that is a liquidity sweep. None of this requires drawing zones by hand. The liquidity is in the data before the move, and the sweep leaves a measurable footprint while it happens.
This piece reframes a Smart Money Concepts idea as what it actually is in derivatives data: a question about where resting liquidity sits and how to confirm it was taken. Three datasets answer it. The liquidation heatmap shows where leveraged stop liquidity clusters. The order book shows resting limit size, including whale walls. Cumulative volume delta, or CVD, shows whether aggressive flow into a level is being absorbed or is following through.
Where does stop-hunt liquidity actually sit?
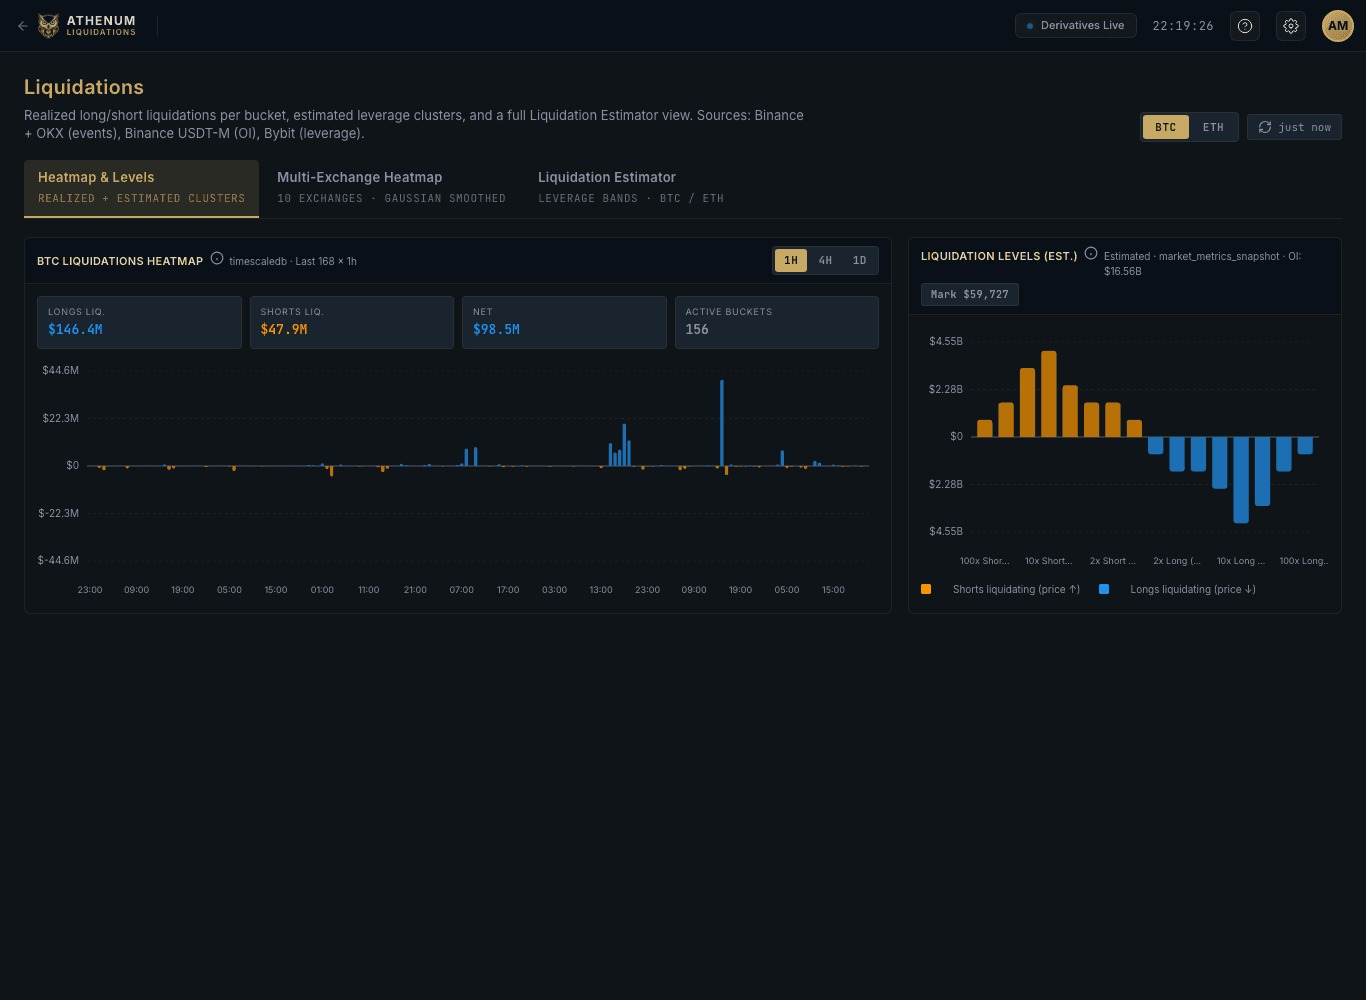
Stop liquidity is not evenly spread across the chart. It pools at the forced exit prices of crowded leveraged positions, and a liquidation heatmap is the tool that surfaces those pools. The heatmap models leverage tiers across positions and projects the price levels where liquidations would trigger, then shades them by estimated size. Brighter bands mark dense clusters where crowded leverage would unwind quickly; dim bands mark thin pockets. Read it as a map of magnets. Price is drawn toward the bright bands because that is where the largest pool of forced orders, and therefore guaranteed fills, is waiting.

Athenum BTC liquidation heatmap and estimated liquidation levels by leverage band: bright clusters mark where leveraged stop liquidity pools. Source: Athenum.
The June 2026 Bitcoin cascade is a clean worked example. Years of one-directional long positioning had stacked large liquidation clusters between $65,000 and $60,000. When price broke $63,000 on June 4, it punched through that entire cluster within hours, and more than $3 billion in leveraged positions were liquidated across derivatives markets between June 4 and June 6, with longs accounting for roughly 84% to 85% of BTC-specific losses. The cluster was visible on the heatmap before the break. The cascade was the cluster being consumed.
For position sizing around these zones, model the level before you trade it with the Athenum leverage calculator, and read how to read liquidation heatmaps for the full methodology.
How does a liquidity sweep print in the data?
A sweep is not a candle shape. It is a sequence across three feeds.
1. Before the move, a bright liquidation cluster sits just beyond an obvious level, a recent swing high or round number, where retail stops congregate. 2. Price pushes into that cluster and a burst of liquidations fires. On the liquidations feed you see a spike concentrated on one side, longs into a downside sweep, shorts into an upside sweep. 3. As the burst lands, watch CVD against price. If price keeps extending but CVD diverges, making a lower high while price makes a higher high, the aggressive flow is being absorbed by passive limit orders rather than driving the move. That divergence is the absorption signal. 4. Price reverses out of the cluster. The magnet is gone because the resting liquidity that pulled price in has been consumed.
The tell that separates a real sweep from a trend continuation is step 3. CVD without order book context is half a picture. When price and CVD move together, aggressive participation is driving the move and it tends to continue. When they diverge, the move is being driven by passive absorption and tends to reverse. A sweep is the diverging case by definition: heavy aggressive selling into the cluster, price refusing to follow through, CVD rolling over.
How do whale walls fit, and when are they fake?
The order book shows resting limit liquidity, and a whale wall is an outsized resting order that can act as support or resistance. The problem is that not all of it is real. Spoofing is placing a large order with no intention of executing it, to push price or sentiment, then pulling it. Between 40% and 70% of visible limit orders on major exchanges never execute. In April 2025 a roughly $212 million Bitcoin sell order appeared on Binance near $85,600, well above the market price, and vanished moments later after rattling sentiment.
So a whale wall is a hypothesis, not a fact, until trade flow confirms it. The confirmation again comes from CVD. A genuine wall absorbs: price grinds into it, aggressive volume hits it, CVD shows that selling or buying pressure, and price holds anyway because passive orders are eating the flow. A spoof wall does not absorb because there is nothing to absorb with; it disappears the moment price approaches. Read the order book and CVD together, and learn the wider context in how to read the crypto long/short ratio.
What is the confirmation checklist?
Use one table instead of pattern-drawing. Each row is a measurable data condition, not a visual one.
Signal | Sweep / absorption (likely reversal) | Real breakout (likely continuation) |
|---|---|---|
Liquidation heatmap | Bright cluster just past the level, consumed by the move | Cluster already cleared, thin space ahead |
Liquidations feed | One-sided burst that exhausts quickly | Sustained, building liquidations as price travels |
CVD vs price | Diverges, price extends but CVD rolls over | Confirms, CVD trends with price |
Order book wall | Wall absorbs flow and holds | Wall pulled or eaten through cleanly |
Aftermath | Price snaps back out of the cluster | Price accepts the new range and continues |
If most rows land in the left column, you are looking at a sweep, the liquidity that drew price in has been taken, and the reversal odds are higher. If they land on the right, the level is genuinely breaking. The judgment is data-led, repeatable, and free of subjective zone drawing.
Where to watch this on Athenum
Athenum aggregates derivatives data across 14 exchanges so the liquidation heatmap, the order book and whale walls, and CVD sit in one place rather than across three tabs. That matters for sweeps because the confirmation is cross-feed: the cluster on the heatmap, the burst on liquidations, and the divergence on CVD have to be read together within seconds. Funding, open interest, and basis add the positioning context that tells you whether a crowded side is set up to be swept in the first place, and the open interest vs volume breakdown explains how to read that buildup.
Athenum is live and self-serve with a real 7-day Pro+ free trial and no card required. Open the liquidation heatmap and order book and pull up CVD on the same screen, then watch a level you already care about and see whether the next push into it is a sweep or a break.
A stop hunt is just leverage being collected where the data said it was sitting. You do not have to guess at it. The cluster, the liquidation burst, and the CVD divergence describe the whole event, and they are all on the chart before and during the move.
One terminal. All the data.
Liquidations, orderbook depth, whale walls & open interest from 4 exchanges, all real-time, in one place.
No credit card required

Athenum Analytics
Athenum Analytics is our three-person editorial team covering crypto derivatives, market data and macroeconomic context.