Practise with worked lessons
- Long/short ratio: compare account counts with position size
Calculate long-holder share, the account ratio and open interest from one ledger. More long accounts do not prove greater long exposure in the market.
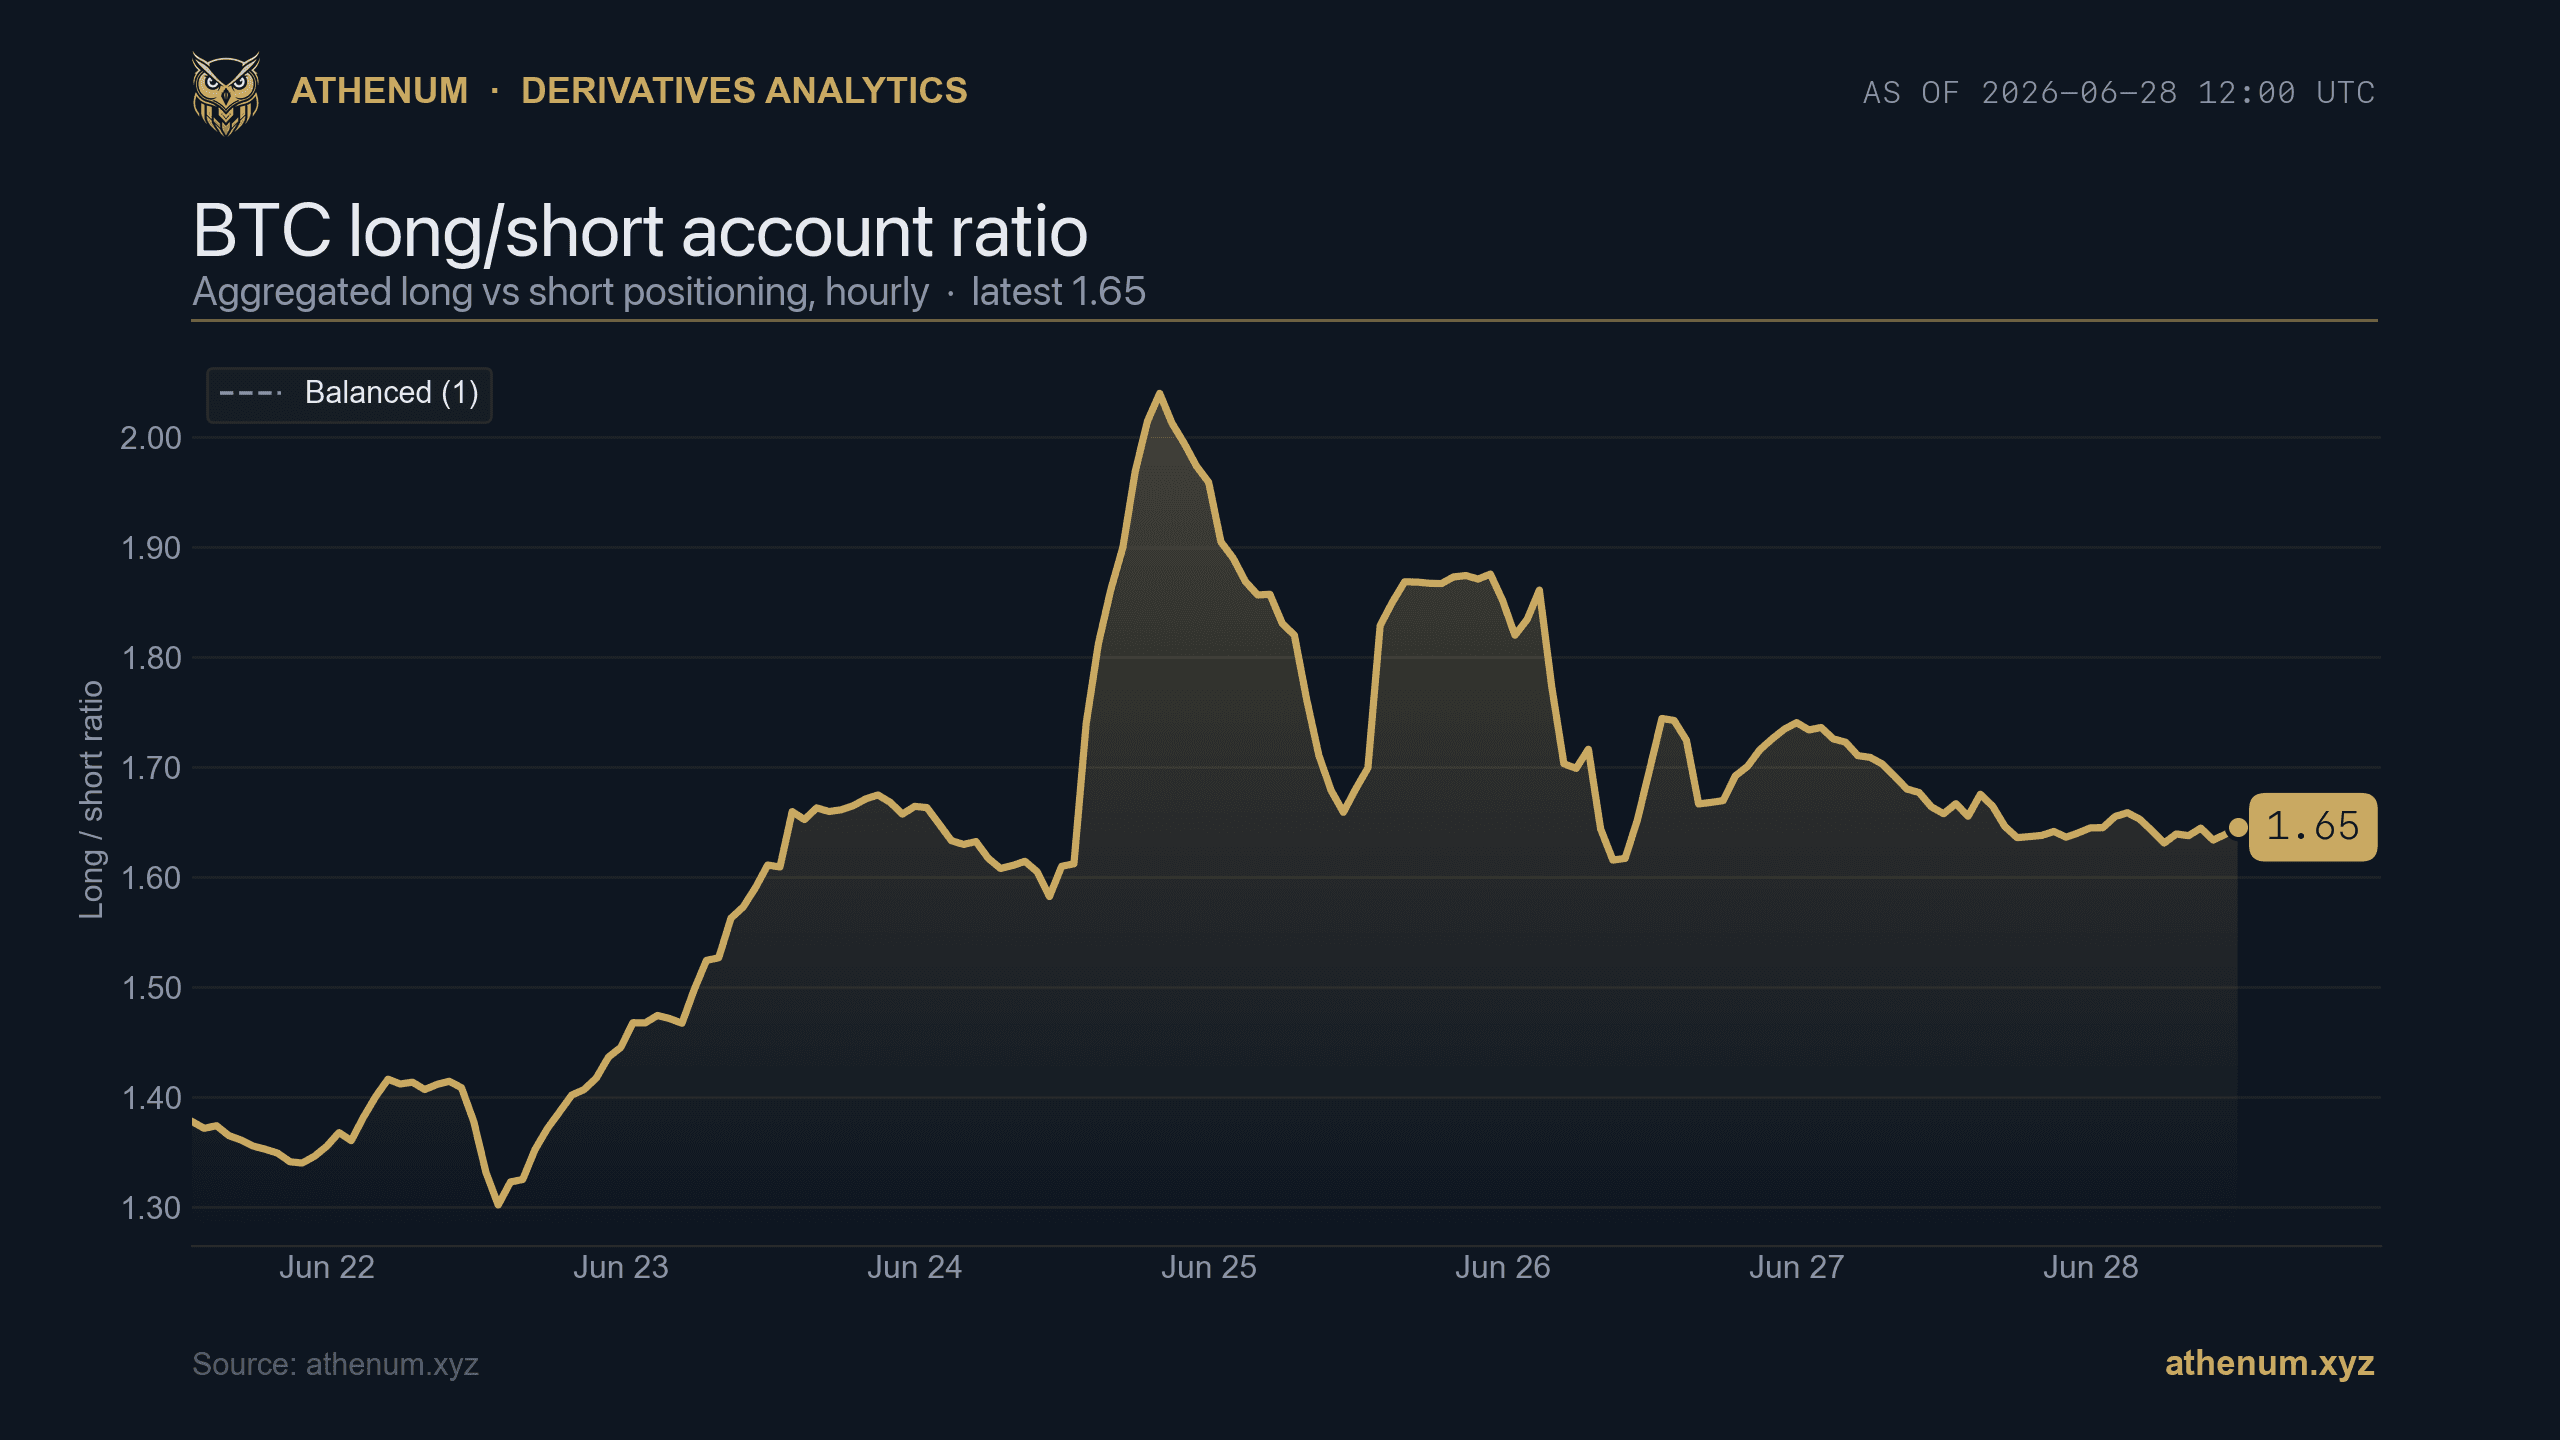
TLDR: The long/short ratio tells you which way the crowd is positioned, open interest tells you how much leverage is on the table, and funding tells you what that positioning costs. On Athenum the BTC long/short account ratio was 1.65 on 2026-06-28 12:00 UTC, meaning roughly 1.65 long accounts for every short, down from a crowded peak near 2.04 on 2026-06-25. Aggregated futures open interest was $16.6B the same minute, mid-range for the week, and perpetual funding was a mild +0.79% annualized on 2026-06-28 08:00 UTC, so longs were paying only a little to hold the position. A net-long crowd that is paying to stay long is the classic setup to watch, because crowded longs are the fuel for a long squeeze. This is education only, not a buy or sell call.
Positioning data answers a different question than price. Price tells you where the market is; positioning tells you how it got there and how fragile that is. Three numbers cover most of it: the long/short ratio for direction, open interest for how much leverage is committed, and funding for what that leverage costs. Read alone, each misleads. Read together, they tell you whether a move is backed by fresh conviction or by a crowd that is one shock away from being squeezed.
Here is what each number means, why the three belong together, and how to read crowd positioning without overreading it.
What is the long/short account ratio?
It is the number of accounts (or the share of positioning) on the long side divided by the number on the short side, so a ratio above 1 means more longs than shorts and below 1 means more shorts. On 2026-06-28 12:00 UTC the BTC long/short account ratio was 1.65, about 1.65 longs for every short, a net-long crowd but well off the crowded reading near 2.04 it printed on 2026-06-25. The level matters less than the extreme: a ratio stretched far above 1 means the crowd is heavily one-sided, and one-sided crowds are exactly what violent reversals feed on. Read it as a contrarian-leaning gauge, not a trend signal.
Why does open interest matter alongside it?

Athenum, aggregated BTC futures open interest at $16.6B on 2026-06-28 12:00 UTC, mid-range for the week. Open interest is how much leverage is committed, the size of the fuel tank for a squeeze. athenum.xyz
Open interest is the total value of futures contracts outstanding, which is a direct measure of how much leverage is committed to the market. A high long/short ratio on thin open interest is a small crowd leaning one way; the same ratio on heavy open interest is a large, leveraged crowd, and that is far more combustible. Aggregated BTC futures open interest was $16.6B on 2026-06-28 12:00 UTC, holding a $16.2B to $17.0B band across the week, so the leverage on the book was steady rather than building or unwinding. Rising open interest into a price move means new money and fresh positions; falling open interest means positions are closing. Pair it with the long/short ratio and you know both which way the crowd leans and how much size is behind it.
What does funding add to the picture?

Athenum, BTC perpetual funding at a mild +0.79% annualized on 2026-06-28 08:00 UTC, with this contract's own open interest at $2.71B. Positive funding means longs pay shorts to hold the position. athenum.xyz
Funding is the periodic payment that ties a perpetual future to spot: when funding is positive, longs pay shorts, and when it is negative, shorts pay longs. It is the running cost of the crowd's positioning. On 2026-06-28 08:00 UTC perpetual funding was a mild +0.79% annualized, so the net-long crowd was paying only a little to hold its lean, against this contract's own open interest of $2.71B. That combination, a net-long ratio of 1.65 with only mildly positive funding, is a crowd that is leaning long but not yet paying a punishing premium for it. The dangerous setup is a stretched long ratio plus expensive positive funding plus rising open interest, which is a crowded, costly, heavily leveraged long book primed to cascade if price slips.
Long/short ratio, open interest and funding: side by side
Signal | What it measures | Latest read |
|---|---|---|
Long/short account ratio | Which way the crowd is positioned | 1.65 (2026-06-28 12:00 UTC) |
Aggregated open interest | How much leverage is committed | $16.6B (2026-06-28 12:00 UTC) |
Perpetual funding | What that positioning costs | +0.79% annualized (2026-06-28 08:00 UTC) |
The three answer different questions and only mean something together. A high ratio is harmless if open interest is thin and funding is flat; it is dangerous when open interest is heavy and funding is expensive, because then the crowd is large, leveraged and paying to stay, the exact fuel a liquidation cascade burns. On these readings the crowd was net long at 1.65 but leverage was steady at $16.6B and funding was cheap at +0.79%, a leaning book rather than a stretched one.
How do you read crowd positioning in practice?
Read the long/short ratio for the lean, open interest for the size of the leverage, and funding for the cost, then ask whether all three are stretched in the same direction. One-sided positioning is only combustible when it is large and expensive; a mild lean on steady open interest and cheap funding is just a market with a tilt. Treat extremes as a warning that a reversal would be violent, never as a timing signal on their own, and confirm with price and the order book before acting.
You can read the long/short ratio, open interest and funding together, with the rest of the 28 free tools, no login required, at athenum.xyz/tools. Put a funding number on your own size with the free funding rate calculator, and for the composite funding read across venues see the OI-weighted funding rate. Athenum aggregates derivatives data across 14 exchanges, so positioning, leverage and cost sit in one view. Want the full terminal? Start a free 7-day Pro+ trial, no card required.
The short version
The long/short ratio shows the crowd's lean, open interest shows how much leverage is behind it, and funding shows what it costs. On 2026-06-28 the BTC ratio was net long at 1.65, down from a crowded 2.04 on 2026-06-25, open interest was steady at $16.6B, and funding was a cheap +0.79% annualized. Read the three together: a one-sided crowd only becomes dangerous when leverage is heavy and funding is expensive. Use positioning as a fragility gauge, not a timing tool. Education only, not investment advice.
One terminal. All the data.
Liquidations, orderbook depth, whale walls & open interest from 4 exchanges, all real-time, in one place.
No credit card required

Athenum Analytics
Athenum Analytics is our three-person editorial team covering crypto derivatives, market data and macroeconomic context.