Table of Contents4 sections
Practise with worked lessons
- OI-weighted funding: separate rate changes from changing weights
Both venue rates fell, yet the OI-weighted index rose 1.4 basis points. Separate the rate effect from the weight effect on a consistent venue panel.
An open-interest-weighted funding rate is a summary of selected perpetual contracts. Each comparable rate receives the weight of that contract's USD notional open interest. It is not the rate charged on your position, a measure of net long positions, or a forecast of the next price move.
This is the methodology guide. The separate 27 June 2026 snapshot note examines what the earlier Athenum display did and did not establish.
Specify the inputs before calculating
For each observation, retain the venue, exact contract, timestamp, funding rate, interval and whether the rate is an estimate or an actual settlement. Include the OI unit and its conversion to USD. A contract count, base-asset quantity and USD notional cannot be added directly. Linear and inverse contracts can require different conversions.
Use observations aligned to the same cutoff and a disclosed venue universe. If a required rate or OI value is missing, omit that pair and disclose the resulting coverage; do not give a missing observation a zero rate. Do not mix an estimate for the next payment with a settled payment in one composite.
Calculation
Let OI(i) be USD notional and r(i) a rate for an interval of h(i) hours. For a simple common eight-hour comparison, set r8(i) = r(i) × 8 / h(i), w(i) = OI(i) / sum(OI), and F8 = sum(w(i) × r8(i)). This scales a rate; it does not recreate eight actual hourly payments. A realized eight-hour series requires the actual settlements within that period.
A purely illustrative example uses two comparable eight-hour contracts: $100 million at −0.10% and $500 million at +0.05%. Their equal-weighted mean is −0.025%; their OI-weighted mean is +0.025%. These are invented scenario inputs for explaining arithmetic, not market observations. The sign changes because the weighting question changes. Neither average “lies.”
Interpretation and annualization
Positive funding usually means longs pay shorts under the contract's rules. OI counts open contracts, each with a long and a short side; weighting does not prove that a venue is net bullish. A simple annualized eight-hour rate multiplies by 1,095. It assumes the rate persists, ignores compounding and costs, and is not an expected return.
Check venue concentration, omitted instruments and stale OI. Weight changes can move the composite even when each venue's funding is unchanged. Stablecoin depegs and the price used to convert base-asset OI also affect comparability.
Inspect the observations
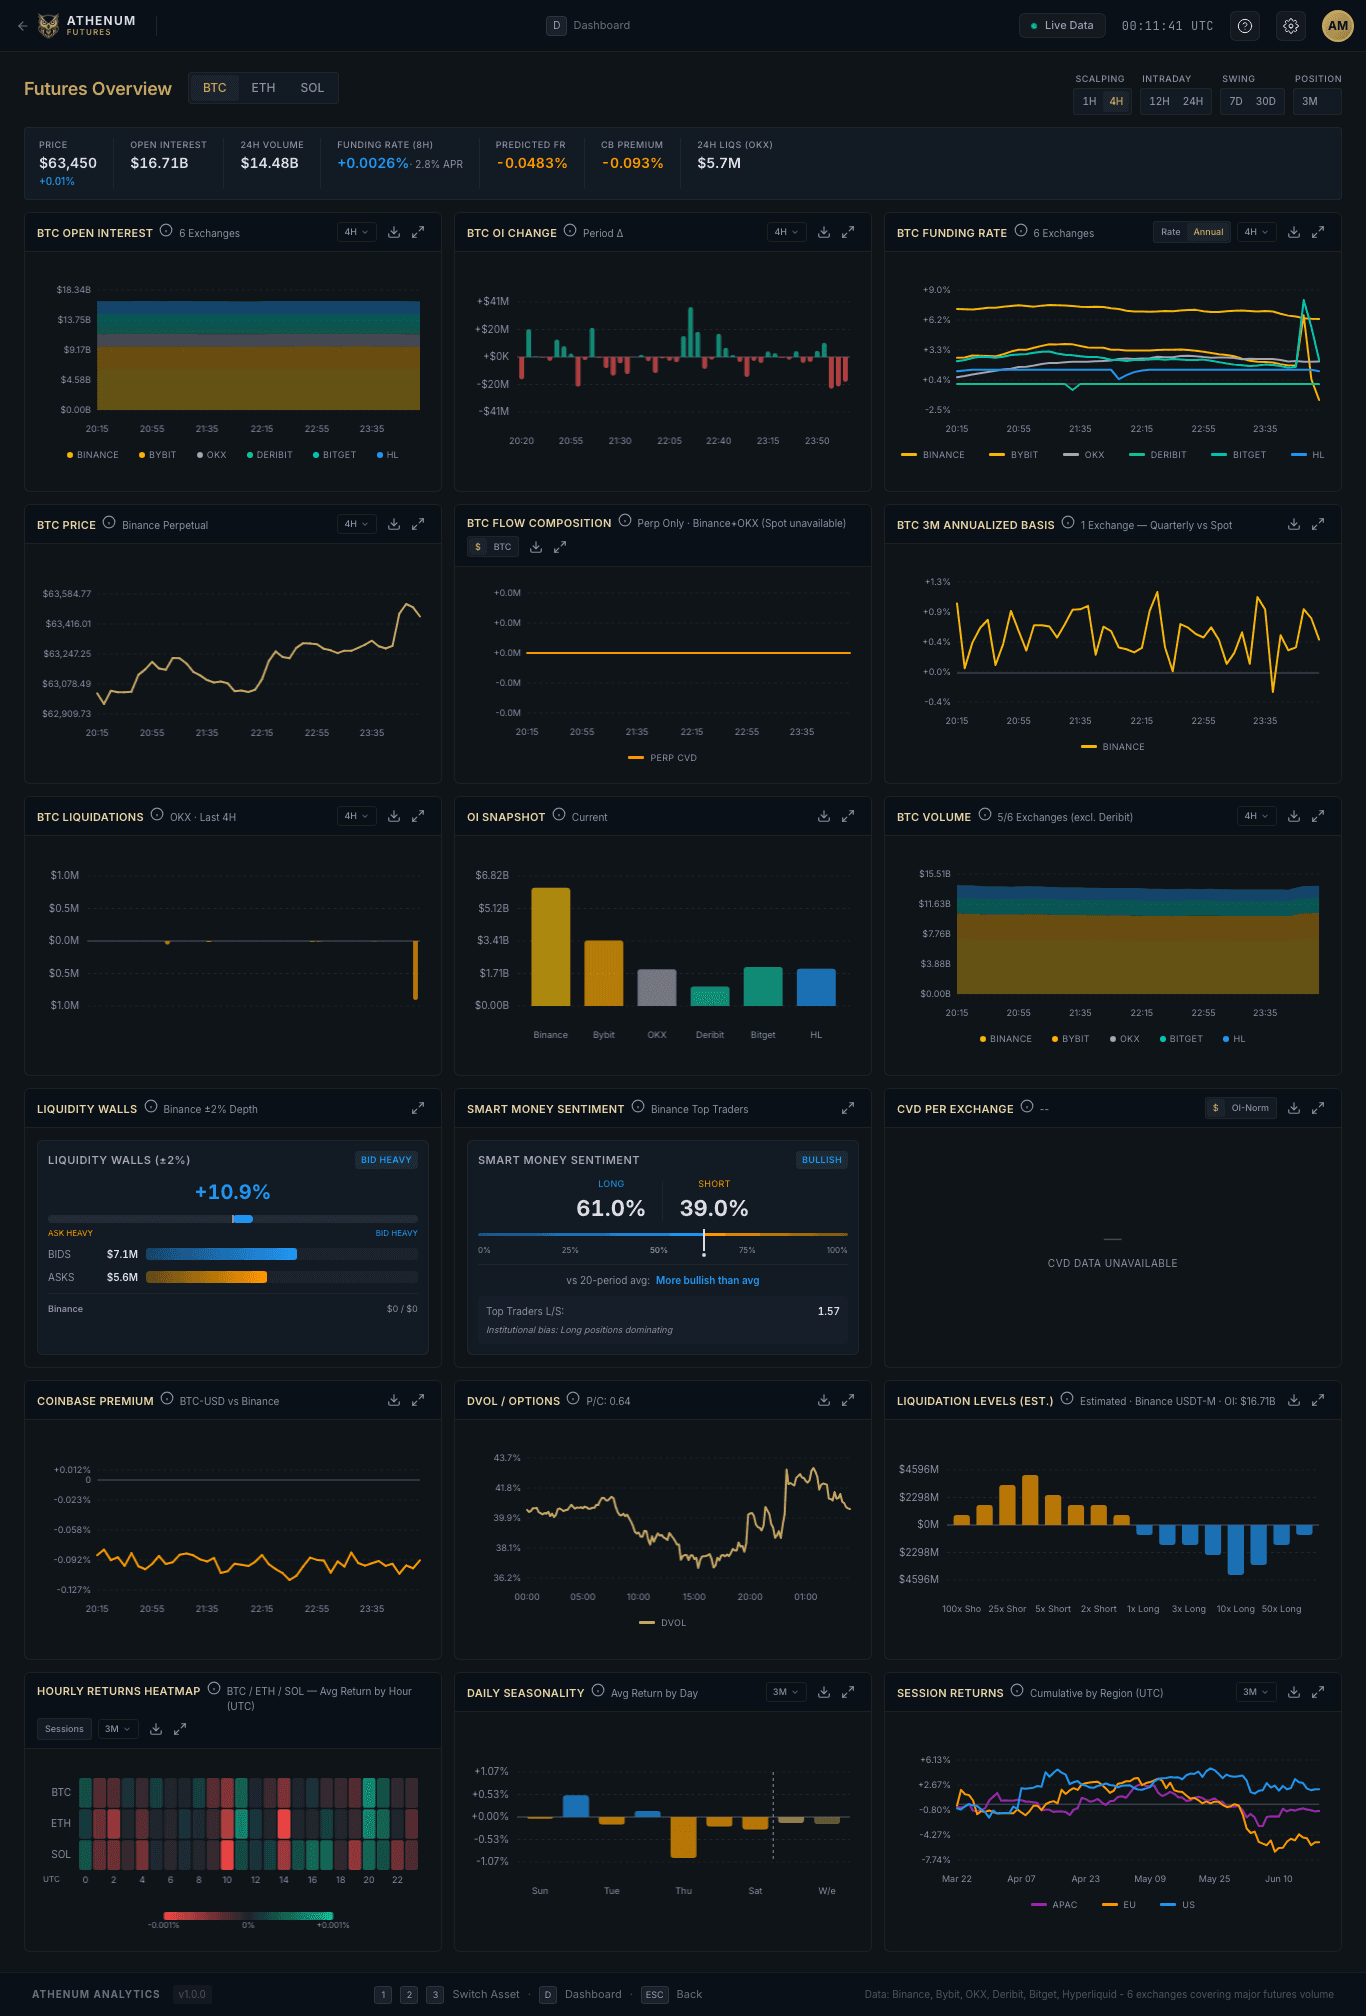
Bitcoin funding and Ethereum funding expose dated settlements separately from indicative readings. Their charts normalize the displayed interval; they do not claim a market-wide weighted composite. Bitcoin OI lists contract types and conversions.
Sources: Binance funding history, Bybit funding history, Hyperliquid funding. Methodology revised 24 September 2026.
One terminal. All the data.
Liquidations, orderbook depth, whale walls & open interest from 4 exchanges, all real-time, in one place.
No credit card required

Athenum Analytics
Athenum Analytics is our three-person editorial team covering crypto derivatives, market data and macroeconomic context.