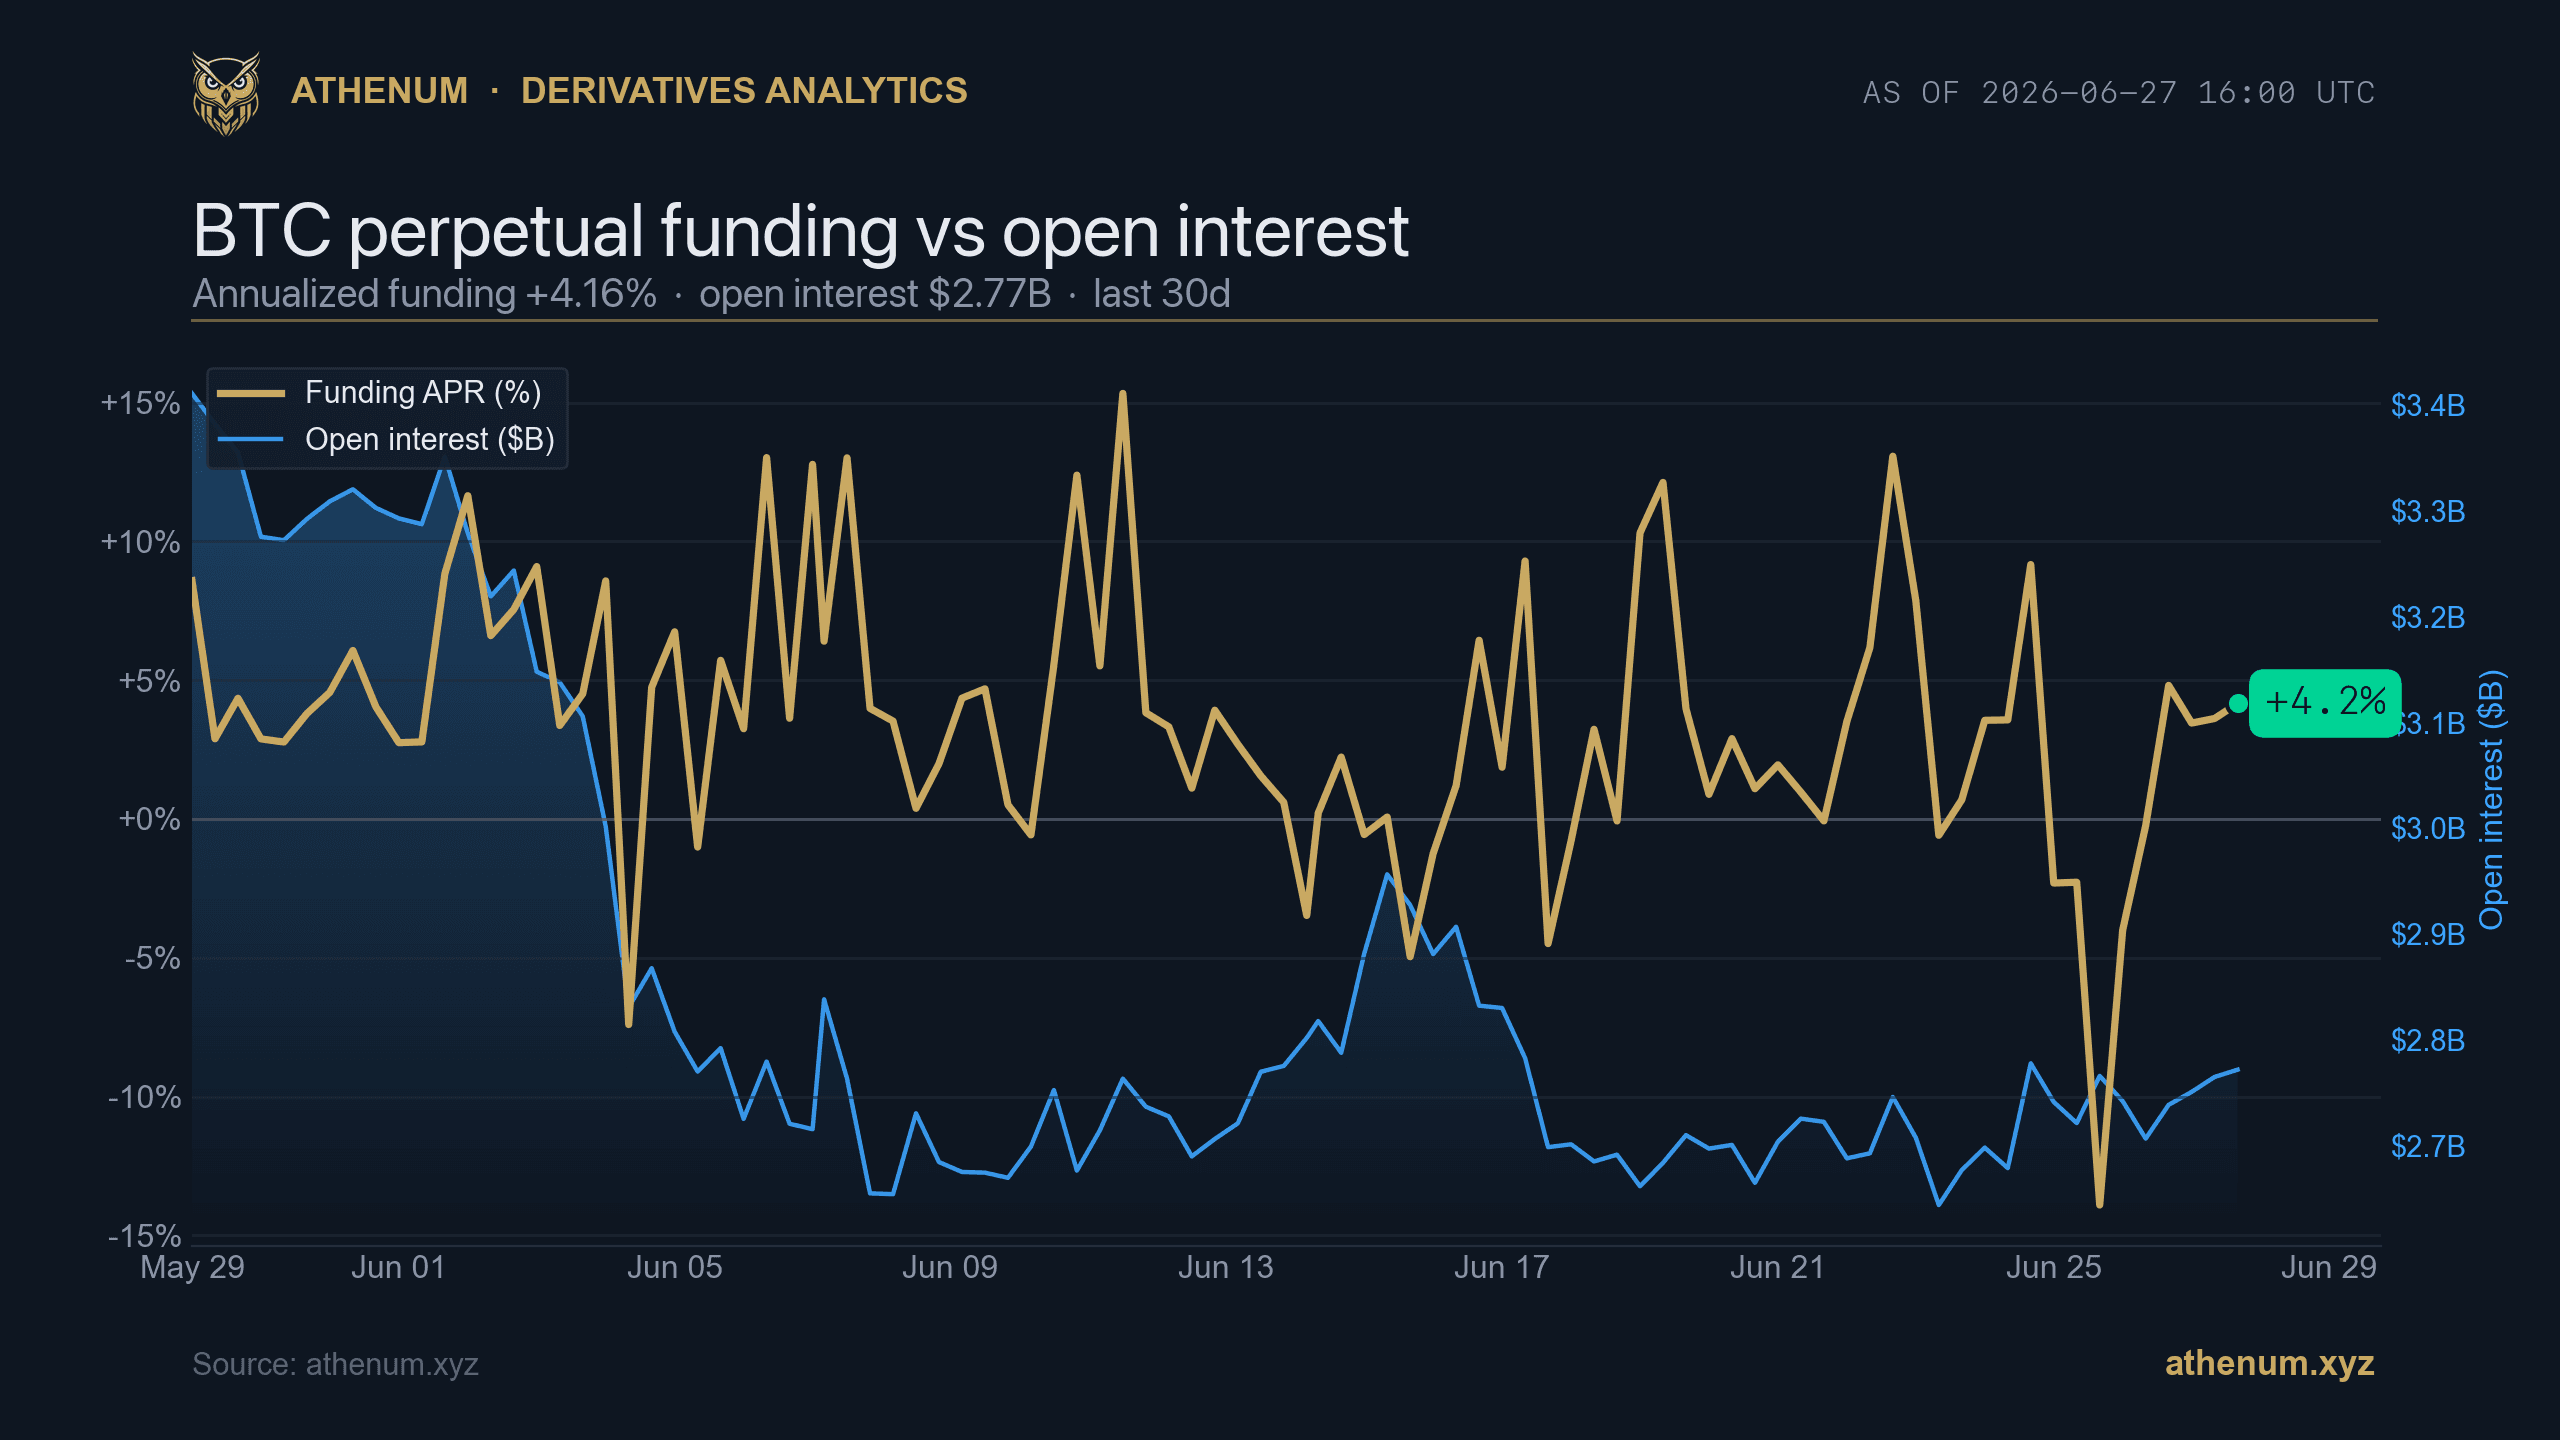
Athenum chart titled BTC perpetual funding versus open interest, annualized funding plus 4.16 percent and open interest 2.77 billion dollars as of 2026-06-27 16:00 UTC, last 30 days

OI-Weighted Funding Rate: Reading One Honest Number Instead of an Average That Lies

Athenum Analytics
Athenum Analytics
7 min read

TLDR: A simple average of perpetual funding rates across exchanges can point the wrong way, because it gives a near-empty venue the same vote as the deepest book. The open-interest-weighted funding rate fixes that: it weights each venue's funding by that venue's share of open interest, so the deepest book dominates the composite. On the Athenum futures panel at 2026-06-27 23:37 UTC, BTC per-venue annualized funding ran from about +8% on OKX and Bitget down to roughly -6% on Bybit, while the 8-hour composite read +0.0024% (about 2.7% annualized) against $16.50B of open interest across six exchanges. That spread between venues is exactly what a single number hides and open-interest weighting recovers.

Funding rate is the periodic payment that keeps a perpetual future tethered to spot. Read it from one exchange and you see one crowd. Read it as a simple average across many exchanges and you can be misled a different way: a thin venue with an extreme rate drags the mean around even though almost no money is positioned there. The open-interest-weighted funding rate turns a noisy set of venue rates into one number that reflects where capital actually sits. The 30-day chart at the top of this post makes the point visually: it tracks a single BTC perpetual whose funding recently annualized near +4.16% against \$2.77B of its own open interest, already above the cross-venue composite below, which is the gap weighting is built to capture.

This is one metric, read one way. Below is what it is, why the weighting matters, the exact methodology, and where to check it live.

What is the OI-weighted funding rate?

It is the average of every venue's perpetual funding rate, weighted by that venue's open interest rather than counted equally. Each exchange's weight equals its open interest divided by the total open interest across the venue set, so a venue holding most of the market's leveraged positioning moves the composite most, and a venue holding almost none barely moves it at all. The result is a single funding number that represents where the bulk of leveraged capital is actually paying or receiving, instead of an unweighted mean in which a near-empty venue counts the same as the deepest book in the market.

Why does a simple average of funding rates lie?

Athenum BTC funding rate panel, 5 of 6 exchanges, annualized, showing per-venue funding from about +8% on OKX and Bitget to roughly -6% on Bybit at 2026-06-27 23:37 UTC

Athenum, BTC perpetual funding by exchange (annualized, 5 of 6 venues, Deribit excluded). Venue funding ranged from about +8% to about -6% while the 8H composite read +0.0024%, about 2.7% APR. Captured 2026-06-27 23:37 UTC. athenum.xyz

Because an unweighted mean treats every venue as equally important, and venues are not equally important. The panel above is a live example: at 2026-06-27 23:37 UTC, BTC annualized funding sat near +8% on OKX and Bitget but around -6% on Bybit, a spread of roughly fourteen points across venues. A plain average of those venue rates would land somewhere in the middle and tell you almost nothing about where the money is.

Consider two exchanges. Venue A carries $100M of open interest at -0.10% funding. Venue B carries $500M of open interest at +0.05% funding. The simple average is (-0.10% + 0.05%) / 2 = -0.025%, which reads bearish. But five times as much capital sits on the bullish side. Weight by open interest and you get (100 x -0.10% + 500 x +0.05%) / 600 = +0.025%, which reads bullish, and that is the honest read because the deep book dominates real positioning. The sign literally flips when you account for where the money is. That single flipped sign is the whole reason this metric exists.

How is the OI-weighted funding rate calculated?

A four-step methodology, applied across the venue set at each funding settlement:

1. Pull each venue's current perpetual funding rate, normalized to the same interval. Most venues settle funding three times a day, at 00:00, 08:00, and 16:00 UTC, so 8-hour funding is the natural common unit. 2. Pull each venue's open interest in USD terms for the same contract, so coin-margined and stablecoin-margined books are compared on one scale. 3. Compute each venue's weight as its open interest divided by the total open interest across the set. The weights sum to 1. 4. Sum each venue's funding rate multiplied by its weight. That weighted sum is the composite open-interest-weighted funding rate.

To read it as an annual figure, multiply the 8-hour rate by 3 settlements per day and 365 days, so the annualization factor is 1,095. A 0.01% 8-hour rate is about 10.95% annualized, and the +0.0024% composite on the panel above annualizes to roughly 2.7%, which matches the figure Athenum prints next to it.

OI-weighted vs simple-average funding: side by side

Property

Simple average

OI-weighted

Venue weight

Every venue counts equally

Weight = venue OI / total OI

Thin-venue distortion

High: an outlier rate drags the mean

Low: a near-empty venue barely moves it

Reflects real positioning

No: ignores where capital sits

Yes: the deepest book dominates

Can the sign flip vs the other method

Yes, see the worked example

Yes, see the worked example

Best used for

Spotting venue dispersion

One composite read of leveraged bias

The two methods are complements, not rivals. The OI-weighted number tells you the market's net leveraged lean in one honest figure; the venue spread, which the panel still shows, tells you how fragmented and stressed that positioning is. With the composite near +0.0024% per 8 hours but venues running from about +8% to about -6% annualized, the market was only marginally long on a weighted basis even though some books were paying shorts hard. Both readings matter, and they answer different questions.

How do you read it in practice?

Athenum chart: ETH perpetual funding versus open interest over 30 days, annualized funding -1.26% and open interest $1.47B as of 2026-06-27 16:00 UTC

Athenum, ETH perpetual funding vs open interest. ETH annualized funding was negative at -1.26% with $1.47B open interest on 2026-06-27 16:00 UTC, so on net shorts were paying longs. athenum.xyz

A persistently positive OI-weighted rate means leverage is net long and paying to hold that lean, so the deepest books are crowded on the long side and a sharp move down can force them out first. A persistently negative composite is the mirror image: shorts are paying, as ETH showed on 2026-06-27 with funding at -1.26% annualized while $1.47B of open interest stayed open. A composite near zero with a wide venue spread, the BTC case above, is the most informative of all: net positioning is flat but fragmented, which historically precedes the disorderly moves that start on whichever venue is most lopsided. Read the composite for direction and the spread for fragility. Neither is a buy or sell signal on its own; both are inputs to how crowded and how fragile current positioning is.

You can compute a funding figure for your own size and venue with the free Athenum funding-rate calculator. It is one of the 28 free tools on the platform, no login required, and the funding read above comes from six of the 14 exchanges Athenum aggregates: Binance, Bybit, OKX, Deribit, Bitget, and Hyperliquid on the futures funding panel. Want the full terminal? Start a free 7-day Pro+ trial, no card required.

The short version

The open-interest-weighted funding rate is the single number that answers "which way is leverage actually leaning" without letting a thin venue cast an oversized vote. Build it in four steps, read the composite for direction and the venue spread for fragility, and check it live rather than trusting one exchange's rate or a misleading flat mean.

Juggling CoinGlass, Hyblock & TradingLite tabs
Paying $100+/mo across fragmented tools
Stale data you can’t trust for entries

One terminal. All the data.

Liquidations, orderbook depth, whale walls & open interest from 4 exchanges, all real-time, in one place.

100+ pairs tracked live
Try It Free

No credit card required

Athenum Analytics
Author

Athenum Analytics

Wisdom Over Chaos