Table of Contents5 sections
- What is open interest, and why does the exchange it sits on matter?
- Where does BTC perpetual open interest actually sit today?
- Does every coin concentrate the same way?
- Is a market with concentrated open interest more fragile, and how does the total move?
- How do you read open-interest distribution yourself?
Practise with worked lessons
- Open interest data gaps: compare a consistent venue panel
Separate real open interest changes from missing, stale or restored venue data. Reconcile visible totals against the same exchange panel at each timestamp.
TLDR. Open interest by exchange is the missing half of the headline number. The aggregate tells you how much leveraged money is committed to a contract, but breaking open interest down by exchange tells you where that money actually sits, which is what decides how a market behaves under stress. As of 2026-07-12, aggregate Bitcoin perpetual open interest across the 14 exchanges Athenum tracks is about $17.4B, and it is highly concentrated: Binance alone holds 37.1% of it, and the top three venues (Binance, Bybit, and Hyperliquid) hold 70.9% between them. Ether concentrates even harder on the leader, with Binance at 41.7% of a roughly $9.9B ETH perpetual pool. Reading open interest by exchange, not just the headline total, tells you where a liquidation cascade would start and how broad a move really is.
What is open interest, and why does the exchange it sits on matter?
Open interest is the total value of derivatives contracts that are currently open and unsettled, so it measures committed leverage rather than activity. Volume tallies every contract traded and resets each day; open interest only changes when a position is opened or closed, so it is a running stock of how much money is exposed. A simple way to hold the difference: two traders can rack up millions in volume passing one contract back and forth, yet open interest barely moves, because no net new exposure was created. The headline figure is an aggregate across venues, and that is exactly what hides the risk: the same total can be spread evenly across a dozen exchanges or piled onto one, and those two markets behave very differently under stress. When open interest is concentrated on a single venue, that venue's funding, its liquidation engine, and its outages set the pace for everyone. Knowing the distribution, not just the sum, is what turns open interest from a trivia number into a positioning tool.
Where does BTC perpetual open interest actually sit today?
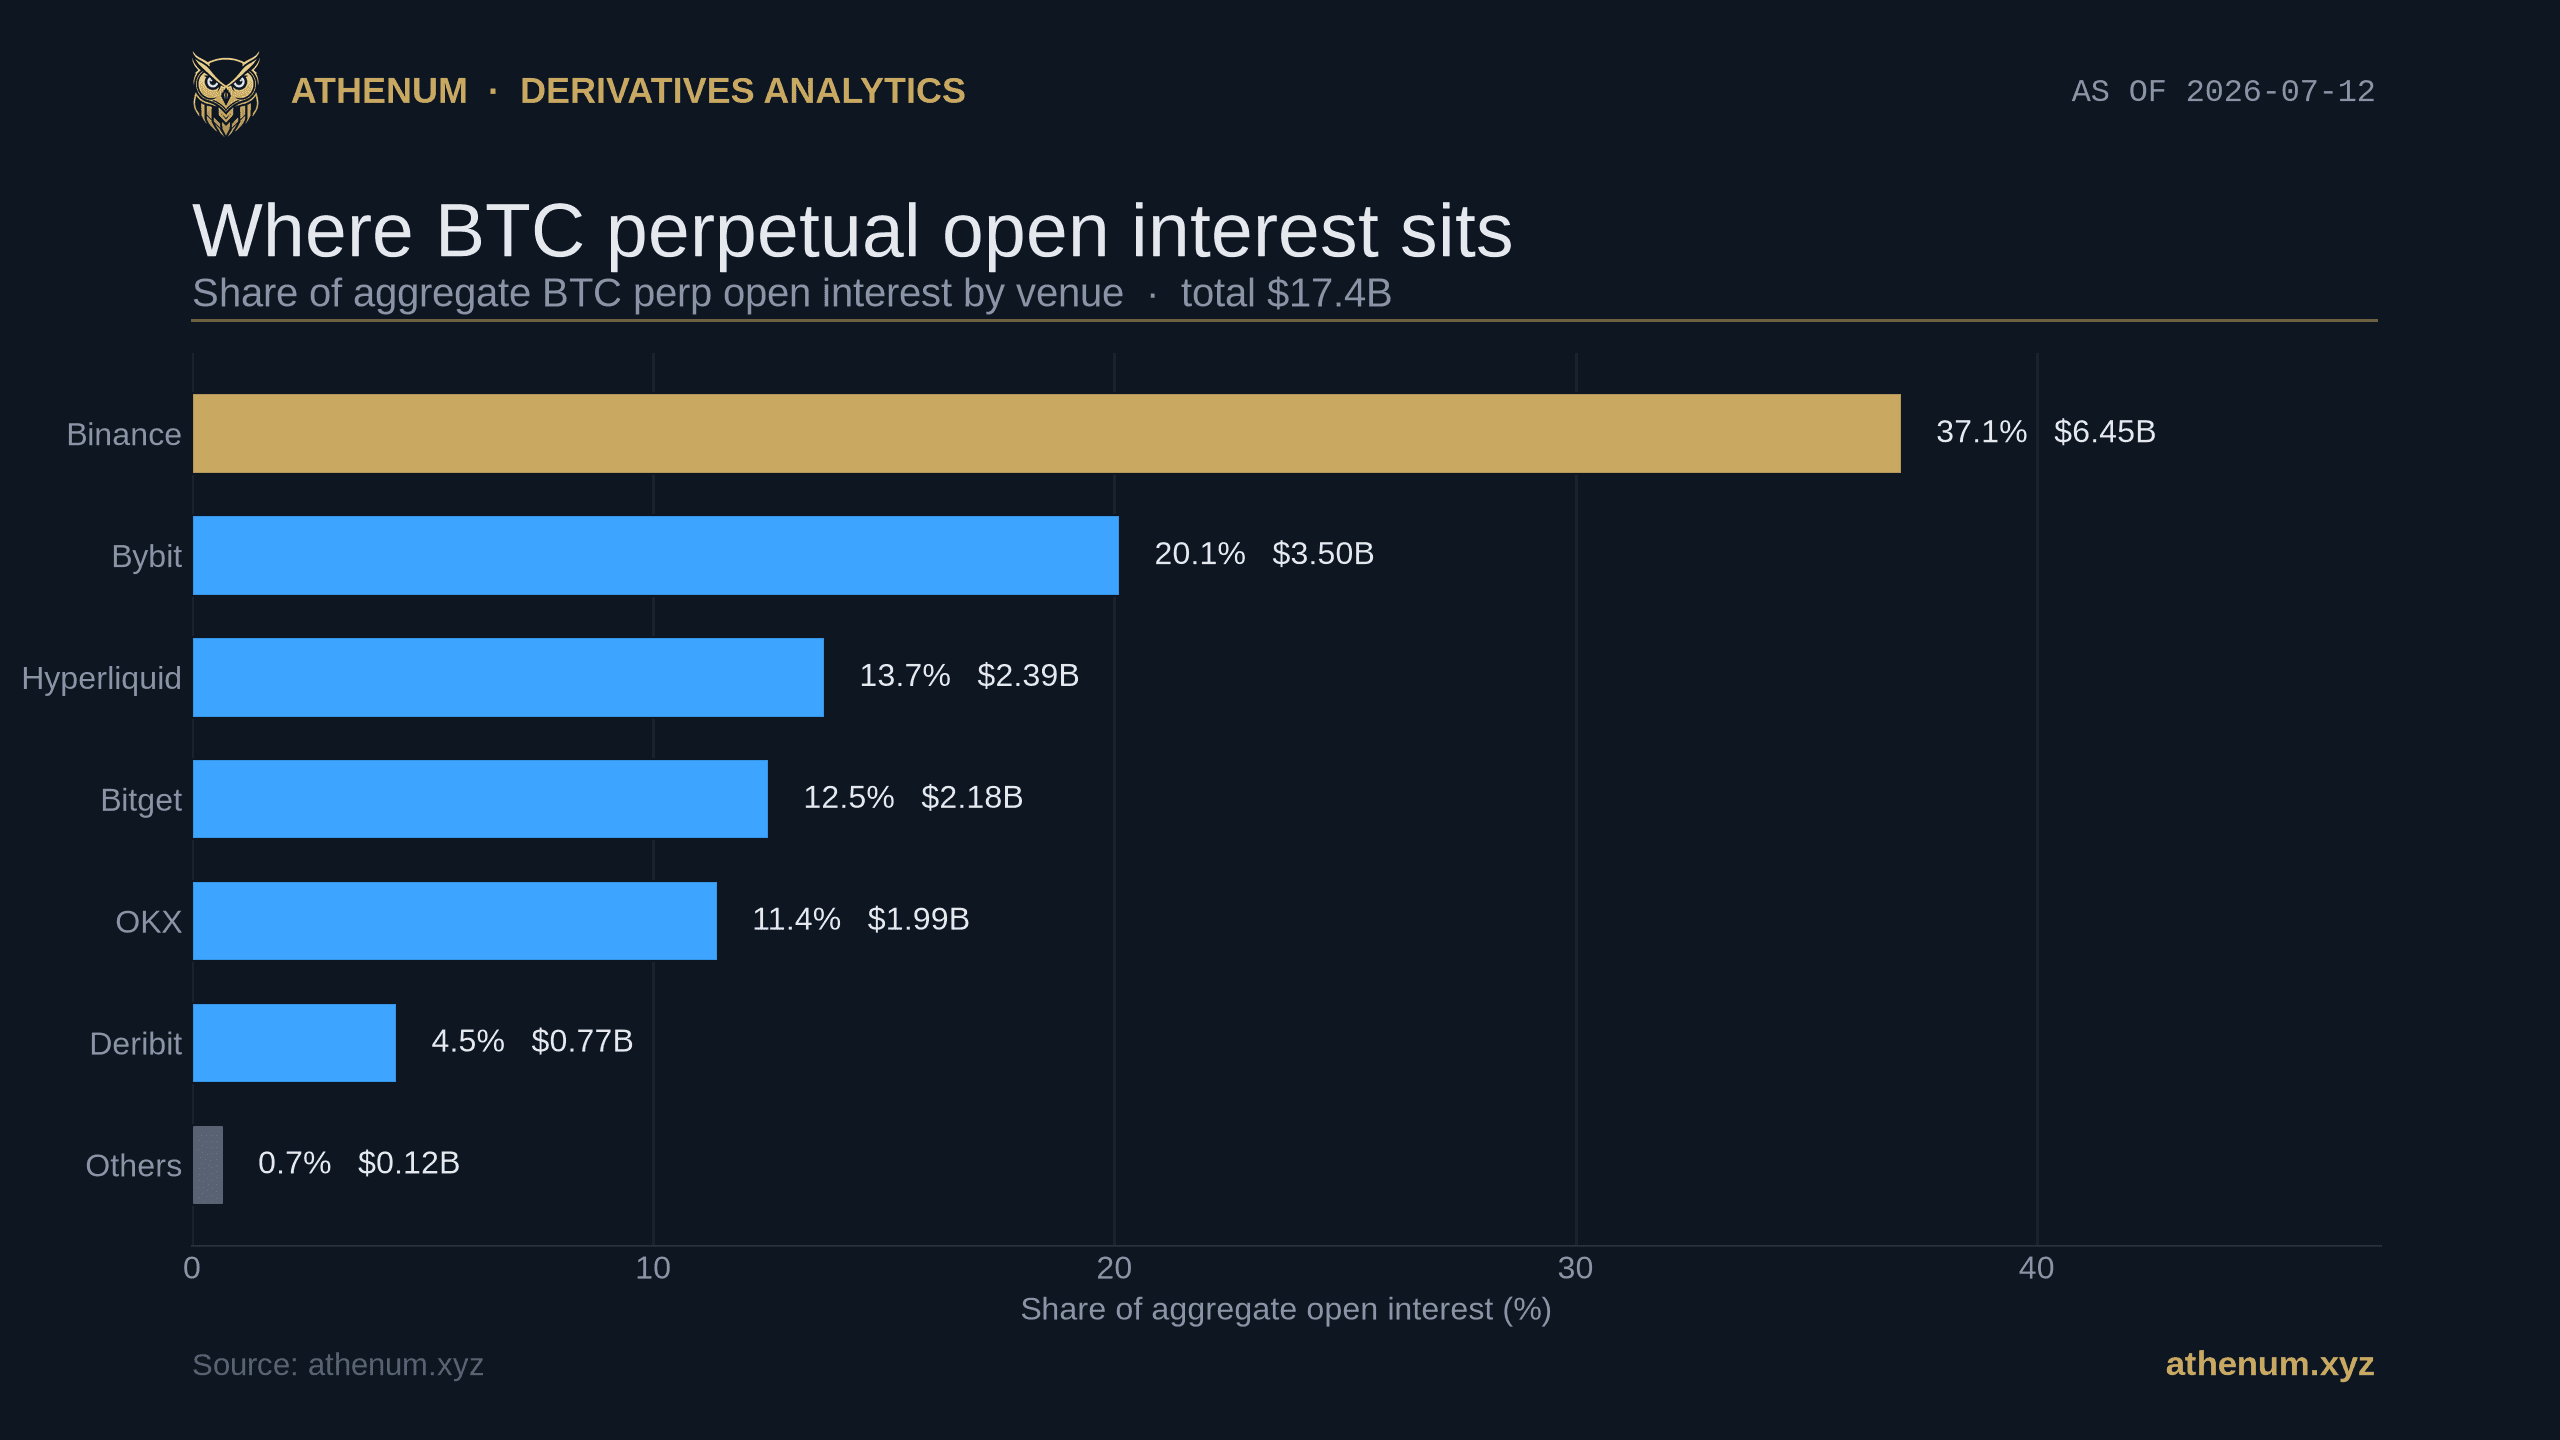
As of 2026-07-12, aggregate BTC perpetual open interest is about $17.4B, and it leans heavily on a handful of venues. Binance carries 37.1% of it (roughly $6.45B), Bybit is a clear second at 20.1% (about $3.50B), and the on-chain perpetual venue Hyperliquid holds 13.7% (about $2.39B). Bitget (12.5%) and OKX (11.4%) fill the middle, while Deribit, whose franchise is options rather than perpetuals, holds only 4.5%. The three largest venues together account for 70.9% of all BTC perpetual open interest, so the aggregate number you see quoted anywhere is really a Binance-and-Bybit number with a long tail attached. Every percentage here is a share of the 14-venue aggregate Athenum normalizes, so it measures how concentrated the tracked market is; the per-venue dollar figures line up with what single-exchange trackers report for the same day.

Six venues carry essentially all BTC perpetual open interest on 2026-07-12; Binance and Bybit alone are 57.2%.
Venue | Share of BTC perp OI (2026-07-12) | Open interest |
|---|---|---|
Binance | 37.1% | $6.45B |
Bybit | 20.1% | $3.50B |
Hyperliquid | 13.7% | $2.39B |
Bitget | 12.5% | $2.18B |
OKX | 11.4% | $1.99B |
Deribit | 4.5% | $0.77B |
Does every coin concentrate the same way?
No, and comparing two assets on the same date makes the point. On 2026-07-12 the roughly $9.9B Ether perpetual pool is even more top-heavy than Bitcoin: Binance holds 41.7% of ETH open interest versus 37.1% of BTC. The order underneath also reorders. Bybit is the number two venue for BTC at 20.1% but slips to 13.4% for ETH, while Hyperliquid actually carries a larger share of ETH open interest (14.6%) than of BTC (13.7%). Deribit shrinks to 2.8% on ETH, consistent with a venue whose open interest lives in options. The practical read: liquidity and leverage are venue-specific and asset-specific, so a funding print or a liquidation wick on one exchange does not carry the same weight for every coin.

Venue share of aggregate perp open interest, BTC vs ETH, 2026-07-12: Binance leads both but harder on ETH at 41.7%.
Is a market with concentrated open interest more fragile, and how does the total move?
Concentration matters because a liquidation cascade starts where the leverage is. When one venue holds more than a third of all open interest, a fast move through its liquidation levels forces that venue's engine to market-sell or market-buy into every other book at once, which is how a local wick becomes a cross-exchange cascade. The aggregate total is the second half of the picture: open interest is a stock, so it climbs as new leverage is added and falls when positions are closed or forced out. Over the past seven days aggregate BTC perpetual open interest has held between roughly $16.5B and $17.7B, sitting near $17.4B as of 2026-07-12, with two sharp intraday drops where crowded positioning was flushed. Each of those flushes stripped out a chunk of open interest in a short window before the total rebuilt, the kind of unwind a concentrated book tends to make faster and sharper. Rising price with rising open interest means new money is pressing the move; rising price with falling open interest means shorts are covering, which tends to be a weaker foundation.

Aggregate BTC perpetual open interest across the tracked venues, last seven days to 2026-07-12: a $16.5B to $17.7B band, latest $17.4B.
How do you read open-interest distribution yourself?
You can turn this into a repeatable check in four steps:
1. Start with the aggregate, then break it down. Note the total open interest, then look at each venue's share so you know whether the market is broad or perched on one book. 2. Watch the leader's share over time. If a single venue's slice of open interest keeps growing, the whole market is more exposed to that venue's funding, outages, and liquidation engine. 3. Pair distribution with the long/short ratio and open interest trend so you can tell whether rising open interest is new longs or new shorts, not just more leverage. 4. Cross-check the cost of that leverage with the OI-weighted funding rate, which weights each venue's funding by its open interest instead of taking a naive average that the smallest venues can distort.
To size a position against a concrete liquidation level rather than a feeling, the free position size calculator and funding rate calculator turn these numbers into an entry, a stop, and a carrying cost. Open interest tells you how crowded the trade is; those tools tell you how much of it you can actually afford to hold.
Concentrated open interest is not automatically bearish or bullish, but it always tells you where the fragility lives, and where a cascade would begin if price runs the wrong way. Athenum normalizes live derivatives data across 14 exchanges into one cross-exchange feed and keeps all 34 calculators free, with no account, no email, and no usage limits, so you can re-check every share above and open the live terminal whenever the distribution shifts.
One terminal. All the data.
Liquidations, orderbook depth, whale walls & open interest from 4 exchanges, all real-time, in one place.
No credit card required

Athenum Analytics
Athenum Analytics is our three-person editorial team covering crypto derivatives, market data and macroeconomic context.