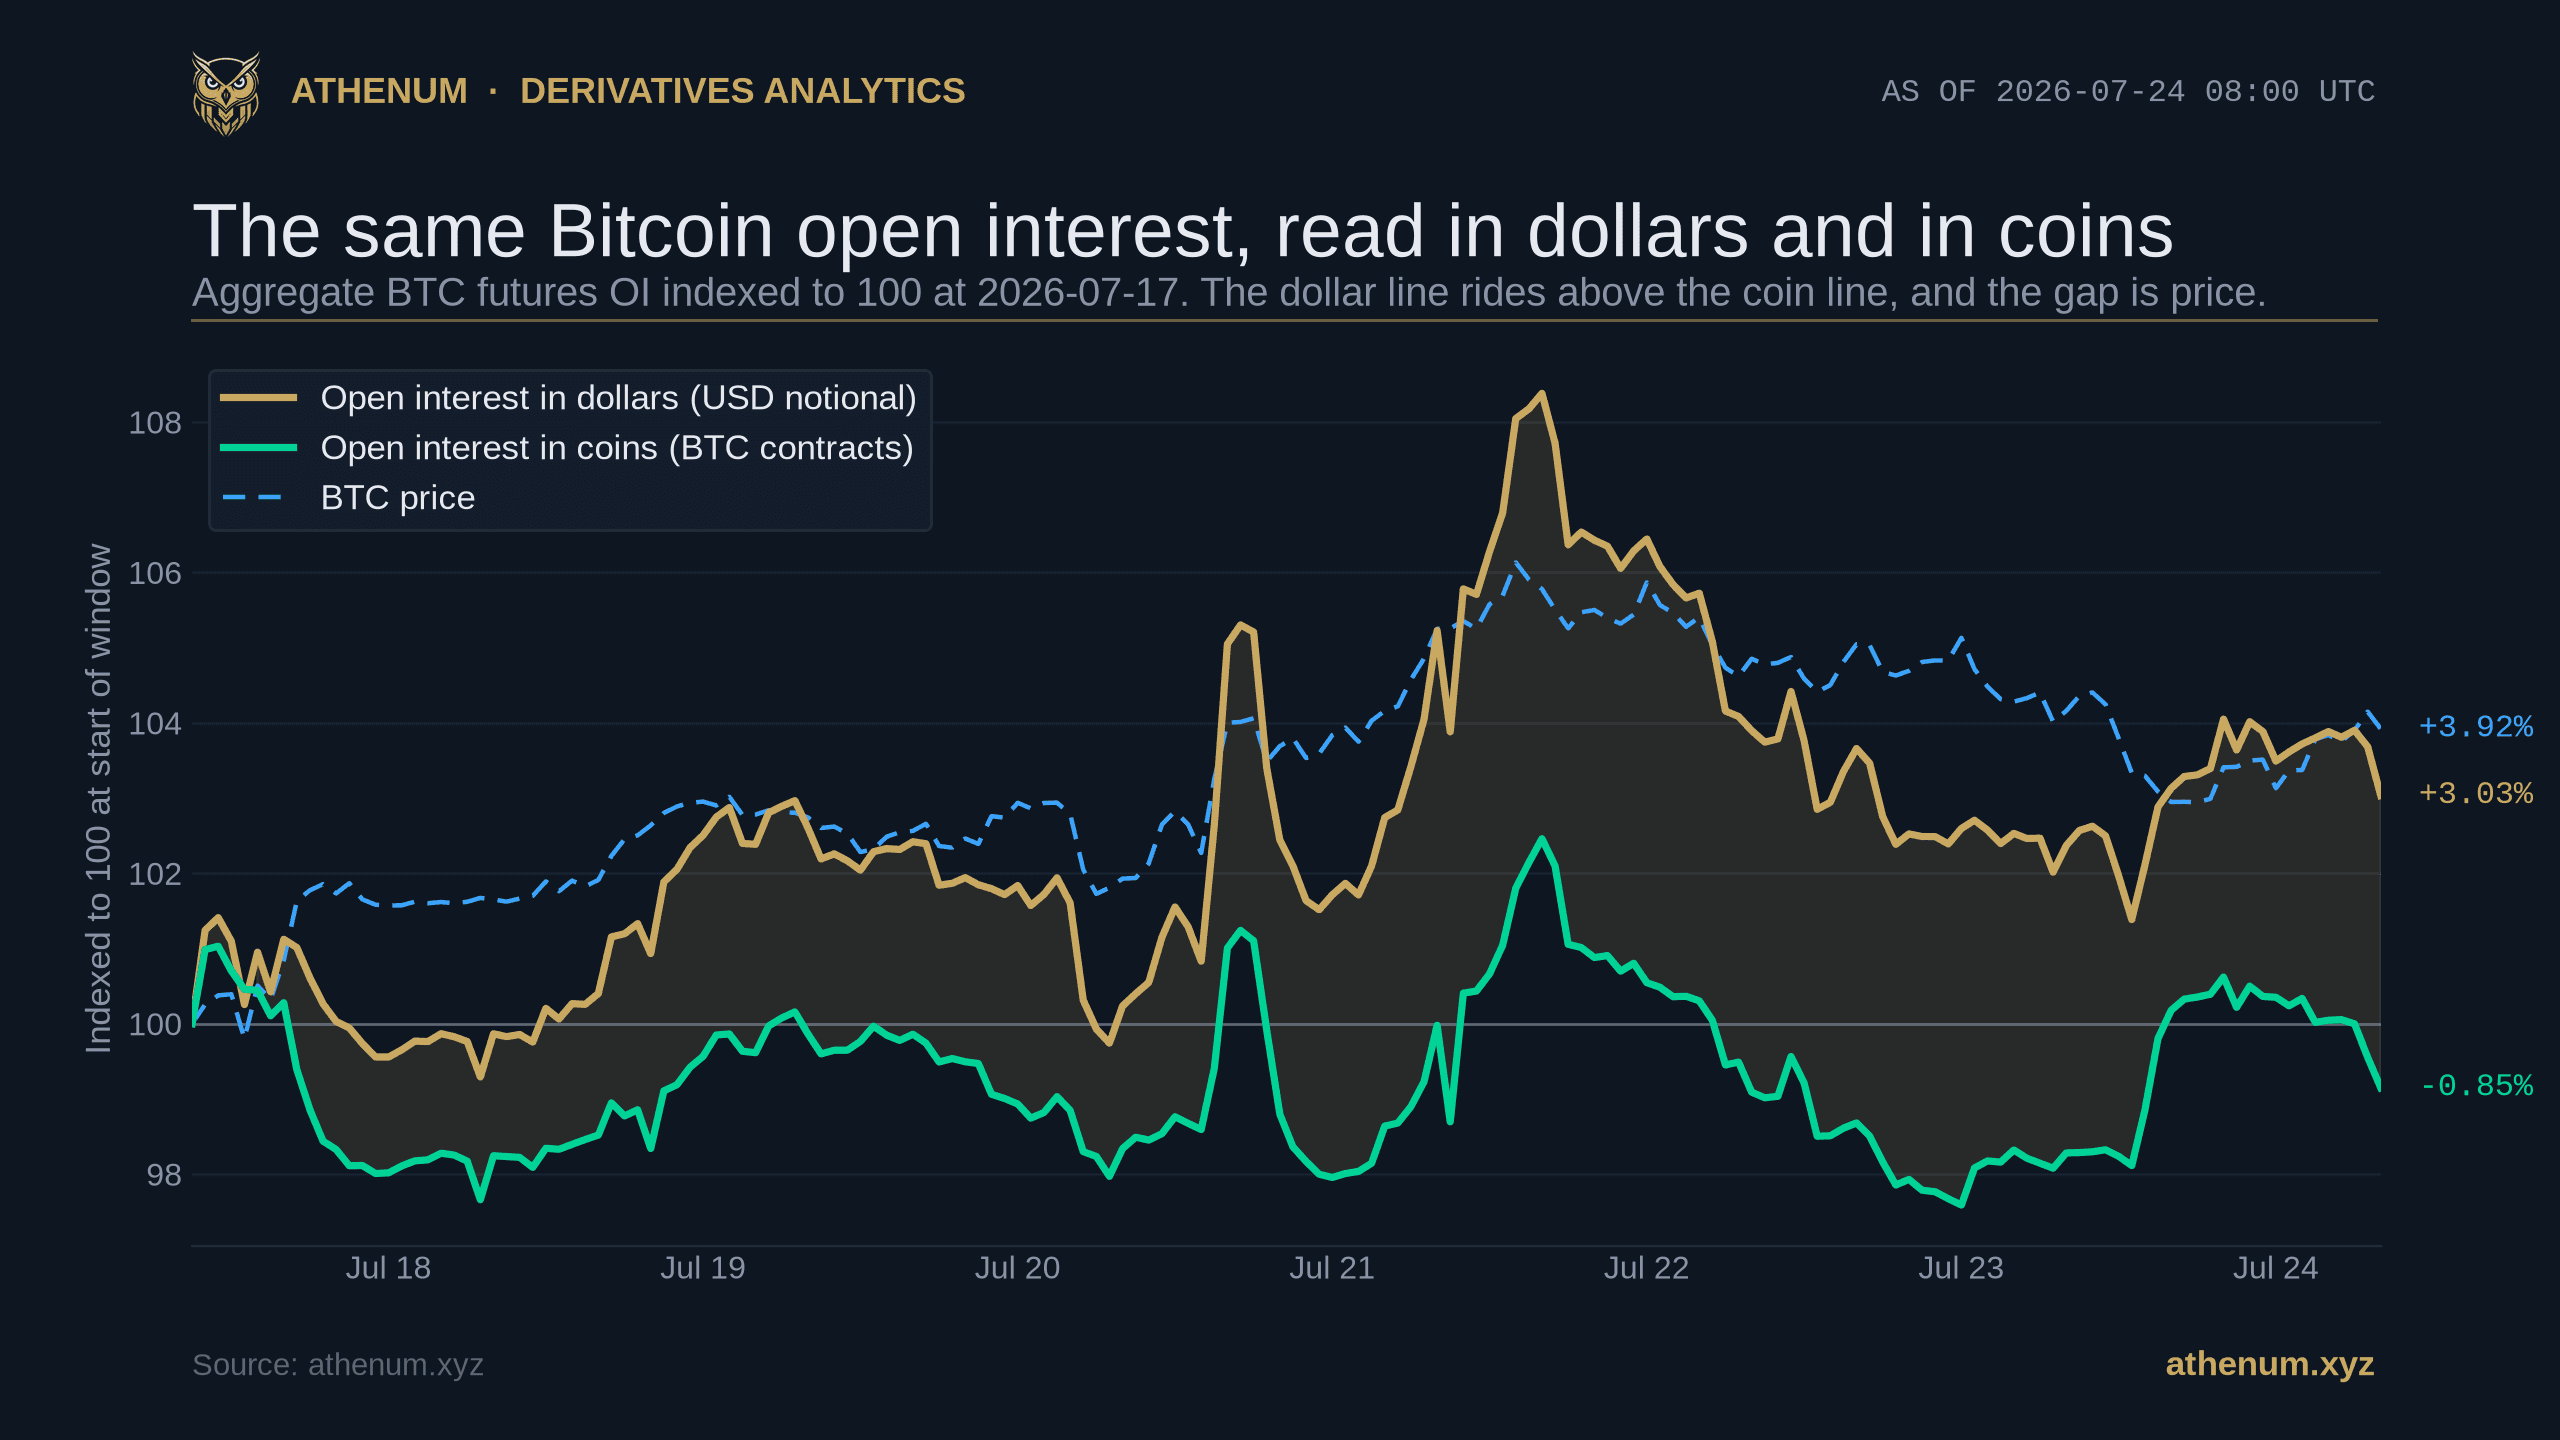
TLDR. Open interest is the number of derivative contracts still open, and exchanges quote it two ways: in coins (how many BTC of contracts are open) and in dollars (that coin figure multiplied by price). Because the dollar figure carries the price inside it, open interest in coins vs dollars can move by very different amounts, and sometimes in opposite directions. Worked on Athenum's live feed on 2026-07-24, aggregate Bitcoin futures open interest across the 14 exchanges Athenum tracks was about $18.0B, which is the same 275,575 BTC of contracts read through the $65,392 price. Over the seven days to 2026-07-24 that dollar figure rose +3.03%, but the coin figure changed only -0.85%, because BTC itself gained +3.92%; almost the entire "open interest is up" headline was price, not new positions. The cover chart traces both readings of the identical open interest across the week.
What does open interest in coins vs dollars actually mean?
Open interest counts contracts, not trades: it is the total size of positions that are open right now, and it rises when a new buyer and a new seller open a fresh contract, and falls when a position is closed. That single quantity can be expressed in two units. In coin terms it is how many Bitcoin of notional are open, for example 275,575 BTC on 2026-07-24. In dollar terms it is that same coin figure valued at the current price, so dollar open interest equals coin open interest multiplied by price. The two are the identical position base measured with two different rulers, and the ruler you pick changes the story the number tells.
Why can the same crypto open interest rise in dollars and fall in coins?
Because one ruler moves. Coin open interest only changes when contracts are actually opened or closed. Dollar open interest changes for that reason too, but it also changes whenever the price changes, since price is baked into it. Hold the number of contracts fixed and let BTC rally, and dollar open interest climbs even though not a single new position was opened; let BTC fall and dollar open interest drops while the real contract base is untouched. Over the seven days to 2026-07-24, the coin base changed just -0.85% while BTC gained +3.92%, and those two together produce the +3.03% rise you see in dollars. The bridge below splits the dollar move into its two parts.

A -0.85% change in the coin contract base combined with a +3.92% BTC price move gives the +3.03% rise in dollar open interest over the seven days to 2026-07-24.
That is the whole mechanism. When you read that dollar open interest jumped, you cannot tell from the dollar figure alone whether traders piled in or price simply rose under a steady stack of contracts. To separate leverage from price you have to look at the coin ruler.
Did Bitcoin open interest actually grow this week, or just its dollar value?
Mostly the dollar value. Measured in coins, aggregate Bitcoin open interest went from 277,946 BTC on 2026-07-17 to 275,575 BTC on 2026-07-24, a change of -0.85%, which is close to flat. Measured in dollars over the same window it went from about $17.5B to about $18.0B, a change of +3.03%. Same position base, same seven days, two very different headlines: one says the market barely changed its exposure, the other says open interest is up three percent. The coin line below is the honest picture of how little the real contract base moved.

In coin terms, aggregate open interest barely moved: 277,946 BTC on 2026-07-17 to 275,575 BTC on 2026-07-24, a -0.85% change, while the dollar figure rose +3.03%.
This is exactly where a dollar-only read misleads. A trader watching only dollar open interest during a rally sees it rising and reads it as fresh leverage crowding in, when the coin ruler shows the position base was almost unchanged and price did the lifting. Our explainer on the four open interest and price regimes walks through how rising or falling open interest pairs with a rising or falling price, and it only holds together when you read open interest in coins.
Which denomination should you read, and when?
Neither ruler is wrong; they answer different questions, so the fix is to know which one you are asking. Coin open interest answers "how much real positioning is on," which is the read you want for leverage build-up, squeeze risk, and whether a move is backed by new contracts. Dollar open interest answers "how much money is at stake," which is the read you want for sizing dollar risk, comparing across assets, and gauging how large a liquidation cascade could be. The table sums up when to reach for each.
Question you are asking | Read open interest in | Why |
|---|---|---|
Is fresh leverage being added or removed? | Coins (BTC) | Strips out price, so it only moves when contracts open or close |
How crowded and squeeze-prone is positioning? | Coins (BTC) | The real contract base, not its market value |
How much dollar risk is on the table? | Dollars (USD) | Notional at stake scales with price, which is what a liquidation is settled in |
How does BTC compare to ETH or SOL open interest? | Dollars (USD) | A common unit lets you compare position bases across coins |
Is "open interest up 3%" real growth? | Both | Compare the two: if dollars rose but coins did not, it was price |
How is Bitcoin open interest split across the exchanges right now?
Read in either unit, the position base is concentrated, and Athenum normalizes it across the 14 exchanges so the split is comparable venue to venue. On 2026-07-24, of the roughly $18.0B in aggregate Bitcoin futures open interest, Binance held $6.75B (103,268 BTC), about 37.5% of the total; Bybit $3.61B (55,189 BTC, 20.0%); Hyperliquid $2.44B (37,259 BTC, 13.5%); Bitget $2.31B (35,397 BTC, 12.8%); OKX $2.05B (31,401 BTC, 11.4%); and Deribit $0.74B (11,292 BTC, 4.1%). Each bar below is dollar notional, with the coin count beside it so you can see both rulers at once.

On 2026-07-24, Binance carried $6.75B of Bitcoin open interest (103,268 BTC, 37.5% of the total), ahead of Bybit at $3.61B and Hyperliquid at $2.44B.
For the fuller version of this breakdown, including how the venue mix shifts over time, see open interest by exchange. If perpetual futures themselves are new to you, what are perpetual futures covers how the contracts that make up this open interest work.
How do you read open interest in the right denomination yourself?
Turn it into a short, repeatable check whenever you see an open interest number quoted:
1. Ask which unit it is in. A figure like $18.0B is dollars; a figure like 275,575 BTC is coins. If the source does not say, assume dollars, because most dashboards default to it. 2. Convert to the other unit. Coin open interest equals dollar open interest divided by price; dollar open interest equals coin open interest multiplied by price. On 2026-07-24 that valued the roughly $18.0B of aggregate open interest at about 275,575, the same contract base the coin charts plot. 3. Compare the two changes over your window. If dollar open interest rose but coin open interest did not, the increase was price, not new positioning, exactly as the +3.03% versus -0.85% split showed this week. 4. Match the unit to your question. Use coins to judge leverage and crowding, dollars to judge money at risk and to compare across assets. 5. Size against your own liquidation, not the aggregate. The market's open interest does not set your risk; your position does. Map it in the free leverage and liquidation calculator and the position size calculator, and use the market cap calculator to weigh open interest against the asset it is written on.
Every open interest figure in this post is Athenum's live cross-exchange view, the 14 exchanges in one normalized feed, and the 34 calculators beside it stay free, with no account, no email, and no usage limits. Read the split in both units in the free leverage and liquidation calculator, then open the live Athenum terminal to watch open interest move in dollars and in coins as price does.
One terminal. All the data.
Liquidations, orderbook depth, whale walls & open interest from 4 exchanges, all real-time, in one place.
No credit card required
