Table of Contents6 sections
- What do open interest and price tell you together?
- What are the four open interest and price regimes?
- What regime is BTC in right now, on 2026-07-16?
- Why does the same open interest read differently over 24 hours and seven days?
- How do you confirm an open interest signal?
- How do you read open interest and price yourself?
Practise with worked lessons
- Read the price–open interest matrix as competing hypotheses
Price up with OI up is an observation, not a motive. Read the four price and open interest combinations as competing hypotheses with a rejection rule.
TLDR. Open interest counts how many futures contracts are open, but the number only becomes a signal once you read it against price. Rising open interest means fresh money is opening positions; falling open interest means positions are being closed. Pair that with price direction and you get four regimes: rising open interest with rising price is new longs, rising open interest with falling price is new shorts, falling open interest with rising price is short covering, and falling open interest with falling price is long liquidation. As of 2026-07-16, aggregate BTC open interest across the 14 exchanges Athenum tracks is $17.4 billion, up +4.7% over the last seven days while price rose +2.0% to about $64,106, which puts Bitcoin in the new-longs quadrant: this rally is being led by fresh leveraged buyers, not by short covering.
What do open interest and price tell you together?
Open interest is the total number of futures or perpetual contracts that are currently open and not yet closed or settled. Every contract has a buyer, who is long, and a seller, who is short, so one unit of open interest is one long matched to one short. When open interest rises, new contracts are being created, which only happens when a new buyer and a new seller both step in, so fresh money is entering the market. When open interest falls, contracts are being torn up as longs and shorts close against each other, so money is leaving. On its own that tells you the tide of participation, not the direction of conviction. Price supplies the direction. A market can rise because new buyers are pushing in, or because trapped shorts are buying back to close, and those two look identical on a price chart but opposite on an open interest chart. Reading the two together is what separates a move with fuel behind it from one that is running out of it.
What are the four open interest and price regimes?
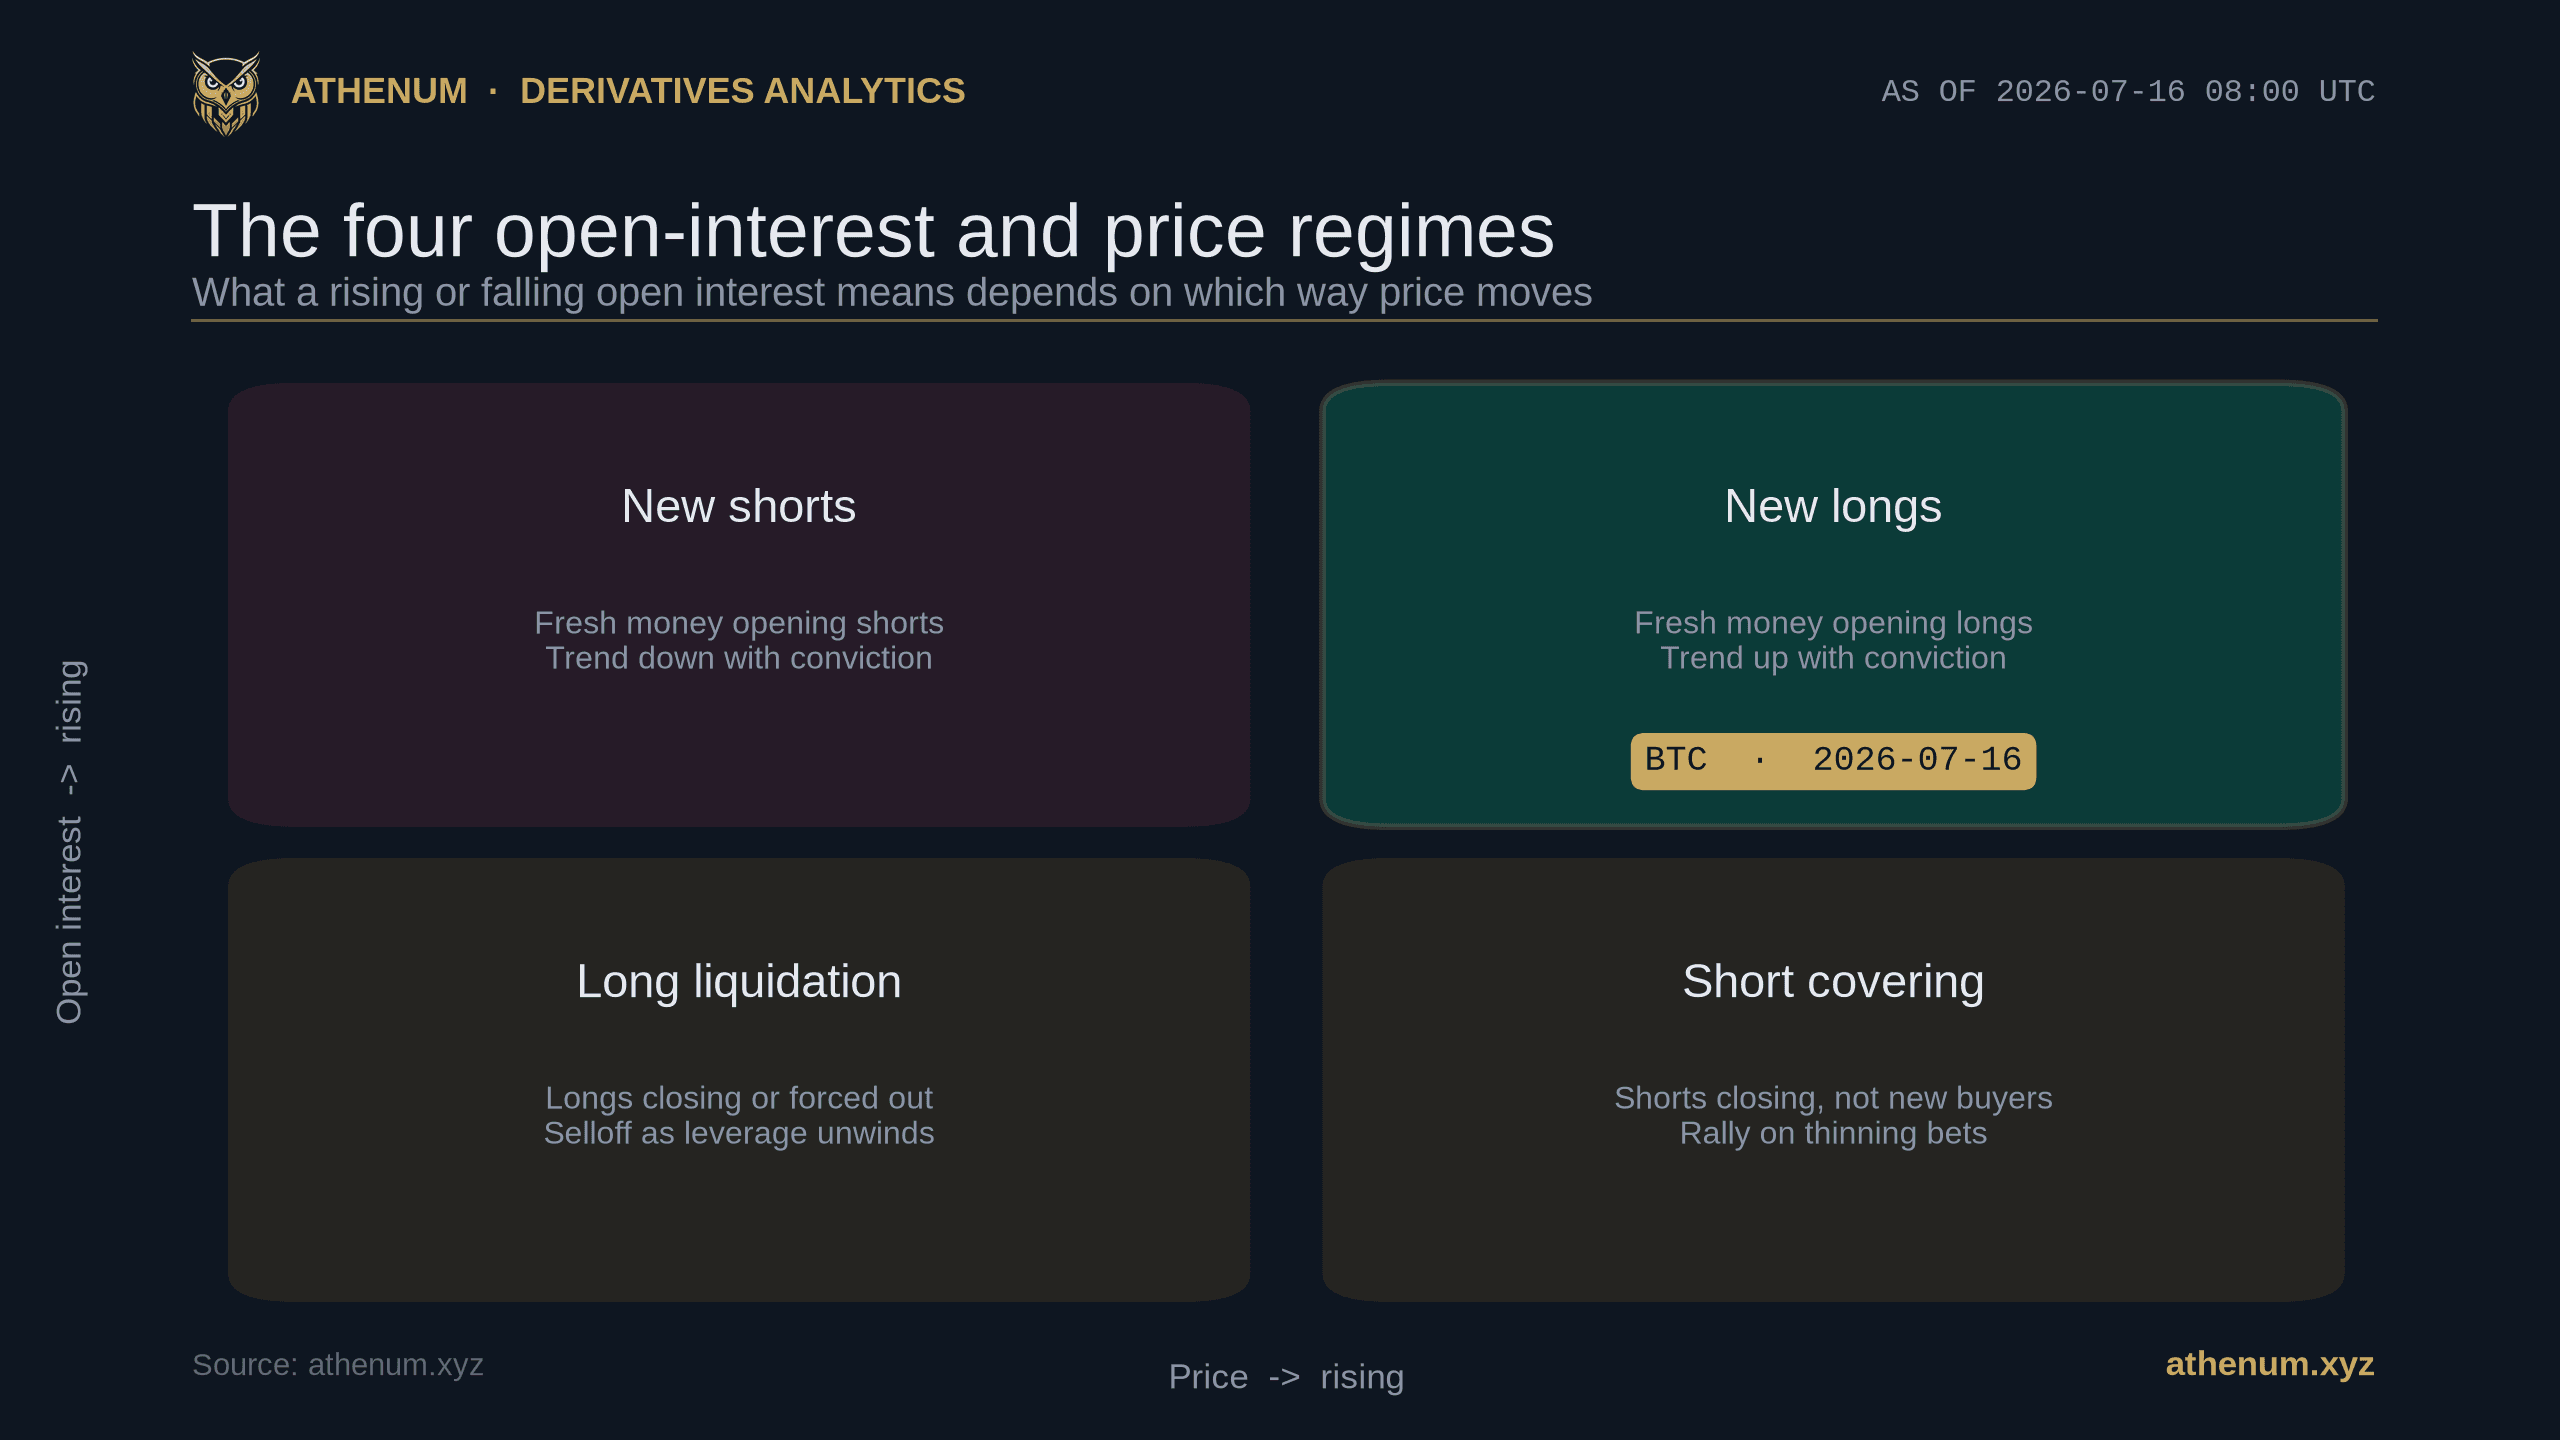
There are only four combinations of open interest direction and price direction, and each has a standard interpretation that futures traders have used for decades. The map at the top of this page lays them out as a grid; the table below is the same thing in words.
Open interest | Price | Regime | What it means |
|---|---|---|---|
Rising | Rising | New longs | Fresh money is opening longs, an up-move with real conviction behind it |
Rising | Falling | New shorts | Fresh money is opening shorts, a down-move with real conviction behind it |
Falling | Rising | Short covering | Shorts are closing, not new buyers arriving, a rally on thinning bets |
Falling | Falling | Long liquidation | Longs are closing or being forced out, a selloff as leverage unwinds |
The two rising-open-interest regimes are the ones with fuel: new positions are being added in the direction of the move, so the trend has fresh participation behind it. The two falling-open-interest regimes are the ones running low, because the move is being driven by existing positions closing, which is a finite source of pressure. A short-covering rally can be violent, but it burns out when the shorts are gone; a long-liquidation selloff can cascade, but it stops when the forced sellers are done. None of the four is automatically bullish or bearish for what comes next, but knowing which one you are in tells you whether the current move is being built or unwound.
What regime is BTC in right now, on 2026-07-16?
As of 2026-07-16, aggregate BTC open interest across the 14 exchanges on Athenum's live cross-exchange feed stands at $17.4 billion, up from $16.65 billion a week earlier, a +4.7% rise. Over the same seven days, price moved from about $62,865 to about $64,106, a +2.0% gain. Rising open interest with rising price is the new-longs regime: the money behind this move is fresh leveraged buyers opening positions, not shorts buying back to close. That is the most straightforward of the four readings, a trend with participation behind it rather than a squeeze.

BTC open interest and price both rose over the week to 2026-07-16, open interest +4.7% to $17.4B and price +2.0% to $64,106, the new-longs read.
Two other Athenum readings on 2026-07-16 line up with that. The aggregated funding rate is modestly positive, so longs are paying shorts to hold the trade, which is what you expect when new longs dominate. The long/short account ratio sits at about 1.22, tilted to the long side. None of this predicts the next move; it characterizes the current one. The new-longs read says the rally has been earned by fresh buyers, which is healthier than a short squeeze, but positive funding and a long-tilted crowd are also the fuel for a sharp long-liquidation flush if price rolls over, because crowded, leveraged longs are exactly what gets forced out on the way down.
Why does the same open interest read differently over 24 hours and seven days?
Open interest direction depends entirely on the window you measure it over, and the regime can flip as you zoom in. On 2026-07-16 the seven-day picture is a clean new-longs build, open interest +4.7% on price +2.0%. But the last 24 hours tell a different story: open interest fell about -2.5% while price slipped about -0.8%, a small long-liquidation flush sitting on top of the weekly build. Zoom to 48 and 72 hours and the reading changes again, with open interest roughly flat to slightly lower, about -0.6% and -0.3%, while price rose about +2.4% and +1.7%, which is the fingerprint of short covering.

The regime read flips with the window on 2026-07-16: a 7-day new-longs build (+4.7% OI, +2.0% price) sits on top of a 24-hour unwind (-2.5% OI, -0.8% price).
That is not a contradiction, it is the whole point. A swing trader who cares about the week reads new longs and sees a trend with fuel. A day trader who cares about the last session reads a leverage flush and sees near-term de-risking. Always state the window when you quote an open interest change, because "open interest is rising" with no timeframe attached is not a signal, it is an ambiguous sentence.
How do you confirm an open interest signal?
Open interest and price give you the regime; funding and positioning tell you how crowded it is. The aggregated perpetual funding rate held modestly positive across the last seven days to 2026-07-16, averaging about +0.0053% per eight hours and printing +0.0061% at the latest reading, which is roughly +5.8% to +6.7% annualized. Persistently positive funding in a new-longs regime confirms the story, because longs are the ones paying to keep the trade on, so the fresh money really is on the long side. If funding were negative while open interest and price rose, you would suspect the rally was shorts covering rather than new longs, and you would trust it less.

Aggregated BTC funding held positive every day of the week to 2026-07-16, averaging +0.0053% per 8h and printing +0.0061% latest, longs paying to hold, which backs the new-longs read.
The confirmation stack is simple. Open interest plus price gives the regime. Funding tells you which side is paying, and therefore which side is crowded. The long/short ratio tells you how lopsided the crowd already is. When all three agree, as they do for BTC on 2026-07-16, the read is high-confidence; when they disagree, the move is murkier and worth less.
How do you read open interest and price yourself?
You can turn this into a repeatable four-step check:
1. Fix your window. Decide whether you care about the last day, the last few days, or the last week, and measure the open interest change and the price change over the same window. A regime read is only valid for the window it was measured on. 2. Read the quadrant. Rising open interest with rising price is new longs; rising with falling is new shorts; falling with rising is short covering; falling with falling is long liquidation. 3. Ask whether the move is built or unwound. Rising open interest means fresh positions are fueling the move; falling open interest means it is driven by closing positions, a finite source that burns out. 4. Confirm with funding and positioning. Positive funding and a long-tilted crowd back a new-longs read; the opposite would undercut it.
From there, size the trade before you put it on. The free leverage calculator and position size calculator turn a regime read into an actual position and a liquidation price, and the funding rate calculator prices what a positive-funding trade costs to hold. Open interest is also the raw material for two related reads: where that leverage sits across venues, in open interest by exchange, and how stretched it is against market size, in the estimated leverage ratio.
If you want to run these numbers yourself, Athenum aggregates live derivatives data from 14 exchanges, and its 34 calculators are free to use, with no account, no email, and no usage limits. Open the live Athenum terminal to watch open interest and price move together in real time.
One terminal. All the data.
Liquidations, orderbook depth, whale walls & open interest from 4 exchanges, all real-time, in one place.
No credit card required

Athenum Analytics
Athenum Analytics is our three-person editorial team covering crypto derivatives, market data and macroeconomic context.