Practise with worked lessons
- Track whether an order-book wall traded or disappeared
Reconcile displayed depth with executed trades. An 800-unit wall reduction is not 800 units traded, and a shrinking wall proves neither a fill nor a spoof.
TLDR: Order book imbalance is the gap between resting bid liquidity and resting ask liquidity, and it is one of the most misread numbers in crypto because a single figure hides where the depth actually sits. On the Athenum aggregated order book at 2026-06-27 23:38 UTC, total bid depth across four exchanges was $1.34B against $741.13M of asks, a +28.9% lean toward bids. Yet the near-touch band told the opposite story: within 2% of price on Binance the book was ask-heavy at -5.6%, and venues disagreed, with Binance Futures stacked on the bid ($851.73M vs $395.52M) while Coinbase leaned ask ($171.01M vs $215.98M). The honest read is not the headline number, it is which band and which venue you are looking at.
A limit order book is just resting intent: every bid is someone willing to buy lower, every ask someone willing to sell higher. Imbalance compares the two sides. Read it well and it tells you where passive liquidity is concentrated and which way the book is leaning. Read it lazily, off one venue or one depth band, and it will fake you out, because the same book can be bid-heavy in aggregate and ask-heavy at the touch.
This is one metric, read carefully. Below is what it is, why the depth band changes the answer, how to read liquidity walls, and where to check it live.
What is order book imbalance?
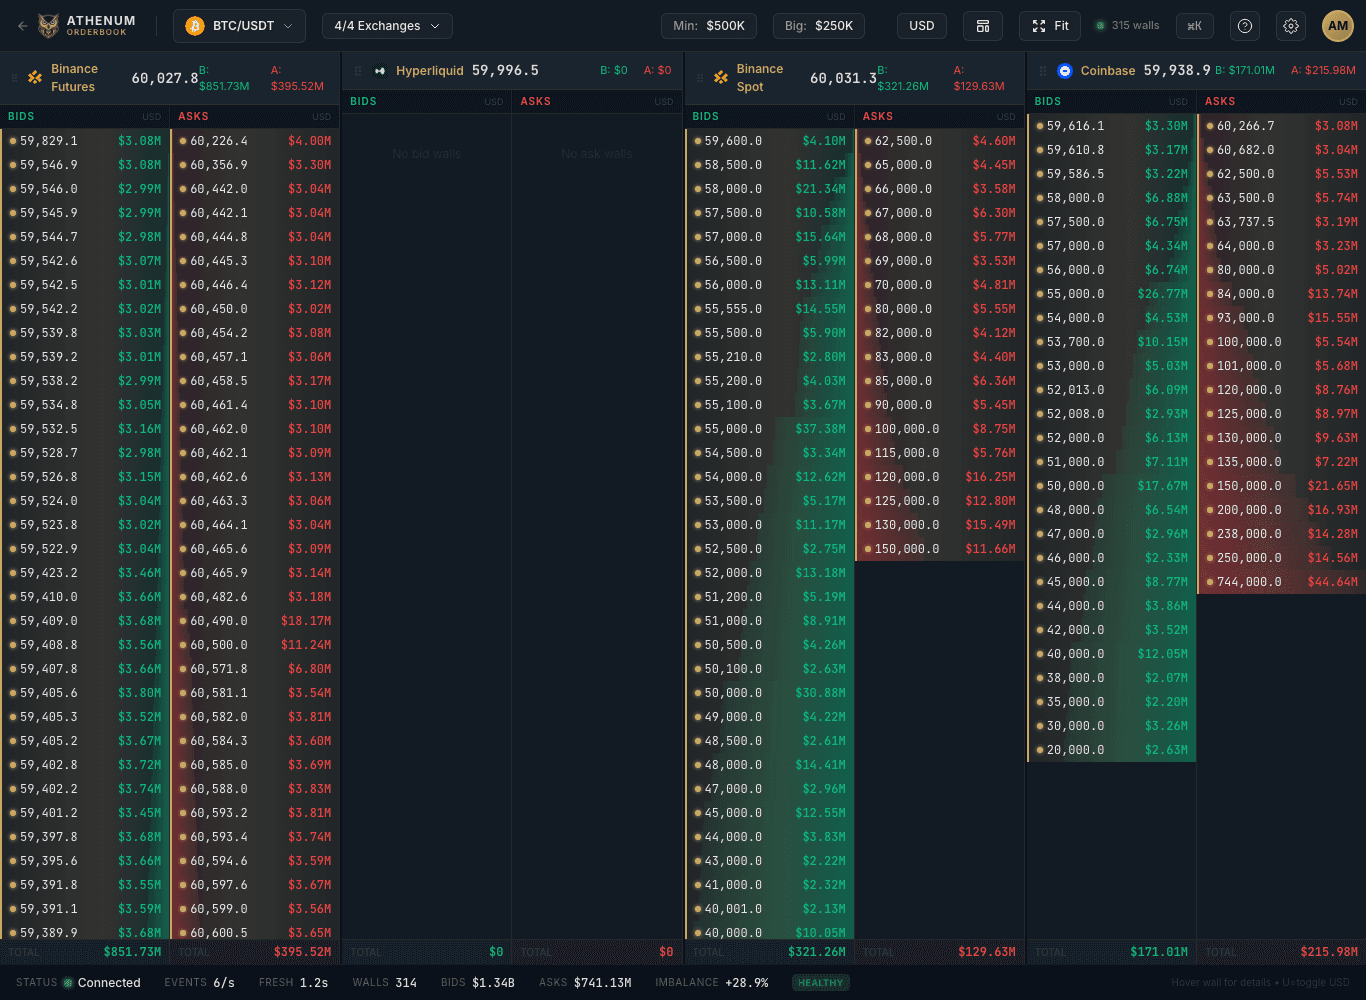
It is the difference between total bid liquidity and total ask liquidity over a chosen depth band, expressed as a ratio or a percent. A common form is (bids minus asks) divided by (bids plus asks): positive means more resting buy liquidity, negative means more resting sell liquidity. On Athenum the aggregated book stacks resting walls from several venues into one view, so at 2026-06-27 23:38 UTC the $1.34B of bids against $741.13M of asks printed a +28.9% imbalance across 314 detected walls. The number is only as meaningful as the band you measure it over and the venues you include.

Athenum, per-venue resting depth at 2026-06-27 23:38 UTC. Binance Futures and Binance Spot lean bid, Coinbase leans ask, Hyperliquid shows no walls above the $500K filter. The aggregate hides this disagreement. athenum.xyz
Why does the imbalance number depend on the depth band?
Because liquidity is not evenly distributed away from price. Big resting walls often sit deep, far from the touch, where they cost nothing to post and may be pulled before they ever fill. Measure the whole book and those deep walls dominate the total: that is how the aggregate read +28.9% toward bids. Measure only the near-touch band, within 2% of price, and a different picture appears. At the same moment the Binance 2% depth was ask-heavy at -5.6%, with $7.1M of bids against $8.0M of asks. Full-book imbalance answers "where is passive liquidity parked," near-touch imbalance answers "what is likely to absorb the next market order." They are different questions, and conflating them is how a bid-heavy book still gets sold into.

Athenum, Binance liquidity within 2% of price at 2026-06-27 23:38 UTC: ask-heavy at -5.6% ($7.1M bids vs $8.0M asks), the opposite lean to the full-book aggregate. athenum.xyz
How do you read liquidity walls?
A liquidity wall is a single resting order, or a tight cluster, large enough to act as visible support or resistance. Athenum flags walls above a size filter, here $500K, and marks the largest as "big" above $250K, so noise is stripped out and 314 real walls remain. Read three things. First, size: a $37M bid wall is a different signal than a $3M one. Second, distance from price: walls at the touch are about to be tested, walls 10% away are positioning, not immediate. Third, persistence: a wall that holds through several sweeps is real liquidity, a wall that vanishes as price approaches was spoof-like and never meant to fill. A wall is evidence, not a guarantee, because resting orders can be cancelled.
Full-book imbalance vs near-touch imbalance: side by side
Property | Full-book imbalance | Near-touch (within 2%) |
|---|---|---|
What it measures | Where passive liquidity is parked | What absorbs the next market order |
Dominated by | Deep walls far from price | Orders at the touch |
The 2026-06-27 read | +28.9% bid-heavy | -5.6% ask-heavy |
Failure mode | Deep walls get pulled before filling | Thin band, flips fast |
Best used for | Mapping support and resistance zones | Gauging immediate pressure |
The two reads are complements. The full book shows you the terrain, the deep zones where price could find support or stall. The near-touch band shows you the weather right now, which side is more likely to give first. With the aggregate bid-heavy but the touch ask-heavy on 2026-06-27, the book was parked long but defended short into the next move, exactly the kind of split that precedes a fast rejection.
How do you read it in practice?
Read imbalance per venue before you trust the aggregate. On 2026-06-27 the same instrument was bid-heavy on Binance Futures and Binance Spot but ask-heavy on Coinbase, while Hyperliquid showed no walls above the filter at all. That disagreement is information: it tells you the bid conviction was a Binance phenomenon, not a market-wide one, and a venue-blind aggregate would have hidden it. Pair the band and the venue, watch whether big walls persist or pull as price approaches, and treat a one-number imbalance as a headline to investigate, never a signal to trade on its own.
You can explore the aggregated book and the rest of the 28 free tools, no login required, at athenum.xyz/tools. The depth above is stacked from four of the 14 exchanges Athenum aggregates: Binance Futures, Binance Spot, Coinbase, and Hyperliquid. Want the live multi-venue terminal? Start a free 7-day Pro+ trial, no card required.
The short version
Order book imbalance compares resting bid and ask liquidity, but the answer depends entirely on the depth band and the venue set. A book can be bid-heavy in aggregate, like the +28.9% read on 2026-06-27, and ask-heavy at the touch, like the -5.6% near-touch read the same minute. Measure both bands, read it per venue, watch whether walls persist, and use it as context for where liquidity sits, not as a standalone buy or sell call.
One terminal. All the data.
Liquidations, orderbook depth, whale walls & open interest from 4 exchanges, all real-time, in one place.
No credit card required

Athenum Analytics
Athenum Analytics is our three-person editorial team covering crypto derivatives, market data and macroeconomic context.