Table of Contents8 sections
- What is the perp-to-spot volume ratio?
- What is a normal perp-to-spot volume ratio?
- How do you read the perp-to-spot ratio against price?
- How does the ratio fit with open interest and funding?
- Where can you track the derivatives side across venues?
- How do you use the ratio to size a position?
- Frequently asked questions
- What is a good perp-to-spot volume ratio?
- Does a high perp-to-spot ratio mean a crash is coming?
- Why is crypto derivatives volume higher than spot?
- Is the perp-to-spot volume ratio the same as open interest?
- Where can I track the perp-to-spot volume ratio?
- The bottom line
Practise with worked lessons
- Compare spot CVD with perpetual flow correctly
Compare spot CVD with perpetual flow on matching units, windows and venues. A spot–perp divergence raises questions; it does not locate smart money.
TLDR: The perp-to-spot volume ratio divides how much perpetual futures volume trades against how much spot volume trades over the same window, and it answers one question that price alone cannot: is a move powered by leverage or by real coins changing hands. When perpetual turnover runs many times spot, price discovery is happening in the derivatives market first and spot is reacting, a setup that is more prone to a sharp liquidation flush than a rally spot buyers are actually funding. The ratio is not small. Across full year 2024 centralized exchanges processed roughly $58.5T in perpetuals against $17.4T spot, about a 3.3x ratio, and by early 2026 derivatives were about 73% of total exchange volume in February rising to about 76% in March. For Bitcoin specifically the perpetual-to-spot ratio has recently run on the order of 5x to 12x, and has spiked far higher in bursts of speculation. This guide explains what the ratio measures, what counts as normal, how to read it against price, and how to pair it with open interest and funding before you size a position.
Most traders watch price and funding but never check who is actually in the market. The perp-to-spot volume ratio is the cleanest single read on that question, because it contrasts the leveraged, low-collateral venue with the venue where someone has to deliver the asset. Take the definition first, then a sense of normal, then the read against price, and finally the two gauges that confirm it.
What is the perp-to-spot volume ratio?
It is perpetual futures traded volume divided by spot traded volume over the same window, for the same asset. Perpetual futures are leveraged contracts that never expire and settle in a stablecoin or the coin itself, so a trader can move size with a fraction of the notional as collateral. Spot volume is the actual asset trading hands. Dividing one by the other gives a ratio, and because the two markets answer different needs, that ratio is a direct gauge of how leveraged and speculative the current flow is. A close cousin, the broader derivatives-to-spot ratio, adds dated futures and options to the numerator, but the perpetual-only version is the sharpest read on speculative leverage because perps are where the fast, high-leverage money lives.
Computing it is four steps, and the only judgment call is scope.
1. Pick the asset and the window, for example BTC over the trailing 24 hours. 2. Sum perpetual futures volume across the venues you care about, ideally aggregated rather than a single exchange. 3. Sum spot volume for the same asset and window across the same venue set. 4. Divide perpetual volume by spot volume. A result of 5 means perps traded five times the spot notional.
The one trap is mixing venue sets or windows between the numerator and the denominator, which manufactures a ratio that means nothing. Keep both sides on the same exchanges and the same clock.
What is a normal perp-to-spot volume ratio?
There is no single number, because it depends on scope, asset, and market mood, but the ranges are well documented. Market wide the derivatives share sits in the low 70s to high 70s percent of total volume, which is a ratio around 2.7x to 3.3x. Bitcoin on its own runs hotter, because it is the most derivatives-heavy asset, and single-venue spikes can be extreme. The table below sets out the reference points, each with its scope and source so the variation is transparent rather than hidden.
Scope | Period | Perp or derivatives vs spot | Ratio | Source |
|---|---|---|---|---|
All crypto, perps vs spot | Full year 2024 | $58.5T vs $17.4T | about 3.3x | CoinGecko 2024 reports |
All crypto, derivatives share | February 2026 | about 73% of volume | about 2.7x | CCData exchange review |
All crypto, derivatives share | March 2026 | about 76% of volume | about 3.3x | CCData exchange review |
Bitcoin, perp vs spot | Recent 2026 | futures dwarf spot | about 5x to 12x | Coinglass perp-spot volume |
Bitcoin, short bursts | Speculative spikes | futures overwhelm spot | above 20x, toward 46x at the extreme | Coinglass perp-spot volume |
The practical takeaway is to judge the ratio against its own recent range for the asset you trade, not against a fixed threshold. A BTC ratio of 8x is unremarkable, while the same 8x on a large-cap spot pair that normally trades near parity would be a loud speculation signal.
How do you read the perp-to-spot ratio against price?
You ask whether the move is leverage-led or spot-led, because the two age very differently. When the ratio climbs while price rises, the rally is being driven in the derivatives market, where positions are collateralized with a fraction of their notional, so it can unwind fast if funding turns expensive or a wick triggers liquidations. When price rises while the ratio compresses, spot buyers are doing the work, real demand that does not evaporate on a single liquidation cascade. A durable trend usually shows spot participating, and a fragile one is mostly perps.
Signal | Perp-to-spot ratio | What it suggests |
|---|---|---|
Price up, ratio rising | Elevated and climbing | Leverage-led, fragile, watch funding and liquidation clusters |
Price up, ratio compressing | Falling toward its range floor | Spot-led, real demand, more durable |
Price flat, ratio spiking | Sharp short-lived spike | Positioning or a squeeze, not a trend yet |
Sustained extreme ratio | Many multiples for weeks | Price discovery in derivatives first, spot reacting |
One confirming tell for the spot side is the Coinbase premium, the gap between the Coinbase price and the global aggregate, which reads US spot demand. A positive premium alongside a compressing ratio is the cleanest signature of a spot-funded move, while a negative premium, US spot trading at a discount to the rest of the market, points the other way, toward soft spot demand that leaves a leverage-led move less supported.

BTC Coinbase premium index -0.144% on 2026-07-05. A negative premium shows US spot trading at a discount to the global aggregate, soft US spot demand, the reading that leaves a leverage-led tape less supported.
How does the ratio fit with open interest and funding?
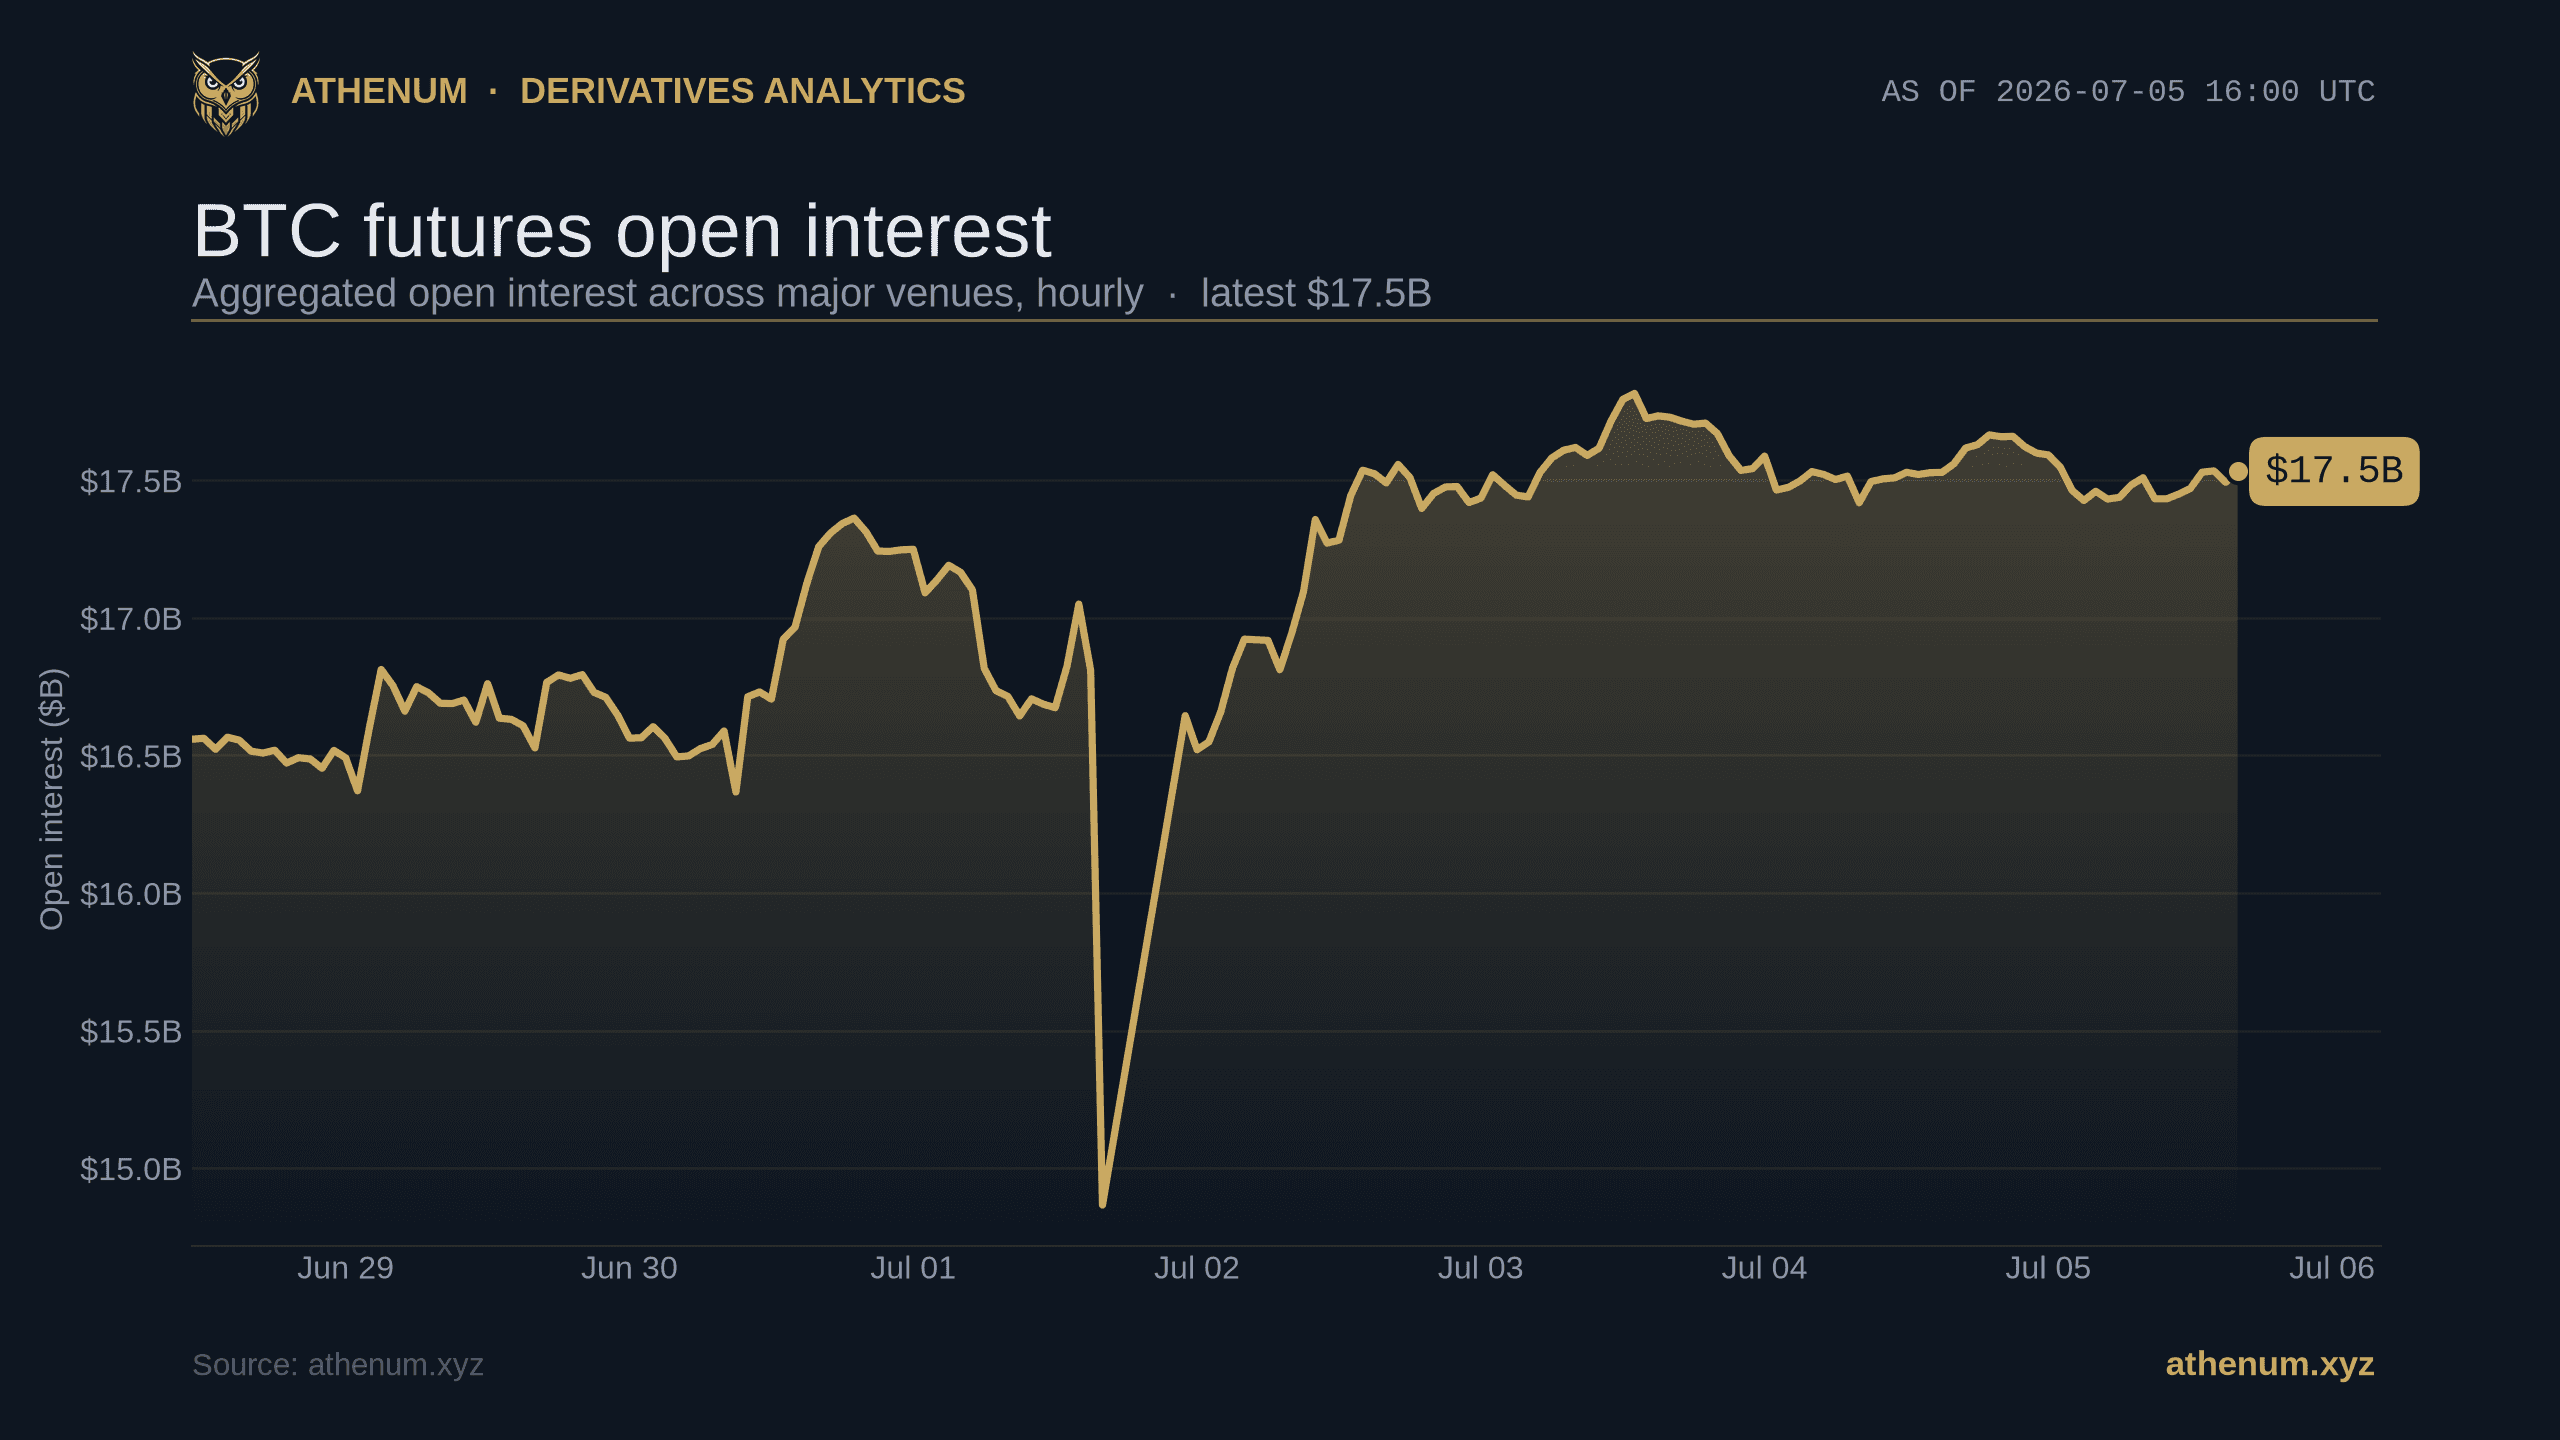
The volume ratio is a flow, and it is strongest when read next to a stock and a cost. Volume is turnover, how much changed hands. Open interest is the standing leverage, how many contracts are still open. Funding is the running price of holding those contracts. A high perp-to-spot ratio tells you the flow is leveraged, rising open interest tells you that leverage is being kept on rather than closed, and elevated funding tells you it is getting expensive to hold. When all three point the same way, crowded, growing, and paying, the market is primed for a flush. Aggregate BTC open interest sat at $17.5B on 2026-07-05, the standing leverage that all that perpetual turnover is churning.
Read these together and treat the volume ratio as the froth gauge, open interest as the exposure gauge, and funding as the sentiment and cost gauge. For the difference between turnover and standing exposure, see the Athenum open interest versus volume explainer. For a second leverage lens that scales open interest by exchange reserves, see the estimated leverage ratio. For the cost side, see how crypto perpetual funding rates are calculated and the OI-weighted funding rate.

Aggregate BTC perpetual funding rate +0.0058% per 8h on 2026-07-05. Funding is the running cost that turns expensive when a leverage-led move crowds one side.
Where can you track the derivatives side across venues?
On a terminal that aggregates it. Athenum aggregates crypto derivatives data across 14 exchanges, covering funding, open interest, liquidations, volume delta, options and ETF flows on a live self-serve terminal, so the perpetual side of the ratio is one aggregated read instead of a per-venue hunt, and you can pair it with a spot-volume source to complete the ratio. The single-venue trap matters here: a ratio built from one exchange can miss where the real perpetual turnover is, which is exactly why the numerator should be aggregated. For where aggressive flow is actually pushing price, the cumulative volume delta and the long/short ratio sit alongside it, and the perpetual futures explainer covers the contract itself.

The Athenum futures overview for BTC on 2026-07-05: aggregated open interest of $17.50B across 6 major perpetual venues (Binance, Bybit, OKX, Deribit, Bitget, Hyperliquid), with the live funding rate and per-venue open interest breakdown in one aggregated read.

Aggregate BTC long/short account ratio 1.31 on 2026-07-05, a modest long lean. Positioning and the perp-to-spot volume ratio are read together.
How do you use the ratio to size a position?
You let it set your caution, then you model the downside before you enter. A high and rising perp-to-spot ratio, confirmed by growing open interest and firm funding, is a signal to cut size and widen your margin buffer, because a leverage-led tape is where cascades start. Once you have decided on a size, price the risk explicitly: the leverage calculator shows the liquidation price and margin for your size, the risk-reward calculator frames the trade against your stop, and the P&L calculator models the outcome before you commit. Start a 7 day Pro+ trial with no card to read funding, open interest and derivatives volume across 14 exchanges in one place, or open Athenum to see the live terminal first.
Frequently asked questions
What is a good perp-to-spot volume ratio?
There is no single good number. Market wide the ratio sits around 2.7x to 3.3x, while Bitcoin on its own often runs 5x to 12x and spikes higher in speculative bursts. Judge it against the recent range for the specific asset rather than a fixed threshold.
Does a high perp-to-spot ratio mean a crash is coming?
No, it means the current flow is leveraged, which raises the odds of a sharp liquidation move but does not time it. A high ratio is a caution flag to read next to open interest and funding, not a standalone sell signal.
Why is crypto derivatives volume higher than spot?
Because perpetual futures offer high leverage with a fraction of the notional as collateral, so the same conviction moves far more contract volume than it would in spot. Derivatives have been roughly three quarters of total crypto exchange volume through early 2026.
Is the perp-to-spot volume ratio the same as open interest?
No. The volume ratio is a flow, how much turned over in a window, while open interest is a stock, how many contracts are still open. They are complementary: the ratio shows how leveraged the flow is, open interest shows how much of that leverage is being held.
Where can I track the perp-to-spot volume ratio?
Track the perpetual side aggregated across exchanges on a derivatives terminal like Athenum, which covers volume, open interest and funding across 14 exchanges, and pair it with a spot-volume source to complete the ratio. Aggregating the numerator matters, because a single venue can misstate where perpetual turnover really is.
The bottom line
The perp-to-spot volume ratio is the fastest way to tell a leveraged move from a real one. Perpetual turnover many times spot means price is being set in the derivatives market and can unwind quickly, while a compressing ratio and a positive spot premium mean buyers are funding the move with real coins. Read the ratio as the froth gauge, open interest as the exposure gauge, and funding as the cost gauge, and a green candle stops being a mystery and becomes a position you can size with the downside modeled first.
One terminal. All the data.
Liquidations, orderbook depth, whale walls & open interest from 4 exchanges, all real-time, in one place.
No credit card required

Athenum Analytics
Athenum Analytics is our three-person editorial team covering crypto derivatives, market data and macroeconomic context.