Table of Contents9 sections
- What is survivorship bias in a perpetual futures dataset?
- How much of a one year perpetual universe is missing from today's roster?
- Does the bias grow with the length of the backtest window?
- Were the delisted contracts too small and too short-lived to matter?
- What does that listing timestamp actually mean?
- Which way does survivorship push the age of the board?
- Can you run this on Binance and OKX as well?
- What does a normalized cross-venue feed add to this?
- How would you reproduce this?
TLDR. If you build a universe of perpetual contracts by calling a venue's live instrument endpoint, you are sampling survivors, and on 2026-09-14 the size of that is measurable rather than theoretical. Bybit is the one large venue that still serves its delisted contracts, and asking it for `status=Closed` returns 308 USDT-margined perpetuals alongside the 762 that are trading. Of the 571 contracts that were trading on 2025-09-14, 399 are still on the board and 172 have been delisted since, so the roster you can fetch today contains 69.9 per cent of the board as it actually stood a year ago. The bias is not flat: 100.0 per cent of the 200 contracts listed in the last 90 days survive, against 55.5 per cent of the 445 listed more than two years ago, so the hole grows with exactly the thing a backtest lengthens, mostly because an older contract has had longer in which to be removed. The delisted were not throwaways either, with a median life of 440.6 days. Binance and OKX will not tell you any of this: Binance's instrument list carries 129 USDT perpetuals in a `SETTLING` wind-down and no history, and OKX offers no way to ask for anything but the live board, silently returning the same 479 live rows for `state=expired` and for `state=garbage123` alike.
What is survivorship bias in a perpetual futures dataset?
It is the gap between the contracts a venue lists today and the contracts that actually existed during the window you are studying. It exists because the public instrument endpoint every researcher starts from is a description of the present rather than a record of the past, so the contracts a venue has removed simply are not in the response, and nothing in that response says they are missing. The effect is to quietly restrict any study built that way to the contracts that happened to survive until the day it was run.
Every venue publishes one call that returns its tradable instruments, and each stamps every contract with the moment it was listed: `onboardDate` on Binance USD-M, `launchTime` on Bybit, `listTime` on OKX. That is enough to date a board, and it is a method we have used before, on Athenum's census of stock perpetuals, where dating each contract by its onboard timestamp showed one venue's non-crypto board going from a single contract to 169 in nine months. The population itself is also already on the record: the Athenum count of every live crypto perpetual on Binance, Bybit, Bitget and OKX put 2,536 contracts on those main linear boards on 2026-08-16. Neither of those is the finding here. They are the setup.
The finding is what the same endpoint does not return. A contract that was delisted last March is not in the response, has no row, and produces no error. So a study that assembles its universe from the live call silently conditions on survival, and nothing in the payload marks that it has happened. The direction is knowable in advance: the longer your window, the more of it is missing, because a contract has more time in which to be removed.
What is usually impossible is putting a number on it, because the delisted are gone. On one venue they are not.
How much of a one year perpetual universe is missing from today's roster?
On Bybit's USDT-margined perpetual board, 172 of 571 contracts, so the live roster shows 69.9 per cent of what was trading.

Bybit's own two instrument calls on 2026-09-14: of the 571 USDT perpetuals trading a year earlier, 399 are still on the board and 172 have been delisted, so a universe rebuilt from the live endpoint alone is missing 30.1 per cent of that field.
Bybit's V5 instruments call accepts a `status` parameter, and the default response is trading contracts only. Asked on 2026-09-14 for `category=linear` with no status, it returned 870 rows, every one of them `Trading`. Asked for `status=Closed`, it returned 984 rows, which is more than the live board. Filtering both to `LinearPerpetual` contracts quoted in USDT gives 762 live and 308 closed, so the venue is still serving 1,070 contracts that have existed on that board.
Now reconstruct the board as it stood one year earlier. A contract was trading on 2025-09-14 if it was listed on or before that date and, in the closed set, if its `deliveryTime` falls after it. That gives 571 contracts: 399 still trading today and 172 delisted during the year. A researcher who pulled the live endpoint this morning and called it "every Bybit USDT perpetual over the past year" would be describing 69.9 per cent of that board.
The `deliveryTime` test is not a formality, and getting it wrong is the easiest mistake here to make. 298 closed contracts were listed on or before 2025-09-14, but 126 of them had already been delisted by that date, so they never traded in the window at all. Counting them would have put the missing share at 42.8 per cent instead of 30.1, which is an overstatement of nearly half again, in the direction that flatters the finding. Filter the graveyard on when a contract died, not only on when it was born.
One honest limit remains after that correction, and it points the other way. The 308 closed contracts are what Bybit still chooses to serve, not a complete graveyard: the earliest delisting anywhere in the response is dated 2022-02, so anything the venue removed before it began retaining these rows is missing from our count exactly as it is missing from the live one. That makes 172 a floor on the hole rather than a census of it, and 69.9 per cent an upper bound on how much of the year ago board you can recover.
Does the bias grow with the length of the backtest window?
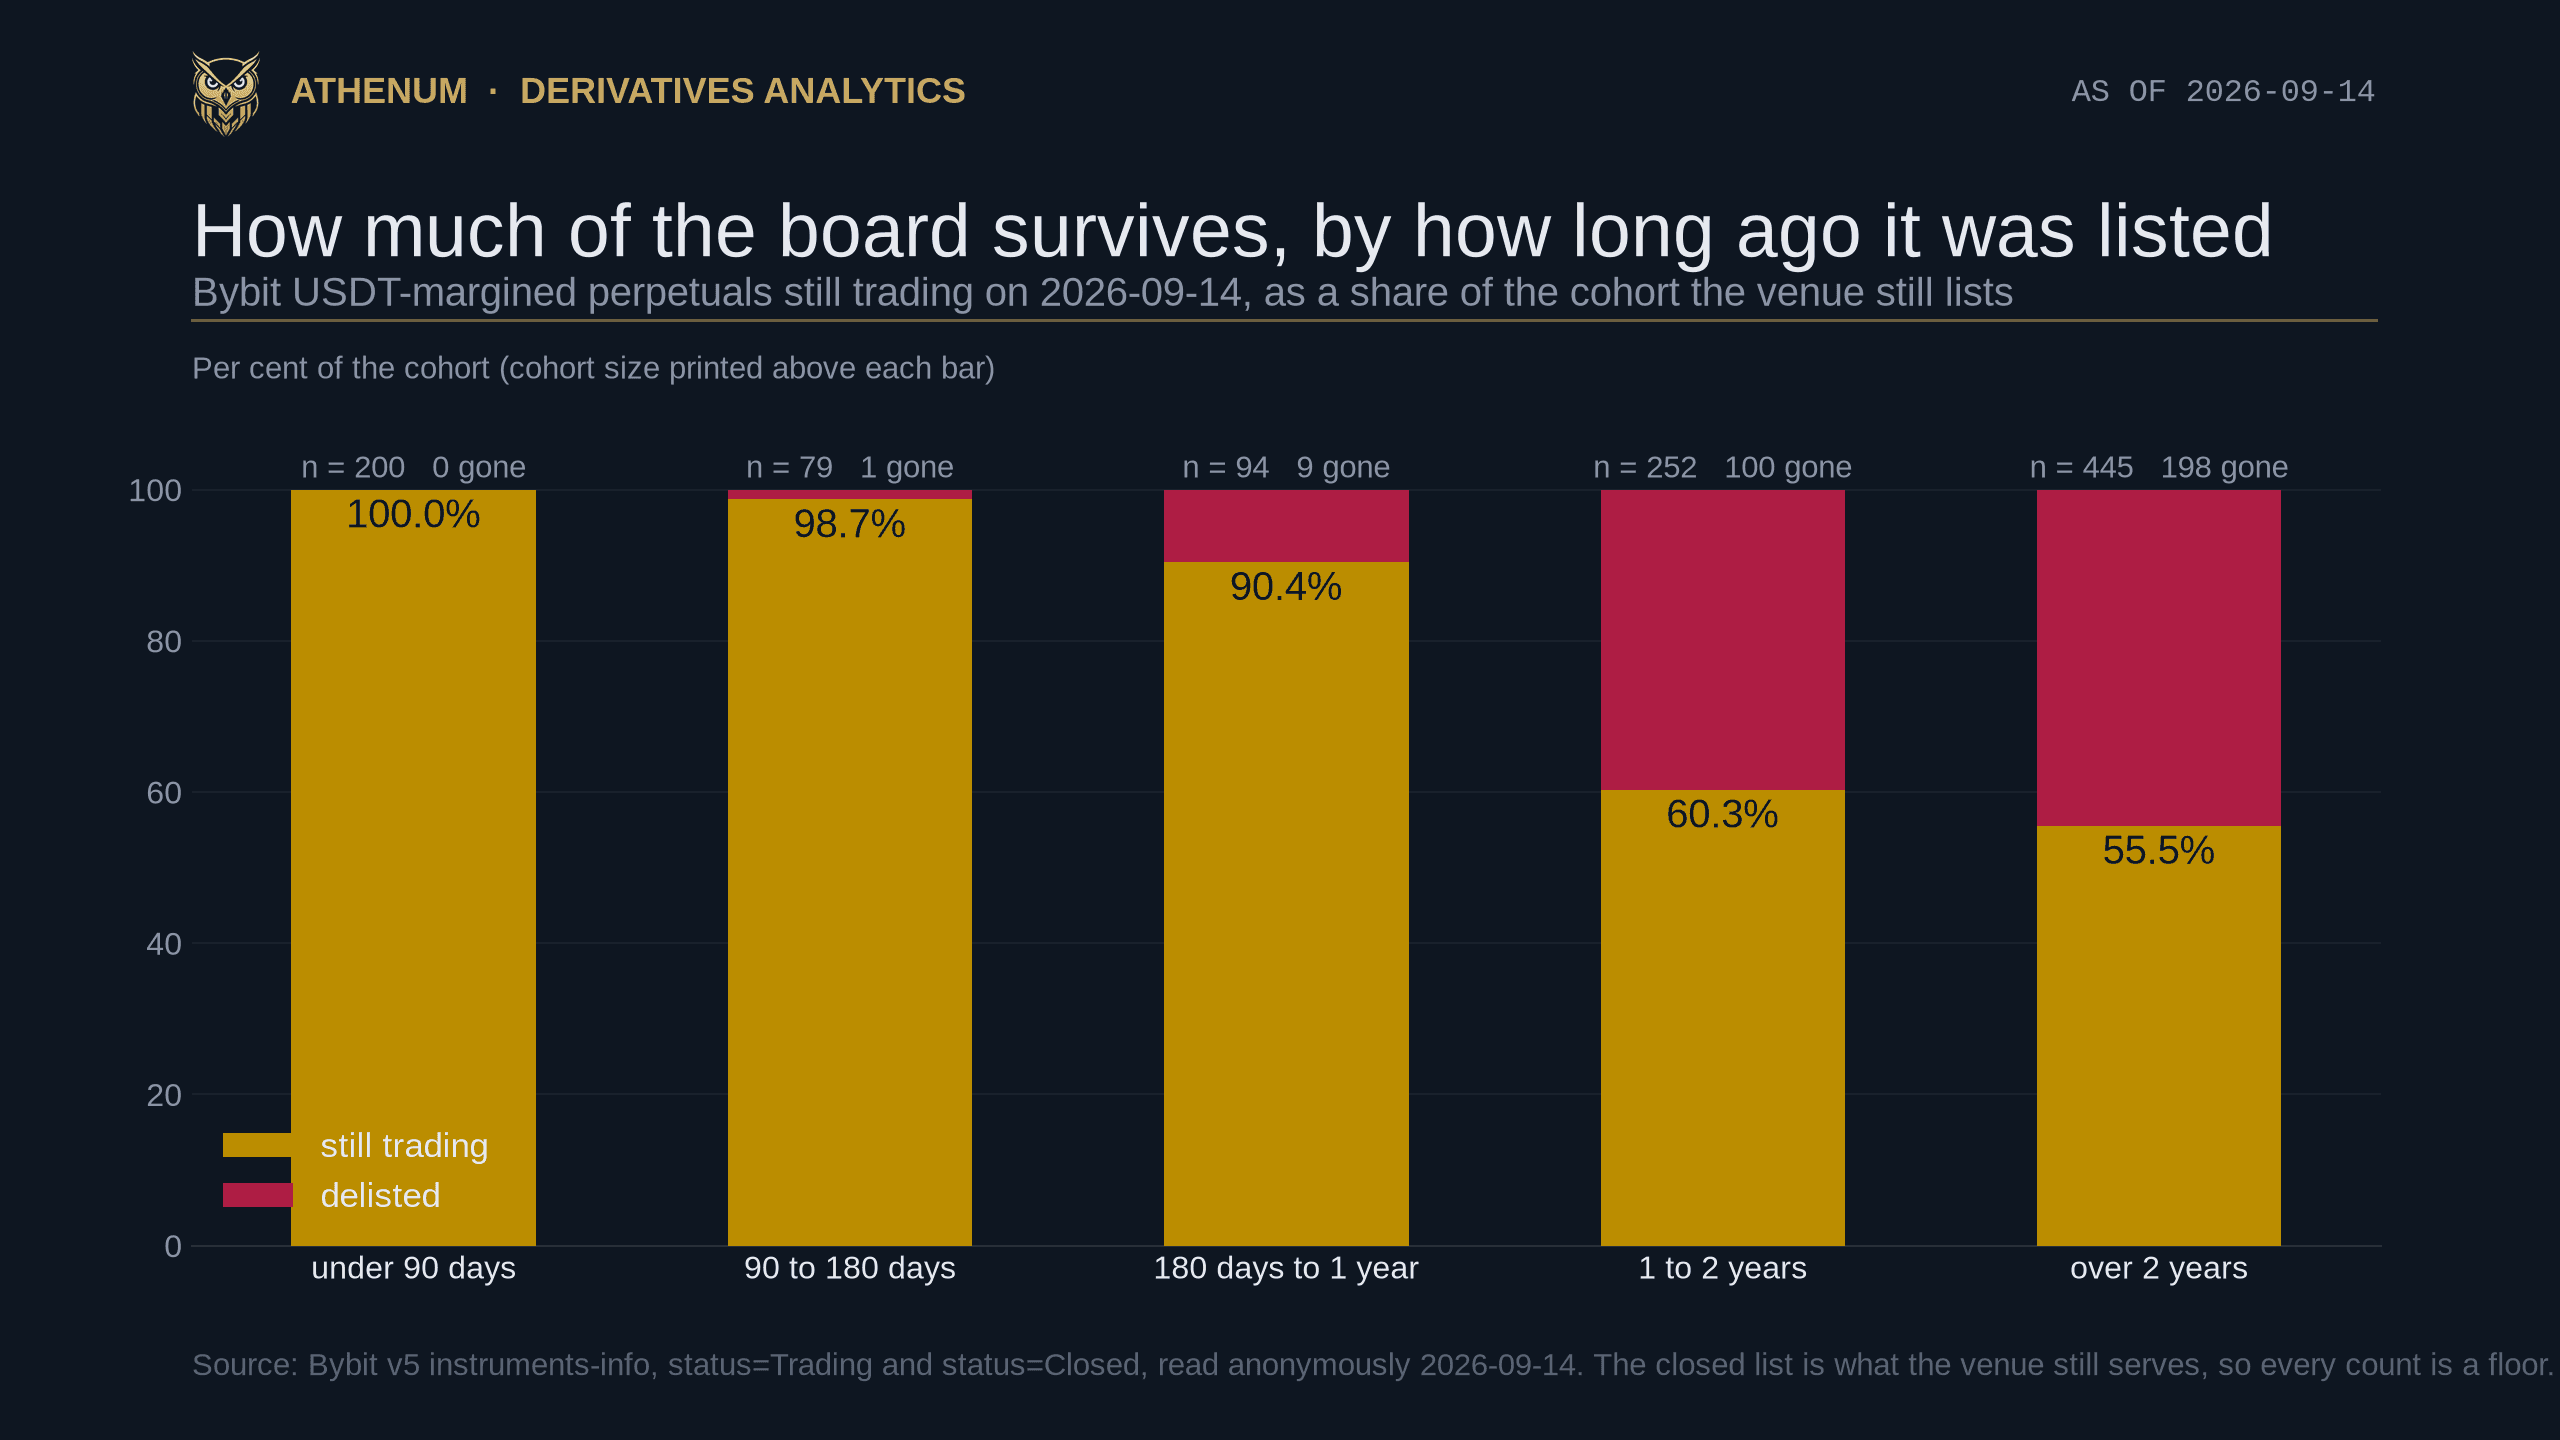
Yes. Survival runs from 100.0 per cent for the most recent cohort down to 55.5 per cent for contracts listed more than two years ago, though most of that gradient is simply exposure time rather than a rising removal rate.
Splitting every contract Bybit still lists, live or closed, by how long ago it was listed gives the cover chart above:
Listed | Contracts the venue still lists | Still trading on 2026-09-14 | Delisted | Survival |
|---|---|---|---|---|
under 90 days ago | 200 | 200 | 0 | 100.0 per cent |
90 to 180 days ago | 79 | 78 | 1 | 98.7 per cent |
180 days to 1 year ago | 94 | 85 | 9 | 90.4 per cent |
1 to 2 years ago | 252 | 152 | 100 | 60.3 per cent |
over 2 years ago | 445 | 247 | 198 | 55.5 per cent |
Read the first row carefully, because it is the one that misleads. Zero of the 200 newest contracts have been delisted, and that is not evidence that recent listings are better: a contract listed five weeks ago has had five weeks in which to be removed. The 100.0 per cent is close to what you would expect from almost any removal rate. The same caution applies to the middle row in the other direction, since 9 removals out of 94 is a small enough count that the 90.4 per cent should be read with its width in mind rather than as a precise rate.
That objection deserves an actual test rather than a caveat, because a gradient produced entirely by exposure time would not be a finding at all. Pool every contract into a single constant removal rate. The basis matters and is rarely stated, so here it is: 308 removals over 638,967 contract-days at risk, counting each live contract from its listing to 2026-09-14 and each delisted one from its listing to its delisting, which is a hazard of 0.000482 per contract per day. Ask what each cohort should have lost at that flat rate, using each cohort's own mean exposure, and the model predicts about 4, 5, 13, 59 and 208 removals against the 0, 1, 9, 100 and 198 observed. The three youngest cohorts all lose FEWER contracts than a flat rate predicts, the over two year cohort sits close to it at 198 against 208, and the one to two year cohort is the only one above it: it lost 100 where a flat rate predicts 59, and it supplies almost the whole of a chi-square of 37.8 on four degrees of freedom. So exposure time explains most of the gradient, and exactly one cohort carries a genuinely elevated removal rate. Note the shape of that concession, because it cuts against the headline twice: the over two year row, at 198 observed against 208 predicted, is if anything slightly below a flat rate, and the top row losing 0 where roughly 4 were predicted is unremarkable. Calling either of them evidence would be reading noise.
The consequence for anyone choosing a window, stated per cohort so it does not collide with the 30.1 per cent above, which is a figure for the whole one year board: of the contracts listed 180 days to a year ago, about one in ten is already gone; of those listed one to two years ago, two in five; of those listed more than two years ago, 198 of 445, or 44.5 per cent. The longer the window, the worse the cohort you are reaching back for. Those are different research problems, and nothing in the data you downloaded tells you which one you have. The direction of the resulting error is predictable, since the contracts that drop out are the ones that stopped working, so a strategy tested only on survivors will report a kinder drawdown than the period actually delivered. The free drawdown calculator prices the asymmetry that hides behind that: it takes a drawdown and returns the gain needed to climb back out of it, which is why a few quietly deleted losers flatter a backtest so much.
Were the delisted contracts too small and too short-lived to matter?
No on the second count, which is checkable here, and probably yes in money terms, which is not measurable from these endpoints and which we are not going to assert.

The 308 delisted Bybit USDT perpetuals traded for a median of 440.6 days between listing and delisting on 2026-09-14 data, with an interquartile range of 231.0 to 785.7 days and a longest life of 1,653.7 days.
Every closed row carries both a `launchTime` and a `deliveryTime`, so the life of each delisted contract is a subtraction rather than an inference. Across all 308, the median life was 440.6 days, the interquartile range 231.0 to 785.7 days, and the longest 1,653.7 days. The deciles run 95, 183, 267, 347, 441, 554, 662, 915 and 1,261 days. 127 of the 308 lived less than a year and 225 less than two.
That matters because the intuitive defence of a live-roster universe is that the missing contracts were ephemeral listings with no usable history. On this board they were not. A contract with 441 days of price, funding and open interest behind it is exactly the kind of series a study wants, and half of the delisted set had more than that.
The other half of the defence is about money rather than time, and it is the half we cannot settle from these two calls, because a delisted contract has no turnover to read. We have published the general shape of that asymmetry before, in the Athenum post on stock perpetuals, which found that counting contracts and counting money can disagree sharply on the same board, and that individual names far down the tail each hold only a per cent or two of the open interest. It is reasonable to expect the delisted set skews the same way. Expecting is not measuring, so we are flagging the direction and leaving the magnitude open rather than borrowing a number from a different split.
What does that listing timestamp actually mean?
It is the venue's own listing record, not the moment the contract began trading, and on older contracts it is demonstrably a backfill.

Age on 2026-09-14 by each venue's own listing stamp: the interquartile ranges overlap so heavily that the medians of 630, 397 and 279 days are not three separated populations, and the three stamps are not the same measurement.
We checked the stamps against the world instead of trusting the field names, and two of the three fail. OKX dates BTC-USDT-SWAP to 2019-11-12, while OKX's own help pages put the launch of its USDT perpetual swaps at 2019-12-16, five weeks later.
Bybit can be checked against Bybit, which is better than checking it against a press report. The venue publishes a raw trade archive at `public.bybit.com/trading/`, one file per symbol per day, and the earliest file is the day the contract actually printed trades. Compare that against the `launchTime` the instrument endpoint returns for the same symbol on 2026-09-14:
Symbol | `launchTime` says | First file in Bybit's own trade archive | Error |
|---|---|---|---|
BTCUSDT | 2020-03-15 | 2020-03-25 | 10 days early |
LTCUSDT | 2018-01-01 | 2020-10-21 | 1,024 days early |
LINKUSDT | 2018-01-01 | 2020-10-21 | 1,024 days early |
XTZUSDT | 2018-01-01 | 2020-10-21 | 1,024 days early |
BCHUSDT | 2018-01-01 | 2020-12-14 | 1,078 days early |
ETHUSDT | 2021-03-15 | 2020-10-21 | 145 days late |
The last row is the one to keep, because it stops this being a story about one bad sentinel. ETHUSDT carries no suspicious value at all, and its stamp is still wrong, in the opposite direction: the venue says the contract launched almost five months after it was already printing trades. An error that runs both ways cannot be corrected by a floor or a plausibility filter.
Two OKX rows settle the question outright, because they are stamped before the asset existed. COMP-USDT-SWAP carries a listing time of 2020-04-21, and the COMP token did not begin distribution until mid June 2020. FIL-USDT-SWAP carries 2019-08-10, and the Filecoin mainnet did not launch until October 2020, fourteen months later. Both stamps fall at the identical second, 10:12:51, and that same second appears on 24 of the 464 USDT-settled swaps, spread across 10 different calendar dates. Real listings do not open at the same second across more than a year. That is a migration writing a value, not a venue recording an event.
Bybit's four 2018 outliers fail the same way and more simply. BCHUSDT, LINKUSDT, LTCUSDT and XTZUSDT carry a `launchTime` of exactly 1514764800000, midnight UTC on 2018-01-01. Bybit's own inverse board, which was its first product, has an earliest launch stamp of 2018-11-14, so those four USDT contracts would predate the venue's oldest contract of any kind by ten months. Excluding them moves the Bybit median, read on 2026-09-14, from 396.9 to 393.3 days and the oldest contract from 3,178.9 to 2,374.9 days. 53 of the 762 live Bybit rows sit at exact midnight, those four included, which is date-only precision rather than a timestamp.
So the honest reading of the chart above is narrower than it looks. The three medians of 629.9, 396.9 and 279.3 days are not one measurement taken three times: each is that venue's own record-keeping, the older rows are the least trustworthy, and the interquartile ranges overlap so heavily that ranking the venues would be reading a difference the dispersion does not support. What survives is the coarse bucket, because a stamp that is wrong by weeks or months still lands on the right side of a one year line: on 2026-09-14, 274 of OKX's 464 live USDT-settled swaps, 59 per cent, carry a listing record inside the past year, against 120 of Binance's 528, or 23 per cent.
Which way does survivorship push the age of the board?
Downward, which is the opposite of the intuitive answer, and Binance lets you measure a lower bound on it.
The reflex is that removing contracts leaves an older board, since the survivors have been around longer. Measured, it goes the other way, because delisting takes the stale alt-coin contracts that have been lingering for years rather than the recent listings. Binance's instrument list exposes 129 USDT-margined perpetuals in a `SETTLING` state, contracts on their way off the board right now, and their median age on 2026-09-14 is 880.3 days against 629.9 days for the 528 still trading. 58 per cent of the wind-down cohort is more than two years old against 41 per cent of the live board. Put the two together and the median moves from 629.9 to 662.4 days.
That 32.5 day correction is a floor, not the size of the effect, because it counts only the contracts still visible mid-removal and none of the ones already gone. Our Bybit numbers show how much bigger the full effect is: the live board has a median age of 396.9 days, and the live plus closed sets together have a median of 610.5. Bybit's default call returns no non-live row either, which is the whole reason this post has to ask it for `status=Closed` by name. OKX offers no such second call, so there the correction is not merely unmeasured, it is unmeasurable from the public endpoint.
Can you run this on Binance and OKX as well?
Not for the delisted half, and one of the two fails in a way that returns a confident answer rather than an error.
Binance's USD-M instrument list does carry a status field, and on 2026-09-14 it returned 766 `TRADING` symbols, 130 `SETTLING` and 1 `PENDING_TRADING`. The 129 USDT-quoted perpetuals among the `SETTLING` rows are the wind-down cohort used in the section above, and they are genuinely useful. They are not a history: nothing in that response describes anything already removed.
OKX is the trap, and the trap is subtler than a broken filter. Its instruments endpoint carries a `state` field on every row, which reads like something you can filter on. There is no such filter: OKX documents exactly four request parameters for that endpoint, `instType`, `seriesId`, `instFamily` and `instId`, and `state` is a response field only. Passing it therefore does nothing, and nothing tells you so. On 2026-09-14, `instType=SWAP` with no state returned 479 rows; with `state=expired`, `state=suspend` and `state=preopen` it returned 479 rows each time; and with `state=garbage123` it also returned 479 rows, HTTP 200, response code `0`. We compared the instrument identifiers across all five responses and the sets are identical, with every row reporting `state` as `live`. Dropping an unrecognised query parameter is ordinary behaviour for a REST API. The hazard is that the parameter looks like it should exist, so a reader can believe they are inspecting expired contracts while being handed the live board, with no failure signal anywhere.
Bitget completes the picture from the other direction. Its USDT-futures contracts call publishes a `launchTime` key on every row, and on 2026-09-14 that key was the empty string on all 786 of them. A field can be documented, present and useless, and the only way to find out is to look at the values rather than the schema.
So of the venues checked here, Binance, Bybit and OKX will date their live board, Bitget will not, and only Bybit will show you what it removed. Any number in this post about delisting is therefore a Bybit number, and we are not generalising it to the others.
What does a normalized cross-venue feed add to this?
It prices the one contract that is on every board, at one timestamp, with enough history behind each reading to show whether a gap between venues is a difference or a draw.

Athenum's normalized cross-venue feed for the settled hour stamped 2026-09-14 21:00 UTC: Bitcoin perpetual funding read 0.003108 per cent per 8 hours on Binance, 0.005586 on Bybit and 0.004830 on OKX, a spread of 0.002478 percentage points, against 167 hour medians of 0.006109, 0.005273 and 0.005912.
The Bitcoin perpetual is the one instrument listed on all three boards measured above where a cross-venue view is straightforward. It is not the oldest contract on all three: on OKX that is FIL-USDT-SWAP, stamped 2019-08-10 against the Bitcoin swap's 2019-11-12, which is one more reason to treat these stamps as records rather than history. For the settled hour stamped 2026-09-14 21:00 UTC, Athenum's normalized feed read funding of 0.003108 per cent per 8 hours on Binance, 0.005586 on Bybit and 0.004830 on OKX, a spread of 0.002478 percentage points between the dearest and the cheapest of the three. We quote the hour after it closed on purpose: the bar still in flight moved in every one of its four significant figures between consecutive pulls, so a live reading published to that precision does not reproduce even minutes later. The free funding rate calculator turns a per-interval rate like that into an annualized cost.
The dispersion behind those three readings is the reason to draw them as boxes rather than as a ranking. Over the trailing 167 closed hours the medians were 0.006109 per cent on Binance, 0.005273 on Bybit and 0.005912 on OKX, and each venue's own interquartile range is wider than the distance between any two of those medians. A single hour's ordering of three venues is a draw from overlapping distributions, and this hour's ordering is not last hour's. Hyperliquid is excluded from the chart and from those numbers because its board settles hourly rather than every eight hours, which is a different basis and not a comparable number.
How would you reproduce this?
Public calls, no key, and one subtraction. The full recipe, as run on 2026-09-14, uses Bybit's instruments endpoint twice, its public trade archive at `public.bybit.com/trading/` for the cross-check, the Binance and OKX instrument lists, Bitget's contracts call and Binance's server time:
1. Fetch Bybit's linear instruments with no status filter, and again with `status=Closed`. Keep the rows whose `contractType` is `LinearPerpetual` and whose `quoteCoin` is USDT. That gives 762 live and 308 closed. 2. Convert `launchTime` to a date on every row of both sets, and drop the four rows stamped exactly 1514764800000 if you want the extremes to be meaningful. 3. Pick a window. Keep every contract listed on or before the start of it, and from the closed set keep only those whose `deliveryTime` falls after that start, or you will count contracts that were already gone before your window opened. Survival is the live count over the total. 4. For the delisted only, subtract `launchTime` from `deliveryTime` to get how long each contract actually traded, and report the quartiles rather than the mean, because the distribution has a long right tail. Every quantile in this post uses the exclusive definition, Python's `statistics.quantiles`, which is not the default in NumPy or pandas: on the same 308 lifespans the two conventions give a third quartile of 785.7 and 777.2 days. Name your method or your reader will not reproduce you. 5. Do not try step 1 on OKX. It documents no `state` request parameter at all, so passing one is silently dropped and you get the live board with no indication that your filter did nothing.
Anchor every age on a venue clock rather than your own. We took the reference instant from Binance's server time endpoint and it agreed with OKX's to under a second, which costs one extra call and removes an entire class of error. And re-run the census rather than quoting ours: we measured the three boards twice, seven minutes apart on 2026-09-14, and got identical counts and identical medians both times, but the numbers in this post describe one day. The board moves, which is the whole subject.
Every figure above came out of endpoints that need no key: Bybit's instrument list for the graveyard, Binance's and OKX's for the boards, and Athenum's own normalized feed for the cross-venue funding, which reads Binance, Bybit, OKX, Bitget, Deribit and Hyperliquid side by side. The 34 calculators sitting next to that feed are free to use, and they ask for no account, no email address and no usage limits. If you would rather drive that feed than re-pull four instrument endpoints by hand every morning, a free 7 day Pro+ trial opens the terminal and asks for no card.
One terminal. All the data.
Liquidations, orderbook depth, whale walls & open interest from 4 exchanges, all real-time, in one place.
No credit card required
