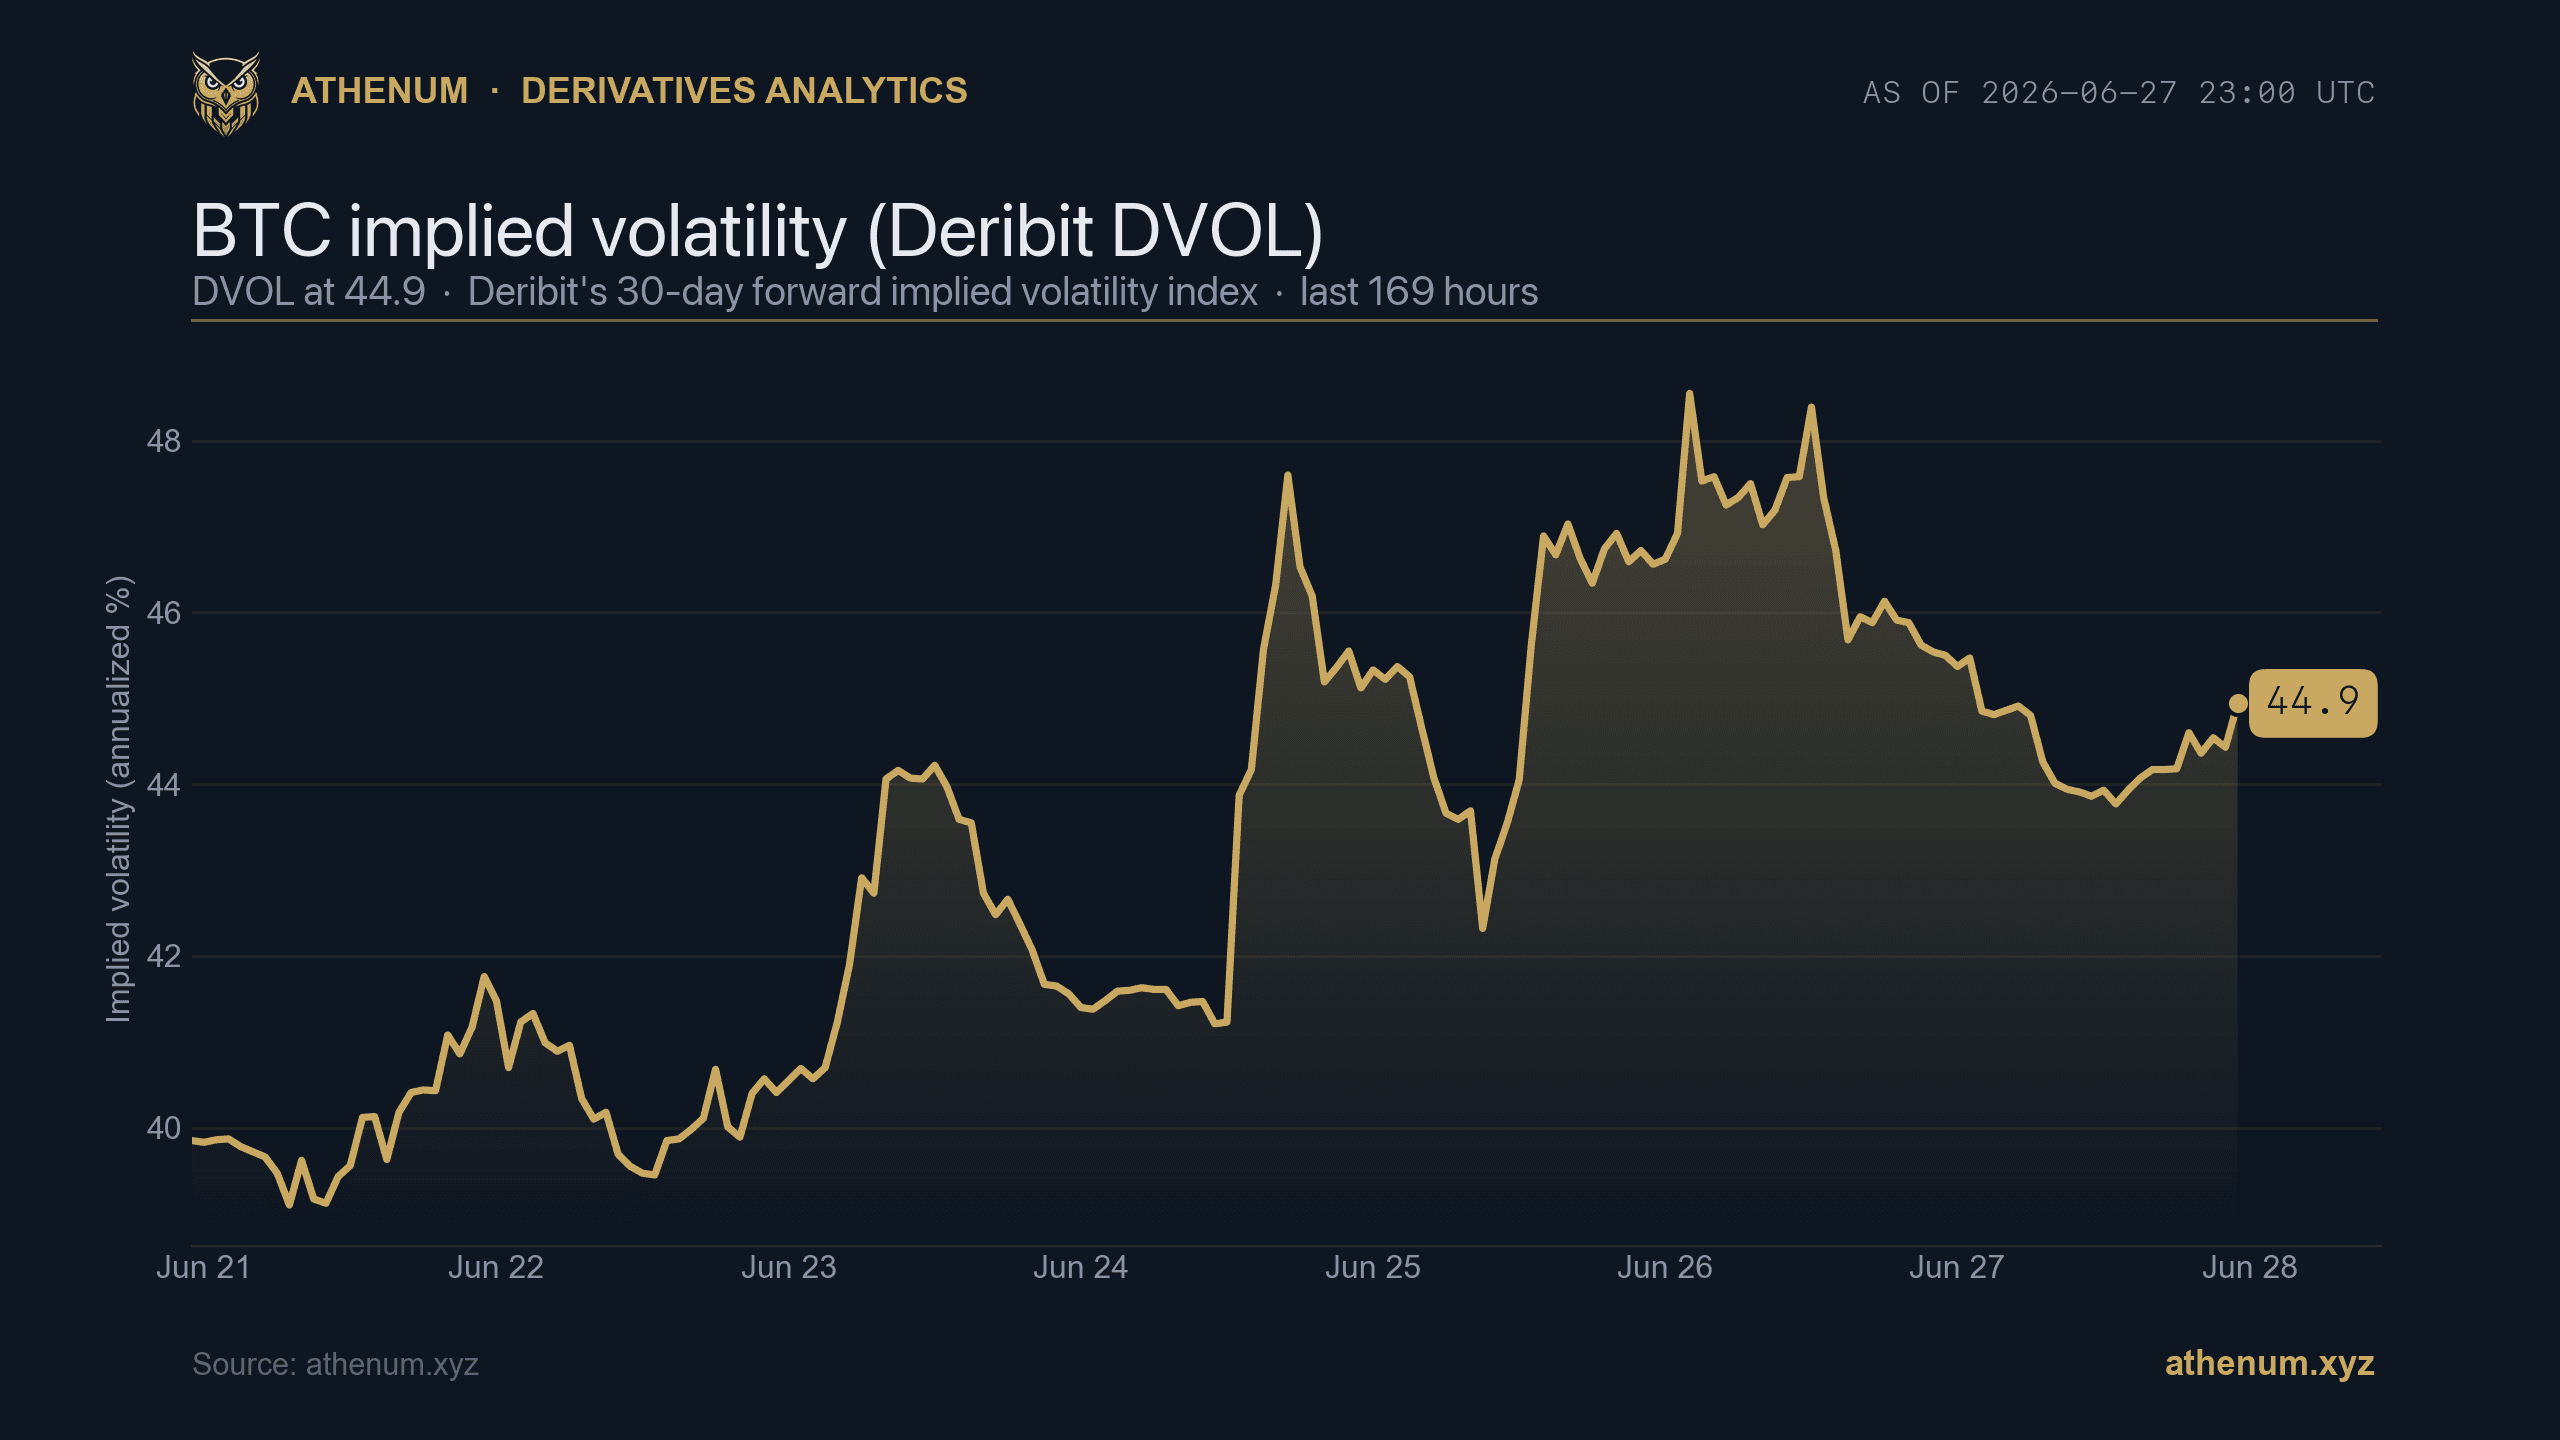
TLDR: Realized volatility is how much price actually moved in the past; implied volatility is how much the options market expects it to move next. Realized looks backward and is measured from price history; implied looks forward and is solved out of option prices. The gap between them, implied minus realized, is the volatility risk premium, and it tells you whether options are pricing in more movement than the market has been delivering. On 2026-06-27 the Deribit DVOL index for Bitcoin, the standard 30-day implied-volatility benchmark, read 44.9 after trading between roughly 38% and 49% across the prior day. This is education only, not a buy or sell call.
Volatility is the single most important input in an option's price, and crypto traders throw the word around as if it meant one thing. It means two. Realized volatility and implied volatility are different measurements pointing in opposite directions in time, and confusing them is how traders end up surprised when an option loses value even though they got the direction right. Here is the distinction, why the gap between the two matters, and how to read it without overreaching.
What is realized volatility?
Realized volatility, also called historical volatility, measures how much an asset's price actually moved over a past window. It is computed from the price series itself, typically as the annualized standard deviation of returns over, say, the last 7 or 30 days. Nothing about it is an opinion or a forecast; it is a description of what already happened. If Bitcoin chopped in a tight range for a month, its realized volatility is low. If it whipsawed 8% a day, realized volatility is high. It is the volatility you can verify after the fact by looking at the chart.
What is implied volatility?
Implied volatility is the market's expectation of future volatility, extracted from the prices traders are paying for options right now. You cannot observe it directly. You take an option's market price, an option-pricing model, and solve backward for the volatility figure that makes the model output match that price. That number is the implied volatility. Because it comes from live option prices, implied volatility is forward-looking and reacts instantly to fear, demand for protection, and upcoming events. The crypto market even has a standard benchmark for it: Deribit's DVOL index measures the 30-day forward-looking implied volatility for Bitcoin, the options-market equivalent of the equity world's VIX. On 2026-06-27 it read 44.9, near the middle of its 38% to 49% range for the day.

Athenum, BTC DVOL (30-day implied volatility) trading roughly 38% to 49% intraday with a put/call ratio of 0.58 on 2026-06-27. Implied is the windshield, not the rear-view mirror. athenum.xyz
Realized is the rear-view mirror. Implied is the windshield.
Realized vs implied volatility: side by side
Property | Realized volatility | Implied volatility |
|---|---|---|
Direction in time | Backward, what already happened | Forward, what the market expects |
Where it comes from | The price series itself | Live option prices, solved through a model |
Observable directly | Yes, verify it on the chart | No, inferred from option prices |
Reacts to | Past moves only | Fear, hedging demand, upcoming catalysts |
Common crypto gauge | Annualized standard deviation of 7d or 30d returns | Deribit DVOL, 30-day, which read 44.9 on 2026-06-27 |
Why does the gap between implied and realized volatility matter?
Because the gap tells you whether the options market is charging too much or too little for movement. The difference between implied and realized volatility over an option's life is the volatility risk premium. In crypto, as in most markets, implied has tended to sit above realized more often than not: options are, on average, priced for a bit more movement than actually shows up. That positive premium is the compensation option sellers demand for taking on the risk of being wrong, and it is why systematic volatility-selling strategies exist at all.
It is emphatically not free money. The premium is payment for tail risk: the seller collects small amounts most of the time and can lose a great deal in a single violent move, exactly the kind crypto specializes in. The premium can also vanish or invert. When realized volatility outruns what options priced, a sudden breakout or a liquidation cascade, implied can sit below realized, and the people who sold expensive options discover they were cheap.
How do traders read the two together?
By comparing what is priced against what is happening.
- Implied well above realized: options are relatively expensive. The market is bracing for more movement than it has lately delivered, often ahead of a known catalyst. Buying premium here only pays if future realized volatility actually rises to meet the price. - Implied below realized: options are relatively cheap. The market has been moving more than the options are pricing, and implied may simply not have repriced fast enough after a breakout. - Implied collapsing after an event: this is the classic IV crush. Implied volatility inflates ahead of a scheduled catalyst, an FOMC decision, an ETF ruling, a major unlock, and then deflates the moment the uncertainty resolves, even if price barely moves. Traders who bought options purely for the event can lose on the vol drop alone.
The useful habit is to read implied volatility in context: against its own recent range (is current IV high or low for this asset?) and against realized (is the market pricing more or less movement than it has been delivering?).
Why does the venue and aggregate view matter?
Implied volatility is read off option prices, and crypto options liquidity is concentrated on a few venues and uneven across expiries, so a single strike or exchange can paint a distorted picture. The discipline is to read the volatility picture against how the market is actually positioned. On 2026-06-27 the Bitcoin options board showed a put/call ratio of 0.55 against spot near $59,931, with the largest open interest, about $5.0B, clustered in the 25 December 2026 expiry and max pain at $72,000. Reading implied volatility next to that positioning, max pain, the put/call ratio and open interest by strike and expiry, keeps a single DVOL number honest.

Athenum, BTC options positioning on 2026-06-27: put/call ratio 0.55, max pain $72,000, and the largest open interest, about $5.0B, in the 25 December 2026 expiry. Read implied volatility against where positioning actually sits. athenum.xyz
The honest caveat
Volatility tells you how much, never which way. High implied volatility does not mean price will rise or fall, only that the market expects a bigger move in either direction. The realized-versus-implied gap is a measure of how richly movement is priced, not a trade signal on its own. Read it alongside funding, open interest and liquidity, treat the volatility risk premium as compensation for real tail risk rather than an edge, and remember that the move which erases a season of premium is exactly the one crypto is built to produce.
You can line up implied volatility against positioning and the rest of the 28 free tools, no login required, at athenum.xyz/tools. Athenum aggregates options and derivatives data across 14 exchanges, so you can read DVOL next to funding, open interest and liquidations in one place. Want the full terminal? Start a free 7-day Pro+ trial, no card required. Education only, not investment advice.
One terminal. All the data.
Liquidations, orderbook depth, whale walls & open interest from 4 exchanges, all real-time, in one place.
No credit card required

Athenum Analytics
Athenum Analytics is our three-person editorial team covering crypto derivatives, market data and macroeconomic context.