Table of Contents6 sections
- What is the risk/reward ratio and how do you calculate it?
- What win rate do you need to break even at each risk/reward ratio?
- Does leverage change your risk/reward ratio?
- How do you place a stop that sits inside your liquidation price?
- How do you size the position for a fixed 1 to 2 percent account risk?
- The bottom line
Practise with worked lessons
- Calculate trading expectancy after fees and slippage
Turn win rate and average wins and losses into net expectancy. Find the break-even win rate and see how fees and slippage can turn a 2R setup negative.
TLDR: The risk/reward ratio is the one number that decides whether a trading system makes money over time, and on a leveraged crypto position it also decides whether the trade is even survivable. This guide shows how to read the ratio, the win rate each ratio needs just to break even, and the rule most perpetual-futures traders miss: your liquidation price is a hard ceiling on how wide your stop can be. Everything is worked with a live Bitcoin example at about $62,800 on 2026-07-06, using the free Athenum risk/reward, leverage, liquidation, and position-size calculators.
What is the risk/reward ratio and how do you calculate it?
The risk/reward ratio compares what you lose if your stop is hit to what you gain if your target is reached. Written as 1:X, it means you risk one unit to make X. It comes from three prices you set before you enter, not from leverage:
Risk/reward = (target price - entry price) / (entry price - stop price)
Worked as a long Bitcoin trade at the 2026-07-06 price of about $62,800, on a $10,000 position:
- Entry $62,800, stop-loss $61,200, take-profit $66,000. - Risk is 2.55% of the move, or $254.78. Reward is 5.10%, or $509.55. - Risk/reward is 1:2.00. In R multiples, the target is a 2.00R win and the stop is your 1R.

A long BTC trade with entry $62,800, stop $61,200, and target $66,000: risk 2.55% ($254.78), reward 5.10% ($509.55), risk/reward 1:2.00, required win rate 33.3%.
What win rate do you need to break even at each risk/reward ratio?
Every ratio has a breakeven win rate, and the formula is simple: win rate = 1 / (1 + risk/reward). At 1:2 you only need to be right 33.3% of the time to break even before fees. The more reward you demand per unit of risk, the fewer trades you need to win:
Risk/reward | Breakeven win rate | How traders use it |
|---|---|---|
1:1 | 50.0% | Must win more than half of all trades |
1:1.5 | 40.0% | Common scalping target |
1:2 | 33.3% | Minimum for most swing setups |
1:3 | 25.0% | Popular with trend-followers |
1:4 | 20.0% | High-conviction setups near key levels |
1:5 | 16.7% | Rare, asymmetric trades |

Breakeven win rate = 1 / (1 + risk/reward). A 1:2 setup needs just 33.3% winners; a 1:3 needs only 25%.
This is why expectancy beats a high win rate. On the 1:2 example above, a 50% win rate returns +$0.50 for every $1 risked, and even a 40% win rate is still positive at +$0.20. Fees and slippage lift the real breakeven a little, so treat these numbers as floors, not targets. For the wider framework around this, read our complete risk-management playbook.
Does leverage change your risk/reward ratio?
No, and this is the most common mistake new perpetual-futures traders make. Your risk/reward is fixed by three prices (entry, stop, target), and none of them depends on leverage. The same 1:2 trade above is 1:2 whether you open it at 3x or 30x. Leverage changes only two things: how much margin the position ties up, and where your liquidation price sits. At 20x the trade needs $500 of margin; at 3x it needs about $3,333. The ratio is identical.

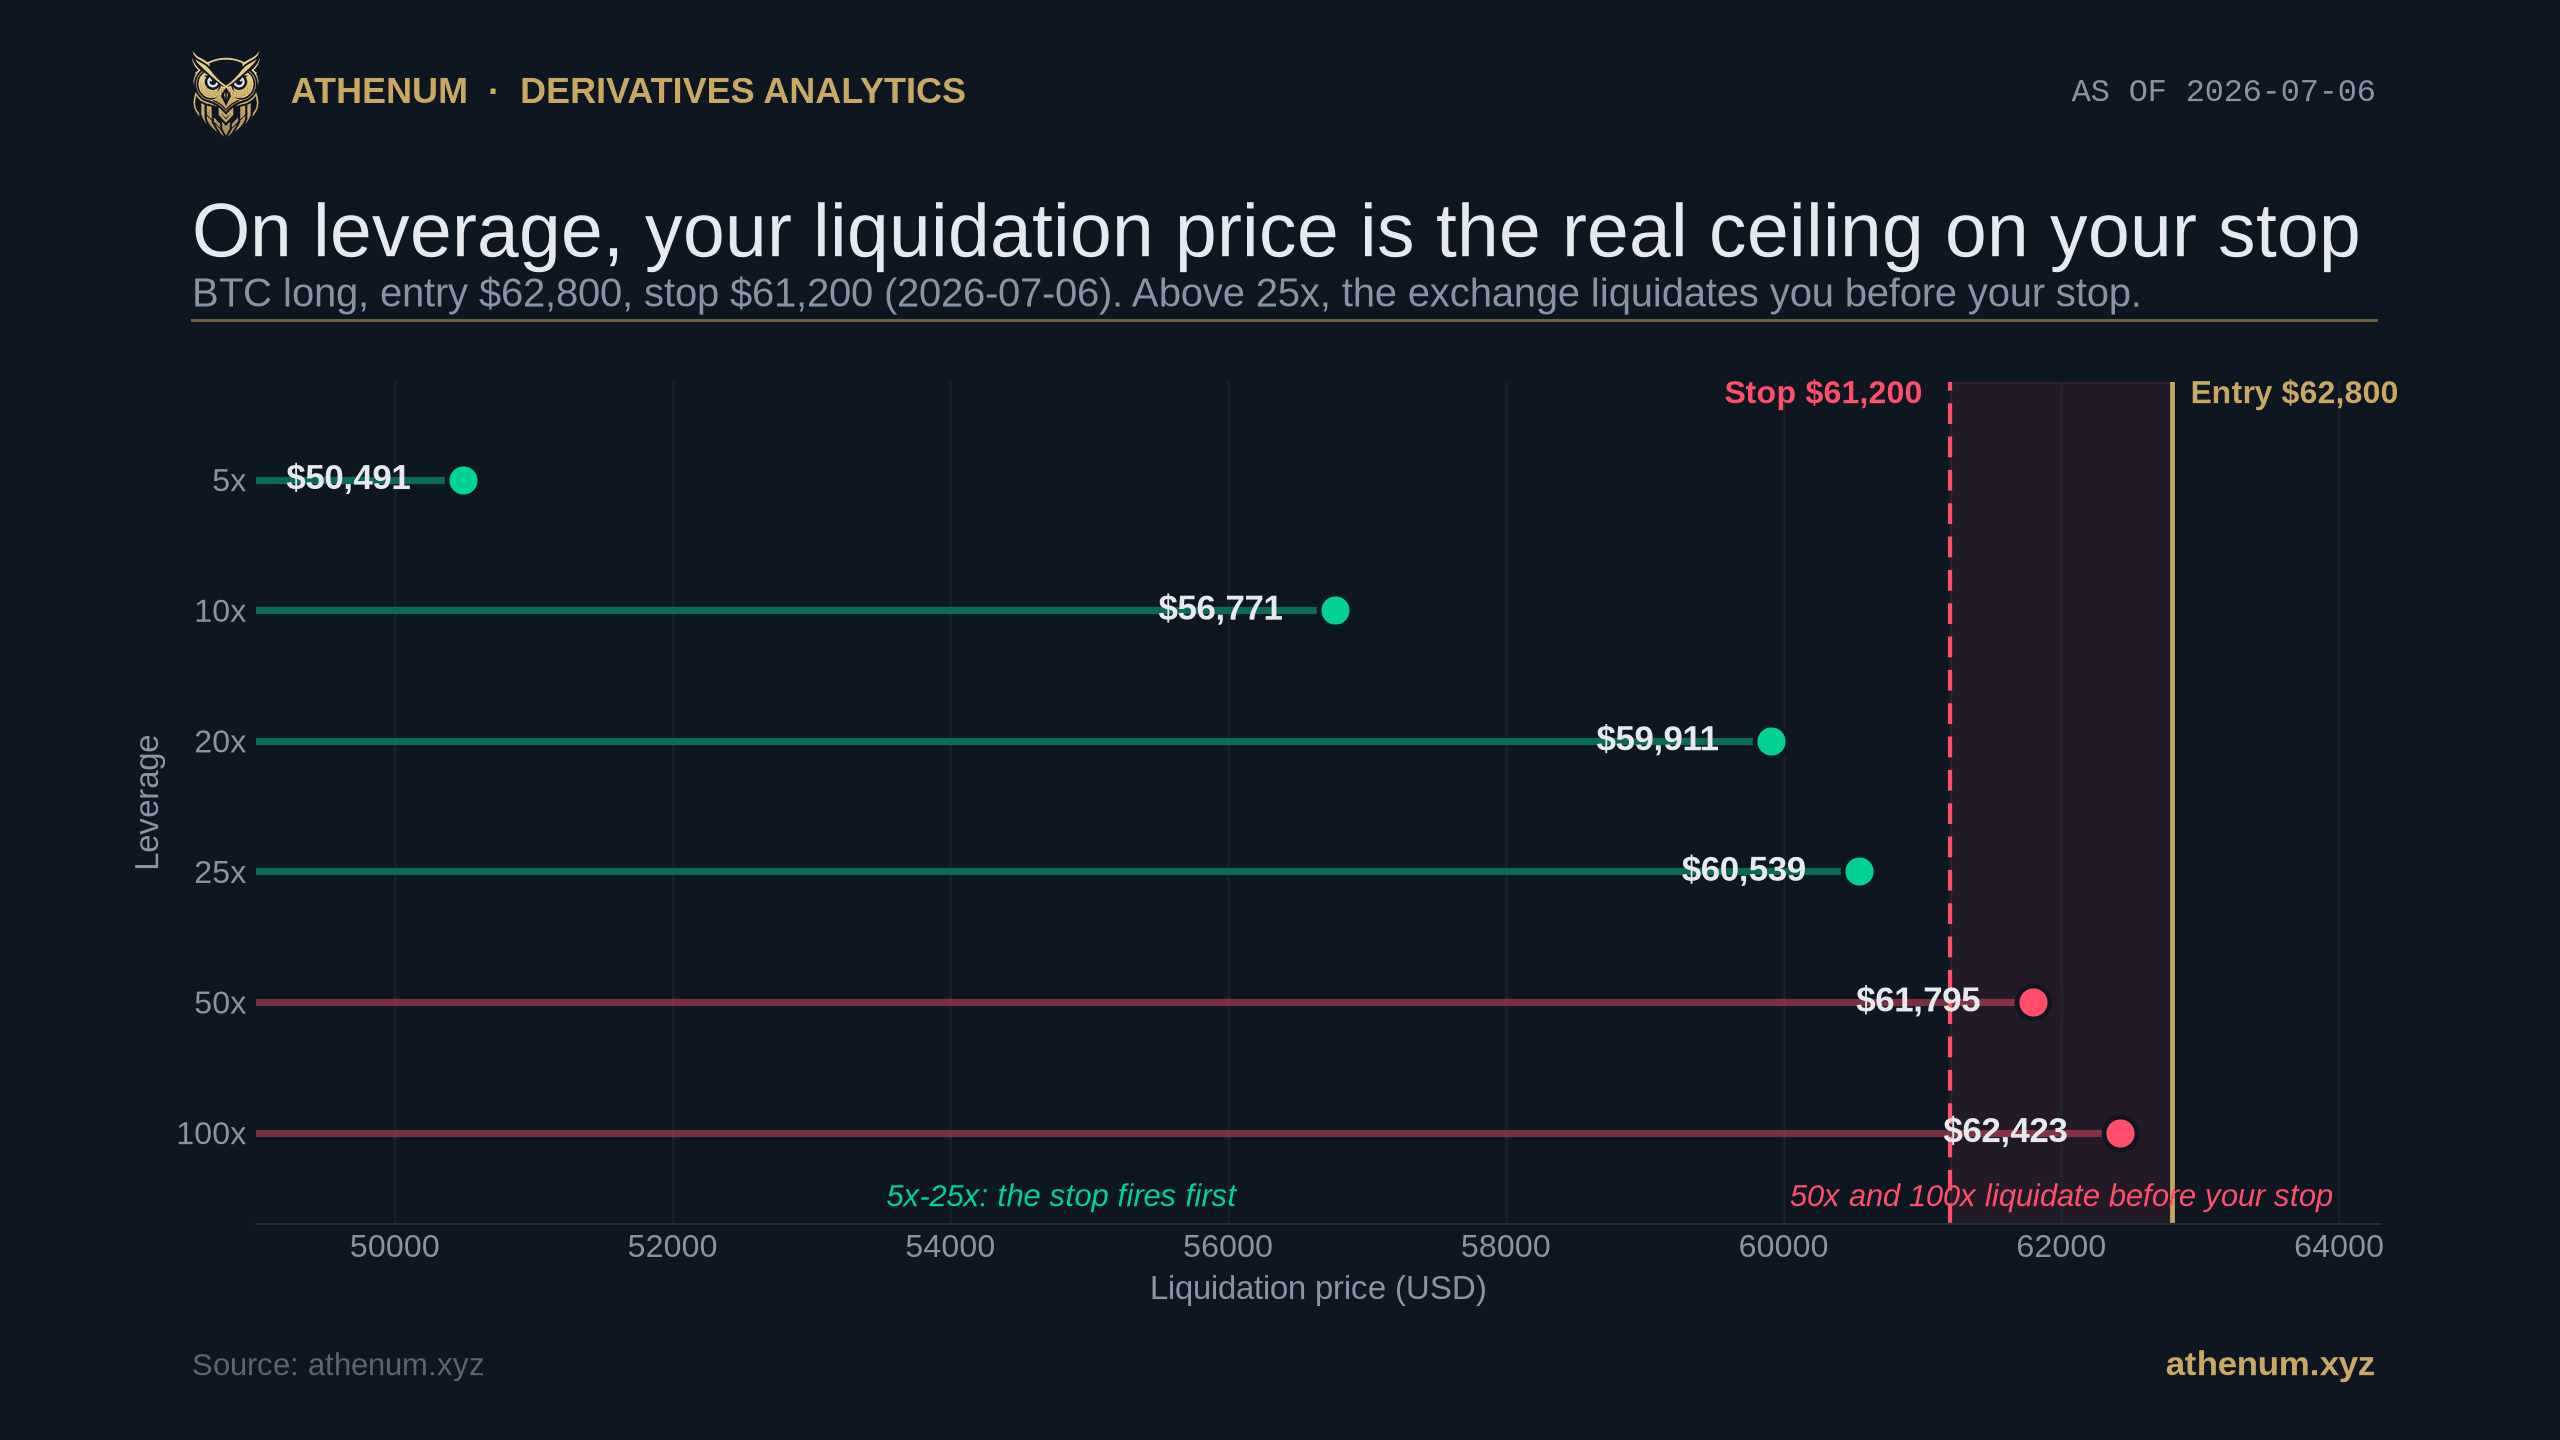
The same trade at 20x liquidates at $59,911.20, 4.60% below entry, safely under the $61,200 stop. The comparison table shows 50x liquidates at $61,795.20 and 100x at $62,423.20, both above the stop.
How do you place a stop that sits inside your liquidation price?
On a leveraged position the liquidation price is a hard wall. If price reaches it, the exchange closes the trade for you and takes the whole margin, stop-loss or not. So a valid trade needs its stop to trigger before the liquidation price, never after. Leverage decides whether that is even possible.
Take the same long (entry $62,800, stop $61,200) and read the liquidation price at each leverage:
- 20x: liquidation at $59,911.20, which is 4.60% below entry. The $61,200 stop sits above it, so the stop fires first. The trade is valid. - 50x: liquidation at $61,795.20. That is above the $61,200 stop, so the exchange liquidates you before your stop is ever reached. - 100x: liquidation at $62,423.20, just 0.60% from entry. Ordinary Bitcoin noise closes the position almost immediately.
Pick the leverage that keeps your liquidation price beyond your stop, not the maximum the exchange offers. Maintenance margin pulls that wall slightly closer than the naive 1/leverage distance (base-tier rates run roughly 0.4% to 0.5% on major venues like Binance and Bybit, and they rise as your position grows), so confirm the exact figure with the liquidation price calculator before sizing up. To see how these forced closes cluster and cascade in the real market, read how to read the liquidation heatmap.
How do you size the position for a fixed 1 to 2 percent account risk?
Professional risk control fixes the dollars you can lose first, then derives everything else in this order:
1. Set the risk budget. Risk 1% to 2% of account equity per trade. On a $20,000 account at 1%, that is $200. 2. Set the stop by structure, not by leverage. Place it where your idea is proven wrong, for example below support on a long. Measure the distance in percent; our example stop is 2.55% below entry. 3. Size the position. Position notional = risk budget / stop distance. So $200 / 0.0255 is about $7,840 of notional, and that number is independent of leverage. 4. Pick leverage last. Choose the lowest leverage that funds that notional and still keeps liquidation beyond the stop, then confirm it with the leverage calculator and the position size calculator.
Held perpetual positions also pay funding every 8 hours, a few percent a year on Bitcoin in a calm market, so budget that cost into longer holds. Do all of this before the trade, in writing. Start with the free risk/reward calculator.
The bottom line
Risk/reward tells you the win rate your system needs, and on leverage it also tells you whether a trade can survive to its target. Keep the ratio at 1:2 or better, keep the stop inside the liquidation price, and let position sizing, not the leverage slider, cap your loss. Athenum aggregates live derivatives data across 14 exchanges and gives away 34 free calculators, with no account, no email, and no usage limits. Start a free 7-day Pro+ trial of the full Athenum terminal, no card required.
One terminal. All the data.
Liquidations, orderbook depth, whale walls & open interest from 4 exchanges, all real-time, in one place.
No credit card required

Athenum Analytics
Athenum Analytics is our three-person editorial team covering crypto derivatives, market data and macroeconomic context.