Table of Contents7 sections
- What is the difference between daily and cumulative ETF flows?
- Why does a single day of outflows not mean the trend has turned?
- How do Bitcoin and Ether ETF flows compare right now?
- What do the futures basis and funding add to the flow picture?
- Daily flow vs cumulative base vs carry: side by side
- How do you read ETF flows in practice?
- The short version
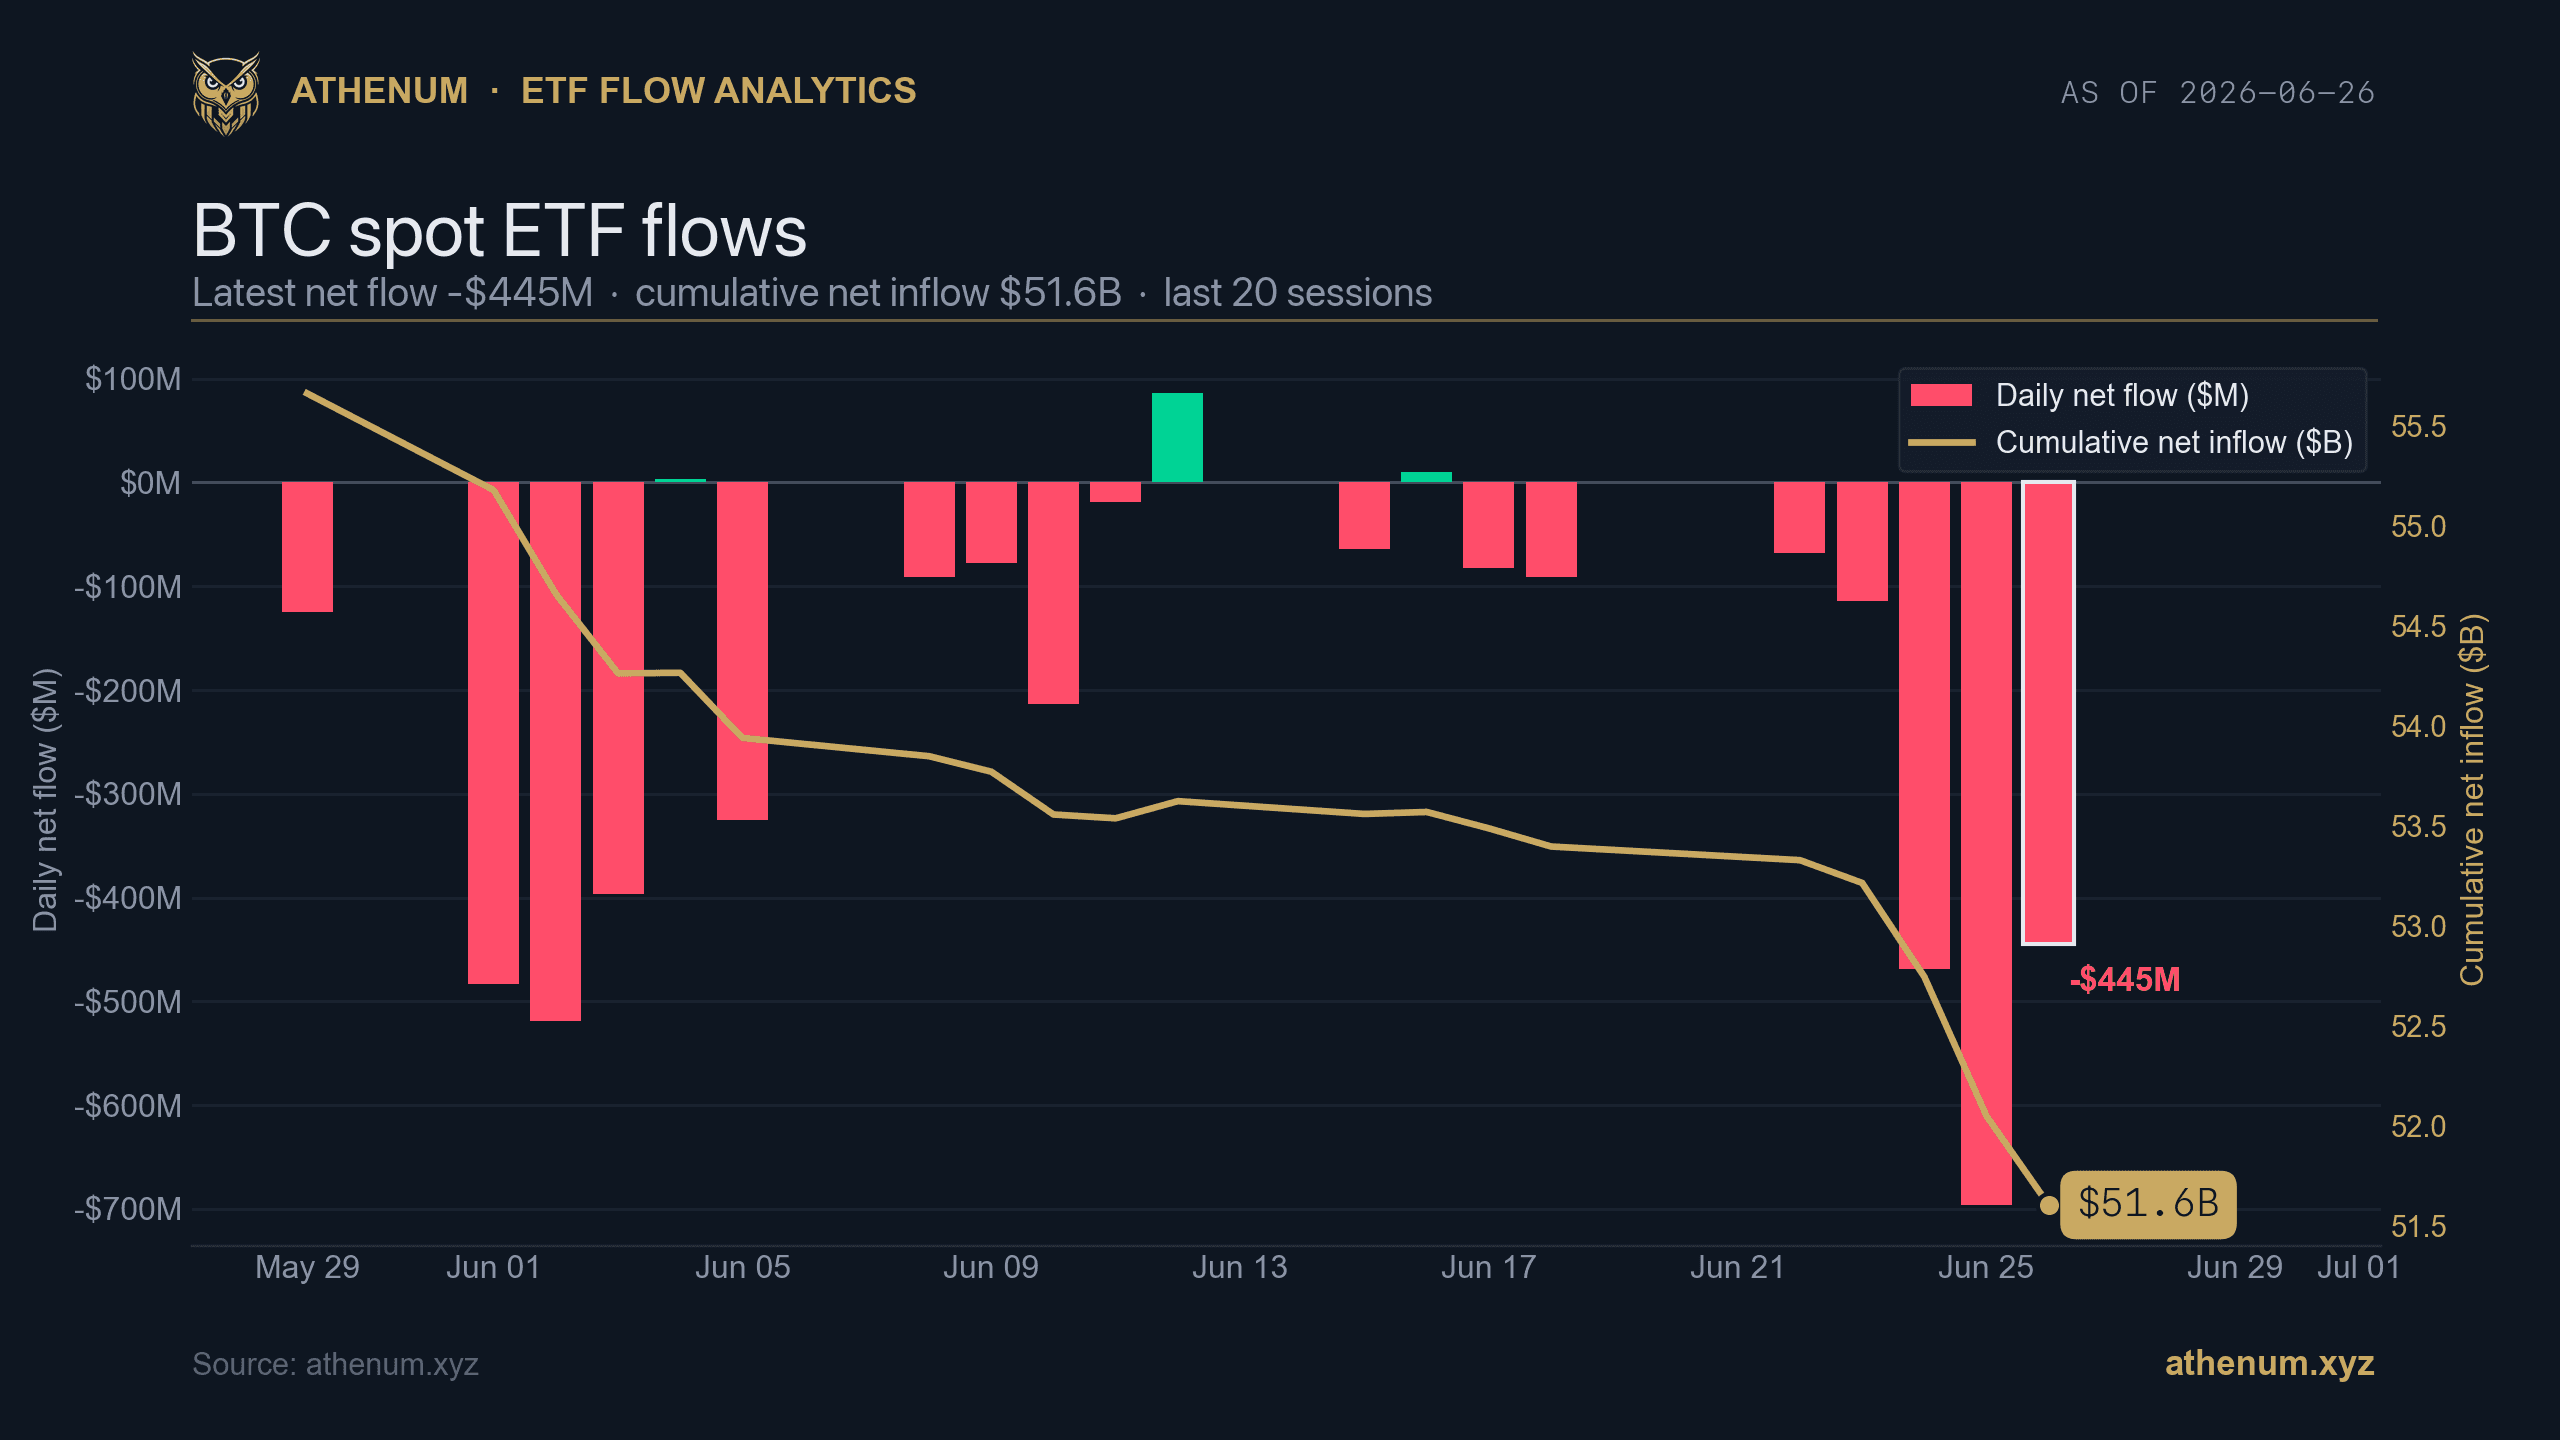
TLDR: A spot ETF flow number comes in two forms that get confused constantly: the daily net flow, which is how much money entered or left the funds in a single session, and the cumulative net flow, which is the running total since the funds launched. They answer different questions, and reading the daily figure as if it were the trend is how a single red session gets mistaken for a regime change. On 2026-06-26 the US spot Bitcoin ETFs printed a daily net outflow of $445M, yet their cumulative net inflow still stood at $51.6B. Ether spot ETFs were quieter, a $13M daily outflow against a $10.9B cumulative base. At the same time the BTC futures curve was in calm contango, spot $60,076 versus a far contract at $62,450 (+4.0% annualized, 2026-06-28 00:53 UTC), which is not the carry you see when flows are truly capitulating. This is education only, not a buy or sell call.
Spot ETF flows became the most watched demand gauge in crypto the moment the funds launched, and also the most over-reacted-to. A single session of outflows lands as a headline, the cumulative base that dwarfs it does not. The honest read pairs the daily number with the cumulative base, compares Bitcoin against Ether, and checks the flow story against what the derivatives market is actually pricing.
Here is what the two flow numbers mean, why one red day is not a trend, how BTC and ETH compare, and what the futures basis adds to the picture.
What is the difference between daily and cumulative ETF flows?
Daily net flow is creations minus redemptions for a single session, the net dollar amount that entered or left the funds that day. Cumulative net flow is the sum of every daily figure since inception, the standing balance of money that has stayed in. The daily number is volatile and headline-friendly; the cumulative number moves slowly and tells you the size of the base. On 2026-06-26 the Bitcoin funds saw a $445M daily outflow, but cumulative net inflows were $51.6B, so that one session moved the standing base by under one percent. A daily figure is a data point. The cumulative figure is the trend, and the two should never be read as the same thing.
Why does a single day of outflows not mean the trend has turned?
Because flows are noisy at the daily scale and the base is large. The trailing sessions in the chart above are a mix of red and green, with the cumulative line drifting rather than collapsing, even with the $445M outflow on the last session. A trend change shows up as a sustained run of same-direction sessions that bends the cumulative line, not as one large bar. The discipline is to ask whether the cumulative slope has actually turned, and to read a single daily print as one observation inside a noisy series. One $445M session against a $51.6B base is noise until several sessions line up the same way.
How do Bitcoin and Ether ETF flows compare right now?

Athenum, ETH spot ETF flows. The last session was a $13M net outflow against a $10.9B cumulative base, a much smaller pool than Bitcoin's, as of 2026-06-26. athenum.xyz
They move together in direction more often than not, but the scale is very different. On 2026-06-26 the Ether funds posted a $13M daily outflow against a $10.9B cumulative base, while the Bitcoin funds posted a $445M daily outflow against a $51.6B base. Ether's smaller base means a given dollar flow is a larger share of the pool, so ETH flow swings can look sharper in percentage terms even when the dollar number is small. Reading them side by side keeps you from mistaking a small absolute ETH number for a different market regime, and from treating BTC and ETH demand as one undifferentiated bid.
What do the futures basis and funding add to the flow picture?

Athenum, BTC futures term structure in contango: spot $60,076 versus the far dated contract at $62,450, about +4.0% annualized, as of 2026-06-28 00:53 UTC. Calm positive carry, not capitulation. athenum.xyz
A flow read is stronger when it agrees with the derivatives market. On 2026-06-28 the BTC futures curve was in gentle contango, with spot at $60,076 and the far dated contract at $62,450, an annualized basis of about +4.0%. The perpetual was paying a positive +4.16% annualized funding rate on $2.77B of open interest (2026-06-27 16:00 UTC). That combination, positive basis and positive funding, is the profile of a market with calm long demand still paying to be long, not one being violently de-risked. If ETF outflows were the start of a real unwind, you would expect the basis to flatten or invert and funding to turn negative. Here the carry stayed positive, which is context the daily flow number alone cannot give you.
Daily flow vs cumulative base vs carry: side by side
Signal | What it answers | The 2026-06 read |
|---|---|---|
Daily net flow | Did money enter or leave today | BTC -$445M, ETH -$13M (2026-06-26) |
Cumulative net flow | How big is the standing base | BTC $51.6B, ETH $10.9B |
Futures basis | Is leverage paying to be long | +4.0% annualized contango (2026-06-28) |
Perp funding | Is the perp bid or offered | +4.16% annualized, $2.77B OI (2026-06-27) |
The four lines answer four different questions. The daily flow is the loudest and the least informative on its own; the cumulative base sets the scale; the basis and funding say whether leverage agrees with the flow story. When the daily print is red but the cumulative base is intact and the carry is still positive, the honest description is a quiet pullback in demand, not a turn.
How do you read ETF flows in practice?
Read the daily number against the cumulative base first, then compare Bitcoin against Ether, then check the futures basis and funding for agreement. A red daily print with an intact cumulative base and positive carry is noise; a sustained run of outflows that bends the cumulative line and drags the basis toward inversion is the thing actually worth flagging. Treat any single session as one observation, never the trend, and let the slow-moving series and the derivatives carry tell you whether something has really changed.
You can line up ETF flows, the futures basis and funding next to the rest of the 28 free tools, no login required, at athenum.xyz/tools. To put a funding number on your own size and venue, use the free funding rate calculator; for the mechanics of trading the basis itself, see the cash and carry trade. Athenum aggregates derivatives and market data across 14 exchanges, so flows, basis and funding sit in one view. Want the full terminal? Start a free 7-day Pro+ trial, no card required.
The short version
Spot ETF flows come as a noisy daily number and a slow cumulative base, and only the second one is a trend. On 2026-06-26 a $445M Bitcoin outflow and a $13M Ether outflow landed against cumulative bases of $51.6B and $10.9B, while the BTC futures curve held a calm +4.0% contango and funding stayed positive. Read daily against cumulative, BTC against ETH, and flows against the carry, and a single red session stops looking like a regime change. Education only, not investment advice.
One terminal. All the data.
Liquidations, orderbook depth, whale walls & open interest from 4 exchanges, all real-time, in one place.
No credit card required

Athenum Analytics
Athenum Analytics is our three-person editorial team covering crypto derivatives, market data and macroeconomic context.