Practise with worked lessons
- Calculate cumulative volume delta from a trade tape
Reconstruct CVD from a trade tape: four trades, 0.7 BTC of net aggressive buying. Check side classification, units and reset times before reading a divergence.
Most crypto charts show you one number for volume. That number hides the most important question in order flow: who was in a hurry. Taker versus maker flow answers it. Read together with Cumulative Volume Delta and the order book, it tells you whether a move has real aggression behind it or is just drifting on thin offers.
What is the difference between taker flow and maker flow?
A taker is an aggressive participant. They send a market order (or an immediately executable limit order) that fills against orders already resting in the book. They remove liquidity and accept the current price to get filled now. A maker is passive. They post a limit order that sits in the book and waits for someone to come to their price. They add liquidity.
Exchanges price this split directly. As of 2026, crypto exchange trading fees run roughly 0 to 0.60 percent on the maker side and 0.04 to 1.20 percent on the taker side, depending on venue, product, and 30-day volume. On Coinbase Advanced the entry tier is 0.60 percent maker against 1.20 percent taker, so posting a limit order instead of crossing the spread can halve your fee (Coinbase / Cryptonews fee surveys, 2026).
The crucial point for reading flow: only the taker has directional intent that the data can sign. A maker who posts a bid is not betting on direction in a way the tape records. The taker who lifts that bid is the one expressing aggression, and that is the side order-flow analysis tracks.
How do takers build Cumulative Volume Delta (CVD)?
CVD is the running total of aggressive buying minus aggressive selling. Every trade is classified by which side was the taker: a market buy that lifts the offer adds to CVD, a market sell that hits the bid subtracts from it. Maker volume does not move CVD on its own. A resting limit order only counts once an aggressive counterparty fills it, and then it is the taker's direction that gets signed (BackQuant, Bookmap, 2026).
This is why CVD differs from ordinary volume. Volume tells you how much traded. CVD tells you which side was aggressive. Two candles can print identical volume yet opposite CVD: one where buyers lifted offers all session, one where sellers hit bids the whole time.
Aspect | Taker flow | Maker flow |
|---|---|---|
Order type | Market or marketable limit | Resting limit |
Effect on book | Removes liquidity | Adds liquidity |
Typical fee (2026) | Higher (up to ~1.20%) | Lower (down to ~0%) |
Signed direction | Yes (buy or sell) | No, until filled |
Drives CVD | Yes | No |
One discipline before you read CVD: the absolute value is meaningless. CVD depends on where you started counting. What matters is slope, divergence against price, and behavior at known levels.
What does taker dominance signal?
Taker dominance is simply more aggressive volume on one side than the other over a window. The cleanest public proxy is the taker buy/sell ratio. Binance's futures endpoint `takerlongshortRatio` returns `buySellRatio`, `buyVol`, and `sellVol` across periods from 5m up to 1d, covering the latest 30 days, capped at 1000 requests per 5 minutes (Binance API docs, accessed 2026). A ratio above 1 means takers are buying more aggressively than selling.
For context, Ethereum's taker buy/sell ratio surged to about 1.13 in Q4 2025, a reading that coincided with heavy derivatives deleveraging and was read as a shift toward aggressive demand (Ainvest, late 2025). Rising CVD with a ratio above 1 says buyers are paying up to get filled, which supports a continuation read. Falling CVD with a ratio below 1 says sellers are hitting bids, which supports a downside read.
Taker dominance is most reliable in liquid markets such as major pairs. In thin altcoins, a handful of aggressive orders can swing CVD erratically, so the signal is far noisier there.
How do you read taker flow against price?
The highest-value use of taker flow is divergence against price. Aligned flow confirms; divergence warns.
1. Frame the window. Compare price and CVD over the same lookback, for example one session or one swing. 2. Confirmation. Price makes a higher high and CVD makes a higher high. Aggressive buyers are still lifting offers, so the move has fuel behind it. 3. Bearish divergence. Price makes a new high but CVD makes a lower high or stalls. Buyers are no longer lifting offers as hard, even though price is being pushed up, often by thin offers or passive flow. This is classic exhaustion near a top (Bookmap, CoinGlass, 2026). 4. Bullish divergence. Price makes a lower low but CVD makes a higher low. Aggressive selling is fading into the lows. 5. Absorption. CVD surges one-sided yet price refuses to move. A large passive maker is absorbing the aggression. When aggressive flow cannot break a level, the resting liquidity at that level is the dominant force.
Where does the resting liquidity actually sit? That is the maker side of the picture, and it is why flow reads best next to the book. A wall of bids that keeps absorbing aggressive selling is a maker defending a level. In Athenum you can line up CVD with the Athenum order book and whale walls so a CVD divergence is read against the exact depth that is absorbing it, rather than in isolation.
How does Athenum show taker flow and CVD?
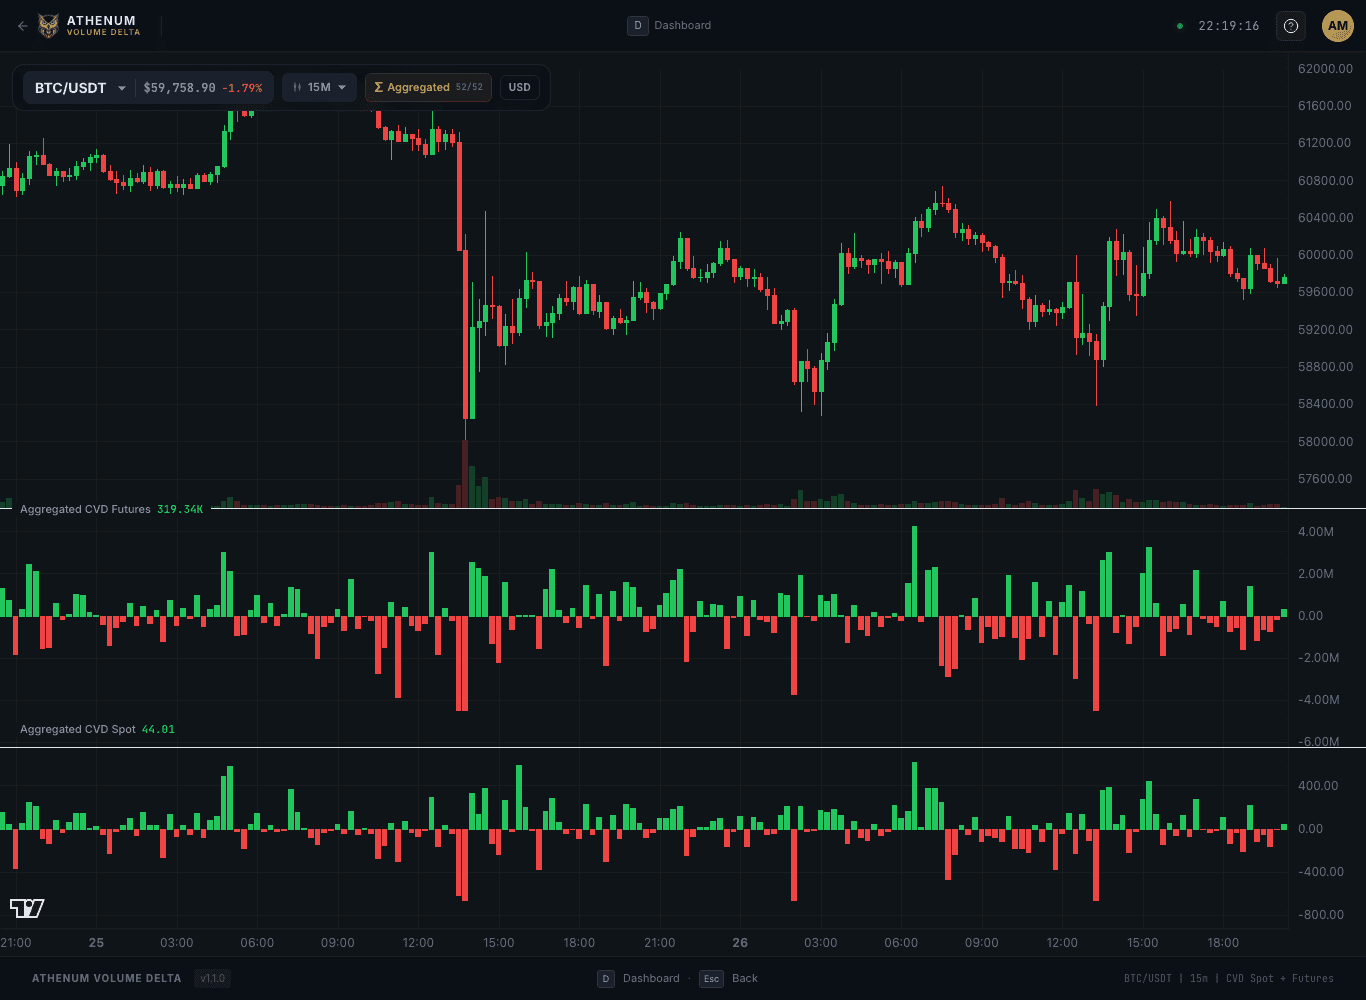
Athenum aggregates derivatives and order-flow data across 14 exchanges, so CVD is built from aggregated aggressive flow rather than a single venue's tape.

Athenum aggregated Cumulative Volume Delta for BTC/USDT: the CVD futures and CVD spot panels sign aggressive buying minus selling beneath the price candles. Source: Athenum.
You can read CVD beside the live order book and whale walls (orderbook depth), the liquidation heatmap, funding, open interest, and basis, which lets you separate a real aggressive push from a drift into thin liquidity.
Athenum is live and self-serve with a real 7-day Pro+ free trial, no card required. You can open the CVD and order-book view and start reading taker flow in a few minutes.
For the wider toolkit, see how open interest differs from volume, and use the free leverage calculator to size a position once your flow read is in. Athenum also ships 28 free /tools calculators alongside the live charts.
Quick answers
What is the difference between a taker and a maker? A taker removes liquidity with a market order and pays a higher fee. A maker adds liquidity with a resting limit order and pays a lower fee.
Why does only taker flow build CVD? Because only the aggressive side can be signed as a buy or a sell at execution. Resting maker orders are not directional until a taker fills them.
What does a CVD divergence mean? Price and aggressive flow disagree. A new price high without a new CVD high warns that aggressive demand is fading, a common exhaustion signal near tops.
One terminal. All the data.
Liquidations, orderbook depth, whale walls & open interest from 4 exchanges, all real-time, in one place.
No credit card required

Athenum Analytics
Athenum Analytics is our three-person editorial team covering crypto derivatives, market data and macroeconomic context.