The derivatives market is the engine room of cryptocurrency price discovery. In 2026, relying purely on spot volume or basic technical analysis is a guaranteed path to being offsides. The sophisticated trader needs visibility into positioning, leverage, and order flow. However, the ecosystem of tools built to provide this visibility suffers from a critical flaw: fragmentation.
Traders are routinely forced to stitch together funding rates from one platform, liquidation heatmaps from another, and macro context from a third. This disjointed workflow introduces latency, context-switching costs, and ultimately, missed execution windows. We term this the "Fragmentation Tax." The cost is not just time. It is the degraded signal quality that comes from analyzing data in isolation, without the cross-domain context that separates a trade idea from a high-conviction position.
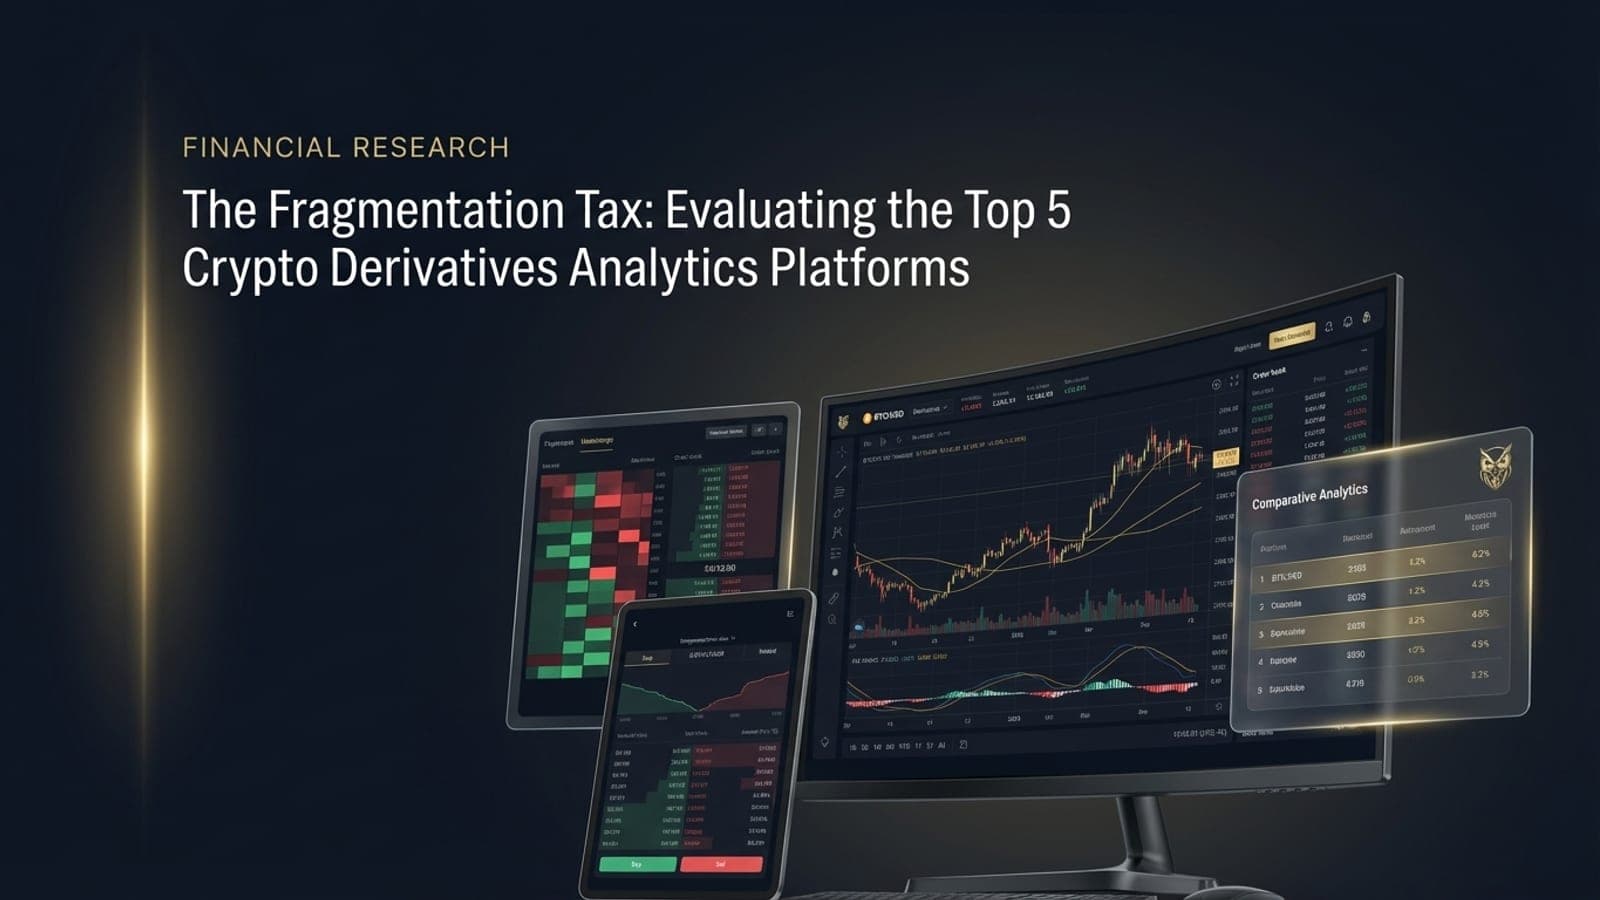
This analysis evaluates the top five crypto derivatives analytics platforms: Coinglass, Hyblock Capital, TradingLite, Coinalyze, and Glassnode. We assess their core utility, structural limitations, pricing, and the specific dimension of the fragmentation tax each one imposes on the systematic trader. The goal is not to dismiss any tool, but to map the full picture of what each platform provides and what it leaves out.
The Competitive Landscape at a Glance
Before diving into each platform, the following table maps the core feature coverage across all five tools. This is the clearest way to visualize where the gaps are and why no single competitor currently solves the full problem.
Feature | Coinglass | Hyblock | TradingLite | Coinalyze | Glassnode |
|---|---|---|---|---|---|
Aggregated OI (multi-exchange) | Yes | Yes | No | Yes | Partial |
Funding Rates (real-time) | Yes | Yes | No | Yes | No |
Liquidation Heatmaps | Yes | Yes | Yes | No | No |
Order Book Depth | No | Yes | Yes | No | No |
Footprint / CVD Charts | No | Yes | Yes | No | No |
Backtesting Lab | No | Yes | No | No | No |
On-Chain Analytics | No | No | No | No | Yes |
Macro Indicators (VIX, rates) | No | No | No | No | Partial |
CME Gap Tracking | No | No | No | No | No |
ETF Flow Data | No | No | No | No | No |
API Access (affordable) | Yes | $399/mo | No | Free | $999/mo |
Exchange Coverage | 29+ | 10+ | 15+ | 15+ | On-chain only |
The table makes the problem explicit. Every platform covers a subset of the analytical stack. None of them unify macro regime data with derivatives microstructure, a gap that Athenum addresses directly. The trader who wants all of these signals is forced to maintain multiple active subscriptions and switch between them in real time.
1. Coinglass: The Data Aggregator

Coinglass has established itself as the default entry point for retail and semi-professional traders seeking derivatives data. Its primary value proposition is breadth: aggregating open interest (OI), funding rates, and liquidation data across 29+ exchanges.
The platform excels at providing a macro view of leverage. When a trader needs to know the aggregate OI across Binance, Bybit, and OKX, Coinglass delivers this efficiently. Its liquidation heatmaps, while basic, provide a functional visual representation of where leveraged positions are clustered. The pricing structure is accessible, with a free tier covering most core data and a paid tier unlocking historical depth and API access.
However, Coinglass is fundamentally a data aggregator, not an execution intelligence terminal. It lacks the micro-structural depth required for precise entry and exit timing. During high-volatility events, the platform's UI often struggles, with different modules loading asynchronously and creating a disjointed view when milliseconds matter. More critically, Coinglass provides the "what" (e.g., OI is rising) but not the "how" (e.g., is it driven by aggressive market buying or passive limit absorption?). The platform operates in a crypto vacuum, offering zero visibility into Federal Reserve liquidity, yield spreads, or traditional finance correlations that dictate broad market regimes.

2. Hyblock Capital: The Heatmap Specialist

Hyblock Capital targets the semi-professional to professional segment, heavily marketing its predictive liquidation heatmaps and TradingView-integrated indicators. The platform attempts to map where market makers are likely to drive price to trigger liquidation cascades. It also offers a suite of order flow indicators including Cumulative Volume Delta (CVD) and average trade size, alongside a backtesting lab that allows systematic traders to quantify the edge of specific setups.
While Hyblock provides deeper micro-structural insights than Coinglass, it remains structurally incomplete. The Professional tier, required for meaningful API access with 3-month historical data, costs $399/month. This pricing structure creates a steep barrier for independent quantitative builders. The core liquidation heatmaps are predictive models, not raw order book data. They estimate where liquidations should occur based on assumed leverage profiles, introducing model risk that is not always disclosed clearly. Like Coinglass, Hyblock provides no integration with macroeconomic data, forcing the trader to maintain separate terminals for VIX, DXY, and rate probability tracking.

3. TradingLite: The Order Flow Visualizer
TradingLite approaches the market entirely from the perspective of order flow and market microstructure, focusing on footprint charts and real-time liquidity heatmaps. For the pure scalper, it is highly effective. It visualizes the order book in real-time, highlighting absorption and exhaustion at specific price levels. The platform allows traders to see exactly where large limit orders are resting and whether aggressive market orders are successfully chewing through them.
TradingLite is the most specialized tool on this list, which inherently makes it the most fragmented. The platform has a documented history of maintenance downtime and lag during extreme volatility, precisely when order flow visualization is most critical. TradingLite does not aggregate funding rates, global open interest, or long/short ratios. It is entirely blind to the broader derivatives context. By focusing exclusively on the micro-level, the platform obscures the macro regime. A trader might execute a perfect order flow setup on a 1-minute chart, completely unaware that a major macro data release just shifted the broader market bias. Athenum addresses this by placing macro context alongside order flow data in a single terminal.
4. Coinalyze: The Budget Screener

Coinalyze serves as a functional, no-frills screener for futures data, offering a clean, tabular view of OI, funding rates, and liquidations. The platform is fast, lightweight, and offers a highly affordable ad-free tier at $10.95/month. It is effective for quickly screening across assets to find extreme funding rates or significant OI shifts.
Coinalyze's utility is capped by severe data limitations. The platform only retains the latest 1,500-2,000 intraday data points by default. This makes it impossible to conduct meaningful historical backtesting or regime analysis on lower timeframes. It lacks order flow visualization, predictive heatmaps, options data, and macro integration. The free version is heavily ad-supported, creating a disruptive user experience that degrades focus during active trading sessions.

5. Glassnode: The On-Chain Institutional Standard

Glassnode is the pioneer of on-chain analytics, utilizing clustering algorithms to map entity behavior, exchange flows, and wallet profitability. For macro-level crypto analysis, Glassnode is unparalleled. It provides deep visibility into the behavior of long-term holders versus short-term speculators, offering a fundamental baseline for market cycles. The platform is trusted by institutional names including Binance, CME Group, Grayscale, and ARK Invest.
Glassnode is built for researchers and allocators, not active derivatives traders. The Professional tier costs $999/month, placing it firmly out of reach for most independent traders. API access is an additional cost on top of that. On-chain data is inherently delayed by block confirmation times. It cannot provide the millisecond-level order flow or funding rate shifts required for execution. While Glassnode has recently added basic derivatives data, it lacks the granular order book depth, footprint charts, and real-time liquidation heatmaps necessary for tactical positioning.

Pricing and Coverage Summary
The following table provides a direct comparison of pricing tiers and exchange coverage, which is the second dimension of the fragmentation tax. Traders who need full coverage across all five tools face a minimum monthly cost of approximately $560 for the mid-tier subscriptions alone, before accounting for the cognitive overhead of managing five separate interfaces.
Platform | Free Tier | Entry Paid Tier | Professional Tier | Exchange Coverage |
|---|---|---|---|---|
Coinglass | Yes (limited) | ~$30/mo | Custom | 29+ |
Hyblock Capital | Yes (Tier 1 only) | $69/mo (annual) | $399/mo (annual) | 10+ |
TradingLite | Trial only | $12.95/mo | $20.95/mo | 15+ |
Coinalyze | Yes (ad-supported) | $10.95/mo (ad-free) | N/A | 15+ |
Glassnode | Yes (24h resolution) | $49/mo | $999/mo | On-chain only |
The pricing table reveals a second structural problem. The most affordable tools (Coinalyze, TradingLite) cover the narrowest feature sets. The most comprehensive tools (Glassnode, Hyblock Professional) are priced for institutional budgets. The middle ground does not exist in the current landscape.
The Solution: Unifying the Analytical Stack
The current landscape forces a compromise: pay exorbitant fees for institutional tools, rely on disjointed retail aggregators, or suffer the fragmentation tax of running multiple platforms simultaneously.
The systematic trader requires a unified view. They need to see the macroeconomic regime dictating the broad bias, the derivatives data signaling a coiled spring, and the order flow providing the precise execution trigger. These three layers of analysis are inseparable in practice. Separating them across five different platforms introduces the exact latency and context loss that costs traders money.
Athenum Analytics: The Strategist's Terminal
Athenum Analytics was engineered specifically to eliminate the fragmentation tax. It is a unified crypto analytics terminal that aggregates order flow, open interest, and liquidity data from 14+ exchanges, seamlessly integrated with macroeconomic intelligence.
What a Unified Terminal Actually Looks Like
Athenum data shows the current macro regime as neutral, with a VIX reading of 24.54, an HY credit spread of 3.16%, and a Fed Funds Rate of 3.64%. These macro indicators sit alongside real-time derivatives data in the same workspace, eliminating the need to switch between terminals. The macro regime context referenced throughout this analysis is available directly within Athenum's platform, updated in real time alongside funding rates, open interest, and order book depth.
Athenum delivers a zero-latency architecture via direct WebSocket feeds, ensuring that OI, funding rates, and order book depth update synchronously, even during maximum volatility. It is the only platform that places Federal Reserve liquidity metrics, CME gaps, and geopolitical risk alongside real-time liquidation heatmaps and whale wall detection. Rather than forcing the trader to manually scan dozens of charts, Athenum's signal engine algorithmically detects funding extremes, OI divergences, and order book asymmetry, surfacing actionable anomalies in real time.
The market is too fast and too complex to navigate with a fragmented toolset. Athenum illuminates the battlefield, allowing the strategist to make high-conviction decisions based on a complete, uncompromising view of the data.