Practise with worked lessons
- Calculate volume profile and VWAP from the same sample
The busiest price was 100, the volume-weighted average 102. Calculate volume profile and VWAP from the same trades and see why a value area is not a forecast.
TL;DR: VWAP (volume-weighted average price) is the cumulative price times volume divided by cumulative volume over a session, day, or anchor point, and it tells you the volume-weighted "fair price" buyers and sellers actually paid. The value area, drawn from a volume profile, marks the roughly 70% band of volume around the point of control (POC), giving you support and resistance based on where trading actually clustered. Both are references, not signals: they lag, they reset, and crypto's fragmented 24/7 venues make a single number only as good as the data behind it.
What is VWAP and how is it calculated?
VWAP stands for volume-weighted average price. The formula is simple. Take the cumulative sum of price times volume, then divide by the cumulative volume over your chosen window.
VWAP = cumulative (price x volume) / cumulative volume
Unlike a plain moving average, VWAP weights each print by how much traded there, so a price level with heavy volume pulls the line harder than a thin wick. Standard VWAP is an intraday measure. It resets at the start of each session or day, which is why a fresh VWAP early in a session is noisy and only firms up as volume accumulates.
Why does anyone care? VWAP is a fair-value benchmark that execution desks and algorithms lean on. Large orders are often worked to beat or match VWAP so the fill does not move the market against the trader. The rough reading most participants use: price above VWAP means buyers have been paying up and are in control, price below means sellers have been hitting bids. It is a reference for who is leaning on the tape, not a forecast.
What is anchored VWAP and when is it useful?
Standard VWAP resets on a fixed clock. Anchored VWAP (sometimes written A-VWAP) drops that constraint. Instead of resetting daily, you pin the calculation to a specific bar you choose: a swing high, a swing low, a major liquidation flush, an ETF-flow event, or a halving. From that anchor forward, it accumulates price times volume the same way.
The value is context. If you anchor to the low of a big sell-off, the anchored VWAP traces the average price everyone who bought the recovery actually paid. When price revisits that line, it is a level the market has a real cost basis at, which is why anchored VWAP often behaves as support or resistance long after the event that spawned it. It answers a concrete question: are buyers from that event in profit or underwater right now?
What is the value area, POC, VAH, and VAL?
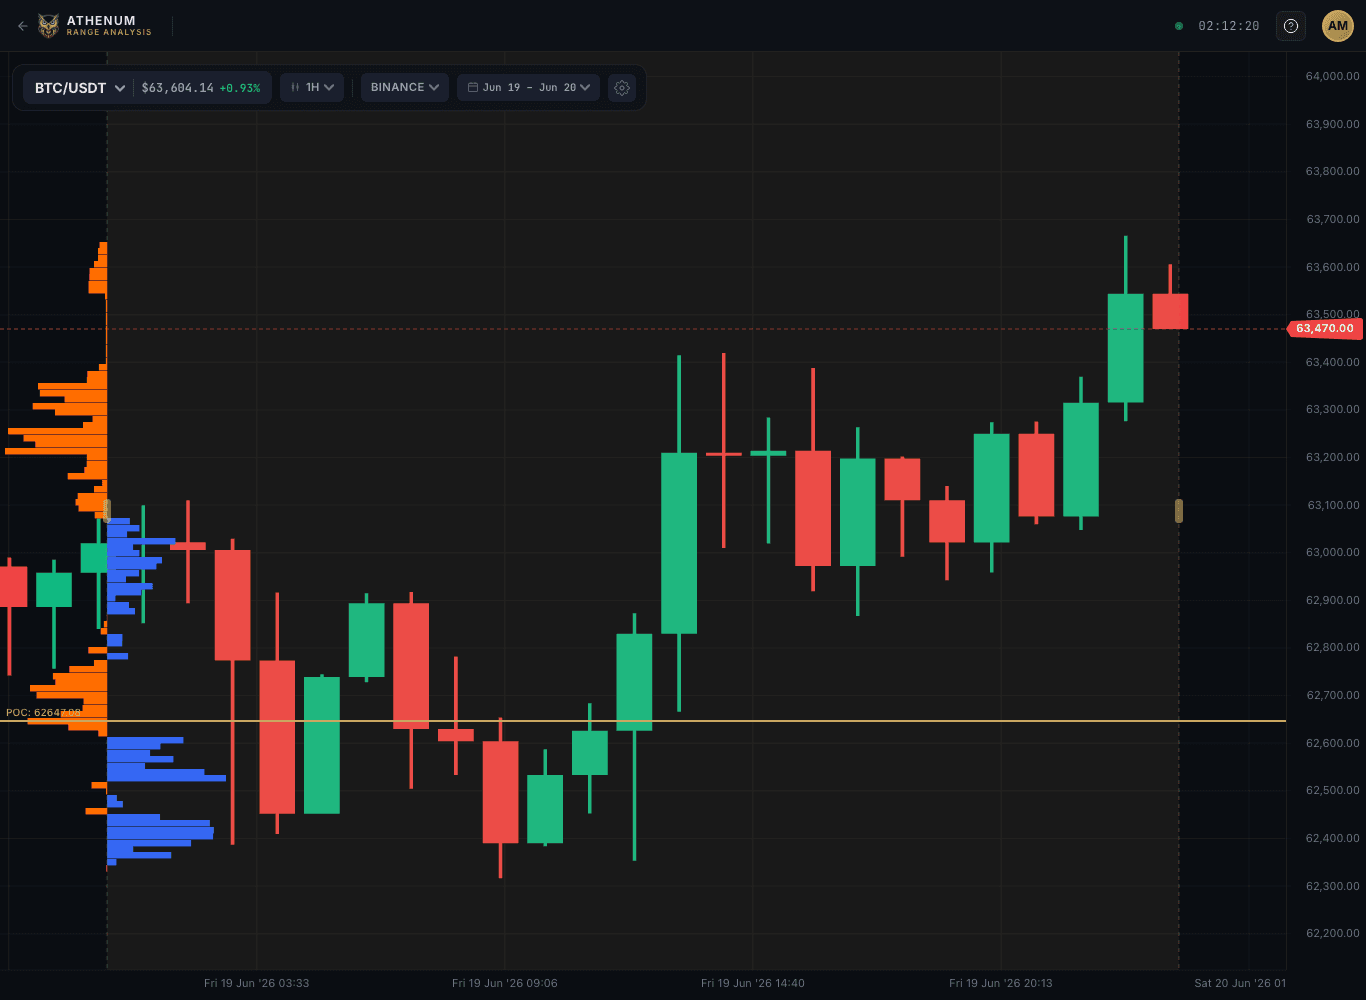
VWAP collapses a session into one line. A volume profile does the opposite. It shows how much volume traded at every price level, turning the chart sideways into a histogram of activity.

Range analysis on BTC/USDT, one-hour candles on Binance for 2 to 3 August 2026: the volume profile sits on the left and the point of control is marked at $63,205.29, with price at $62,642.08 underneath it. The value area is the band around that POC holding the bulk of the traded volume.
Three landmarks matter:
- POC (point of control): the single price with the most traded volume. It is the level the market spent the most size agreeing on, and it tends to act as a magnet that price drifts back toward. - VAH and VAL (value area high and low): the upper and lower edges of the value area, the price band that contains a chosen share of total volume. The convention is about 70%, a default that traces back to Market Profile, developed by Peter Steidlmayer at the Chicago Board of Trade in the 1980s, where it approximates one standard deviation of activity around the POC.
The practical read: inside the value area, price is in "accepted" territory and tends to rotate between VAH and VAL. A break and acceptance outside the value area signals the market is searching for a new fair price, and trades that poke above VAH or below VAL but fail to hold often snap back toward the POC. That mean-reversion bias is why VAH and VAL get used as support and resistance, and why a clean break of them gets attention.
Where do VWAP and the value area mislead?
These tools describe the past with precision and the future not at all. A few honest limits:
- They lag. Both are built from volume that has already traded. They confirm where value formed, they do not predict where it goes next. - VWAP resets. A daily VWAP at 00:05 is built from almost nothing and will whip around. Early-session readings deserve little weight, and the choice of anchor or session length changes the entire picture. - A reference, not a trigger. Price reclaiming VWAP or tagging the POC is information, not a buy or sell instruction. Treating a line touch as a signal, with no regard for trend or context, is how these get misused. - Crypto fragments the volume. There is no single consolidated tape. The "true" VWAP and value area depend on which venues you aggregate. A profile built from one exchange can miss where the real size traded, so the quality of the underlying data matters as much as the math.
That last point is where aggregation earns its keep. Athenum computes range and VWAP analysis across 14 exchanges, so the value area reflects cross-venue volume rather than one thin order book, and you can read a level on the profile next to the funding, open interest and liquidations around it. No trade calls here, only the data. The free /tools calculators and a no-card 7-day Pro+ trial let you try it.
Used well, VWAP and the value area answer one question cleanly: where has crypto actually traded, and who paid for it. Everything after that is your read.
One terminal. All the data.
Liquidations, orderbook depth, whale walls & open interest from 4 exchanges, all real-time, in one place.
No credit card required

Athenum Analytics
Athenum Analytics is our three-person editorial team covering crypto derivatives, market data and macroeconomic context.