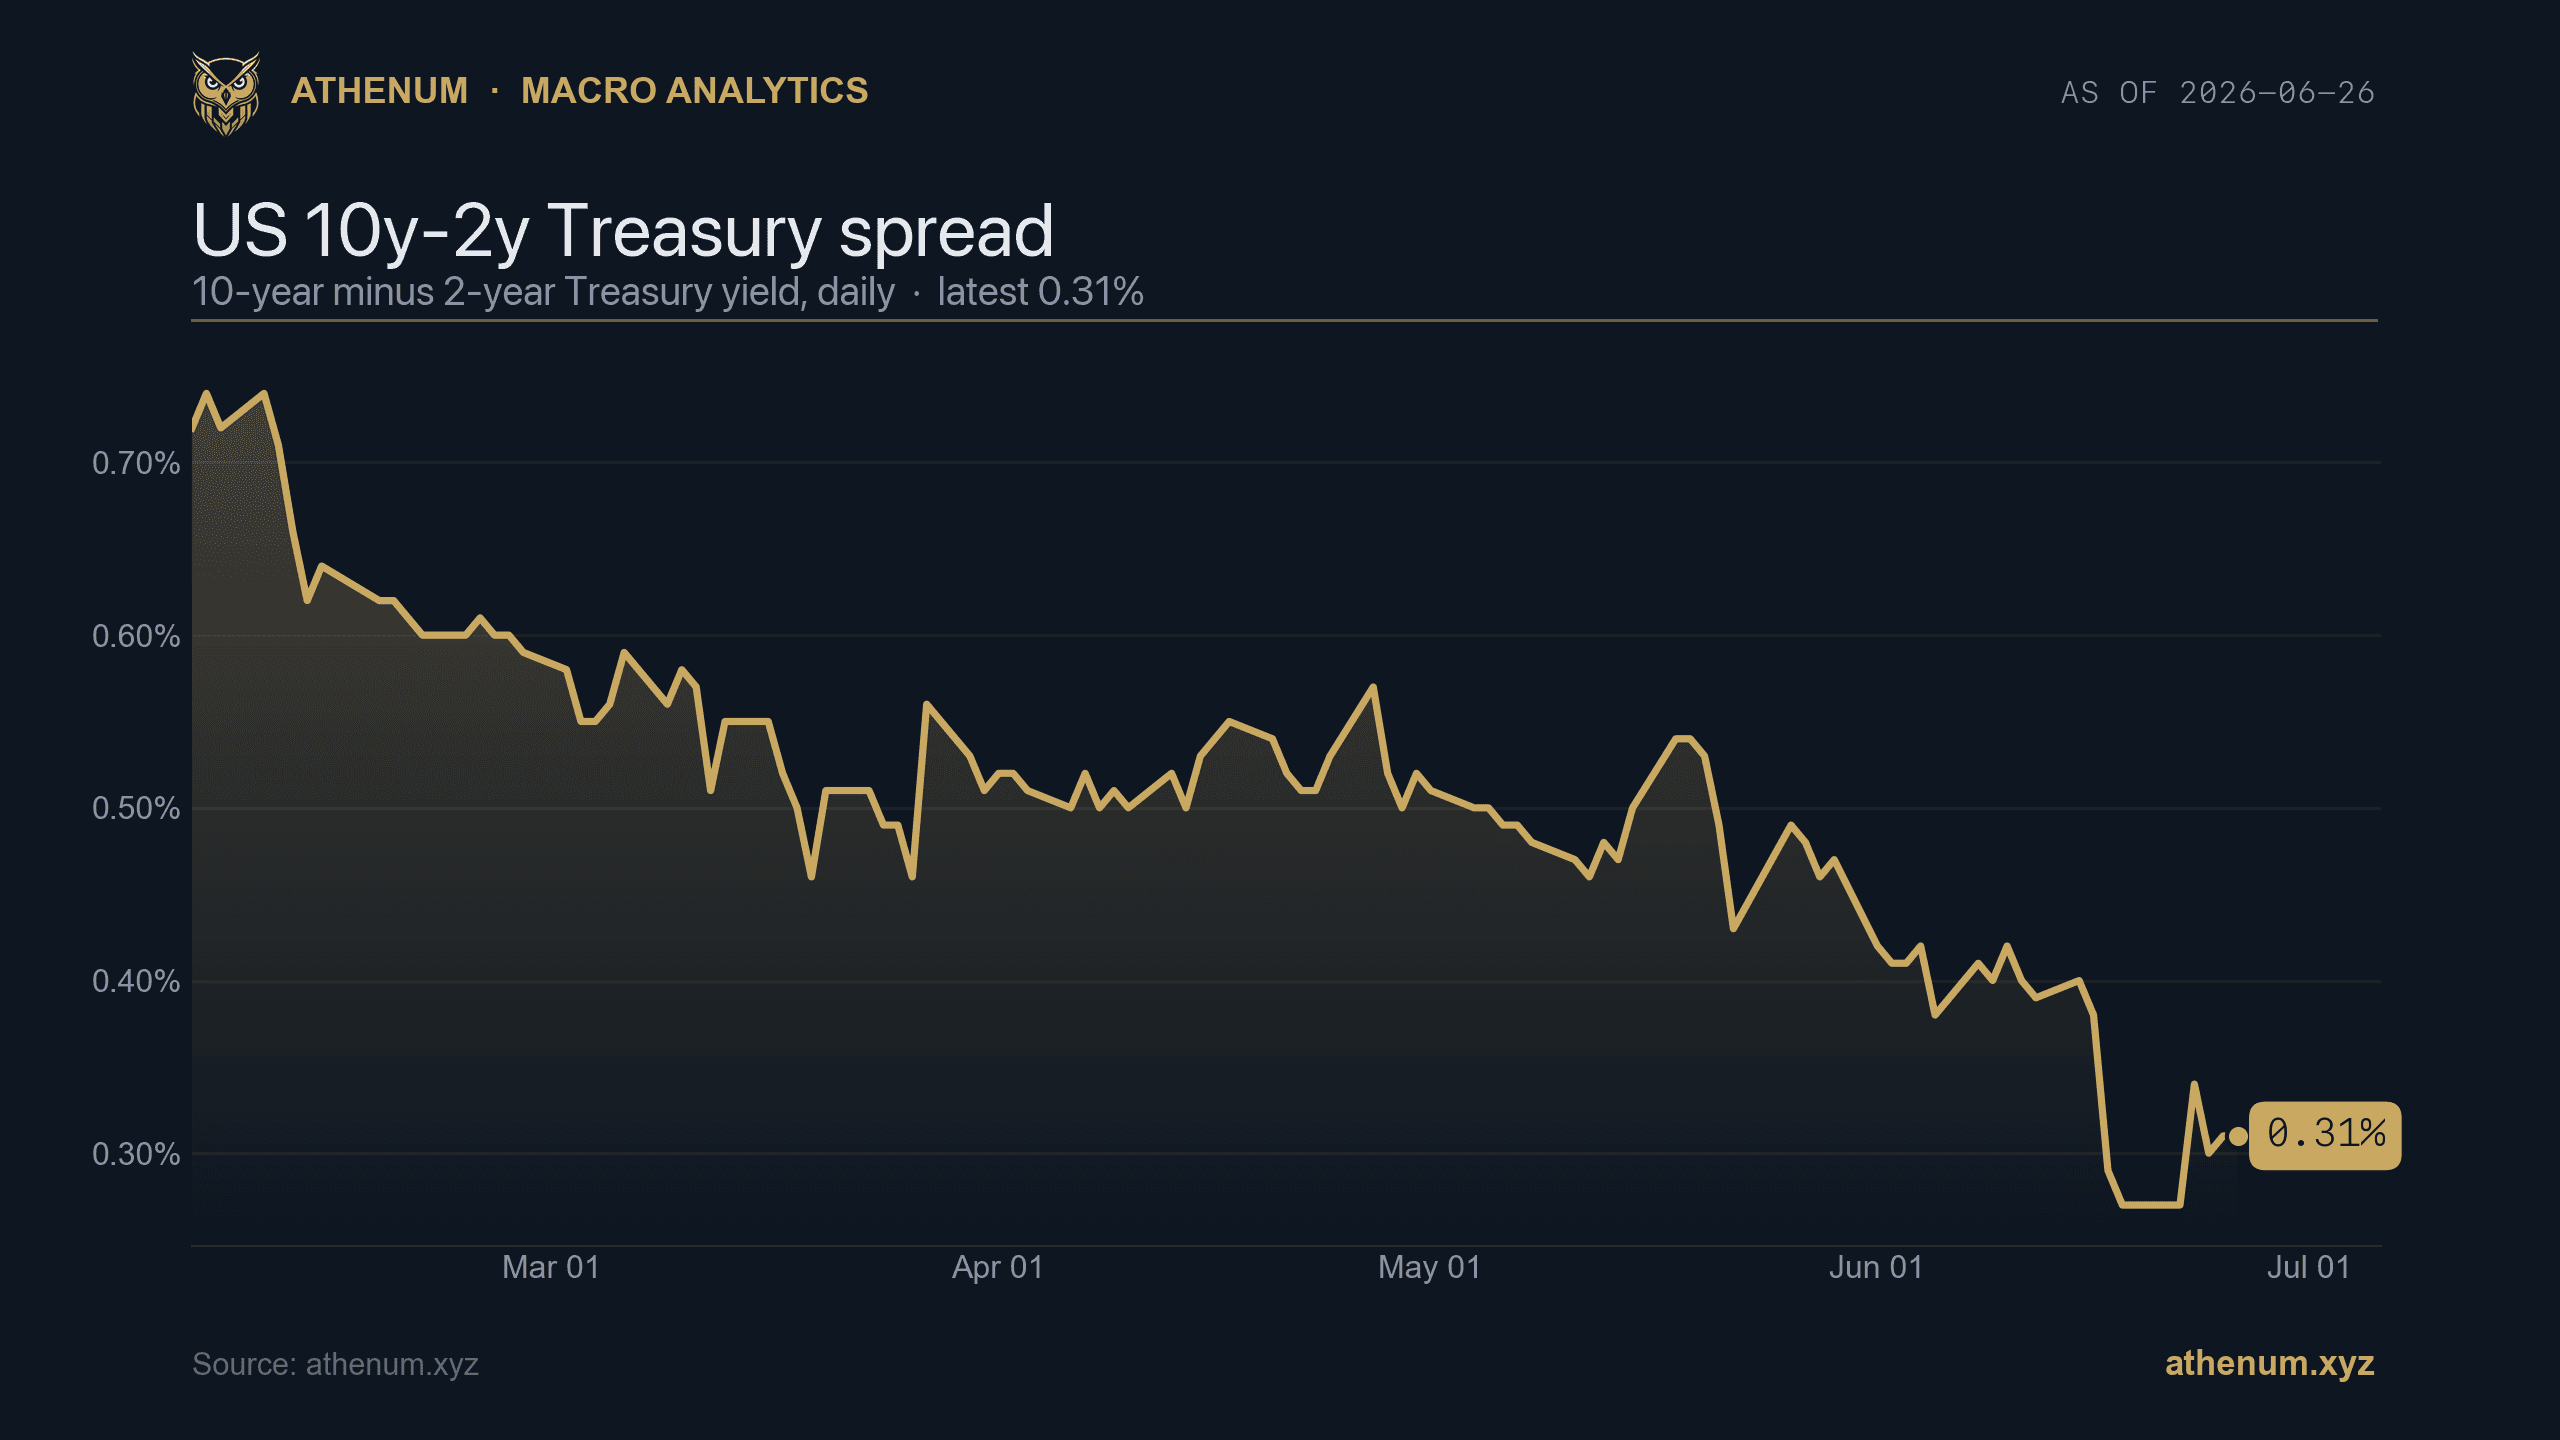
TLDR: Beyond the fast macro gauges sits a slower backdrop that frames crypto's longer risk appetite: the shape of the yield curve, the price of credit risk, and where equities trade. On 2026-06-26 the US 10-year minus 2-year Treasury spread was a positive but flattening 0.31%, down from about 0.75% in February, a slow signal that growth expectations are cooling. US high-yield credit spreads were a tight 2.78% on 2026-06-25, near the calm end of their 2.62% to 3.45% range, so credit markets were not pricing stress. The Nasdaq Composite was 25,298 on 2026-06-26, near the top of its range, so equity risk appetite was firm. The slow backdrop read constructive on credit and equities, with a flattening curve as the one cautionary note. This is education only, not a buy or sell call.
The dollar, the VIX and real yields move fast and set the day-to-day weather. The yield curve, credit spreads and equities move slowly and set the season. They rarely flip in a day, but when they turn they tend to lead risk assets, crypto included, by weeks or months. Reading them keeps you from mistaking a calm tape for a calm structure.
Here is what each slow gauge measures, why it frames crypto, and how to read the three as one backdrop.
What does the yield curve say about the macro season?
The 10-year minus 2-year Treasury spread is the classic shape-of-the-curve gauge. A wide positive spread is a market pricing healthy growth; a flattening or inverted spread is a market pricing a slowdown, and a sustained inversion has preceded most recessions. On 2026-06-26 the spread was 0.31%, still positive but flattened sharply from about 0.75% in February. That is not an inversion, so it is not a recession alarm, but the direction is a slow tell that growth expectations are cooling. For crypto, a flattening curve is a backdrop signal to watch rather than a trade: it says the macro season may be turning even while the daily tape looks fine.
What do credit spreads say about stress?

Athenum, the US high-yield credit spread at a tight 2.78% on 2026-06-25, well below its late-March spike toward 3.45%. Tight spreads mean credit markets are calm, a risk-on backdrop for crypto. athenum.xyz
The high-yield credit spread is the extra yield investors demand to hold risky corporate debt over safe Treasuries, and it is one of the cleanest measures of financial stress. Spreads widen fast when markets fear defaults and tighten when risk appetite is healthy. At 2.78% on 2026-06-25 the spread was near the tight end of its 2.62% to 3.45% range, well below the late-March spike toward 3.45%, so credit markets were calm and not flashing stress. This matters for crypto because credit is often the first place stress shows up: when high-yield spreads blow out, leverage gets pulled from every risk market, and crypto, the highest-beta risk asset, usually feels it hardest.
Where do equities fit in?

Athenum, the Nasdaq Composite at 25,298 on 2026-06-26, near the upper end of its range. Crypto trades with a high beta to tech equities, so a firm Nasdaq is a supportive backdrop. athenum.xyz
The Nasdaq Composite is the cleanest proxy for risk appetite in high-growth assets, and crypto trades with a high beta to it. When tech equities are rising, the same risk appetite tends to lift Bitcoin; when they roll over, crypto rarely escapes. The Nasdaq was 25,298 on 2026-06-26, near the top of its range after pulling back from a peak around 27,100 in early June. Firm but off its highs, it described a risk-on equity backdrop that was still intact but no longer accelerating, the kind of tape that supports crypto without doing the heavy lifting for it.
The slow macro backdrop: side by side
Macro tell | What it signals | Latest read |
|---|---|---|
10y-2y Treasury spread | Growth expectations; flattening warns of a slowdown | 0.31% (2026-06-26) |
High-yield credit spread | Financial stress; tight spreads are calm | 2.78% (2026-06-25) |
Nasdaq Composite | Risk appetite in high-growth assets | 25,298 (2026-06-26) |
Two of the three read constructive: credit was calm at 2.78% and equities were firm at 25,298. The flattening curve at 0.31% was the lone caution, a slow signal that the season may be turning even with credit and equities still healthy. That divergence, healthy credit and equities over a flattening curve, is common late in a cycle and is exactly why you read the slow gauges alongside the fast ones rather than instead of them.
How do you read the slow backdrop in practice?
Use the slow gauges to set the season and the fast gauges to trade the weather. A tight credit spread and a firm Nasdaq say the structural backdrop supports risk; a flattening or inverting curve says to keep one eye on the exit even while the tape is calm. None of these is a crypto trade on its own. They tell you whether the macro structure is helping or quietly turning, and the discipline is to read them against crypto's own data, funding, open interest and flows, rather than trading the macro chart directly.
You can track these macro tells next to crypto funding, open interest and flows, and the rest of the 28 free tools, no login required, at athenum.xyz/tools. For the demand side of the same backdrop, see spot Bitcoin and Ether ETF flows. Athenum aggregates market data across 14 exchanges, so the macro structure and the crypto tape sit in one place. Want the full terminal? Start a free 7-day Pro+ trial, no card required.
The short version
The yield curve, credit spreads and equities are the slow macro gauges that frame crypto's risk backdrop. On these dates the 10y-2y spread was a flattening but positive 0.31%, high-yield spreads were a calm 2.78%, and the Nasdaq was firm at 25,298, a constructive backdrop with a flattening curve as the one caution. Read the slow gauges for the season and the fast ones for the weather, and confirm any read against crypto's own data rather than the macro headline. Education only, not investment advice.
One terminal. All the data.
Liquidations, orderbook depth, whale walls & open interest from 4 exchanges, all real-time, in one place.
No credit card required

Athenum Analytics
Athenum Analytics is our three-person editorial team covering crypto derivatives, market data and macroeconomic context.