Compare liquidation and trading tools · Reviewed
Athenum vs The Kingfisher
Athenum and The Kingfisher compared on liquidation maps and heatmaps, market coverage, model transparency, free access, API and regular prices, with dated sources.
Published by Athenum Analytics, the maker of Athenum. This is our assessment of workflow fit, based on the linked documentation and our product. It is not an independent benchmark or a measured performance ranking. Read more about Athenum and its pricing.
Which fits your task?
Choose Athenum when you want the liquidation heatmap and a Liquidation Map beside Whale Walls, Volume Delta, public funding and open interest pages and macro and TradeFi areas, and when you need to read how the estimate is built before you rely on it.
Choose The Kingfisher when you scan liquidation maps across many markets: Max adds aggregated and multi-coin LiqMaps, its public directory lists 55 markets, and it adds GEX+ options views, Toxic Order Flow and an API and MCP. [1] [3] [2]
| Task | Athenum | The Kingfisher |
|---|---|---|
| Liquidation map | Liquidation Map for BTC, ETH and SOL: estimated liquidation levels by price for one exchange split by leverage tier (10x, 25x, 50x, 100x) or stacked across exchanges, over 1, 7 or 30 days. | LiqMaps by market, exchange and leverage view. Max adds aggregated and multi-coin LiqMaps. [1] |
| Liquidation heatmap | Time-by-price liquidation heatmap for BTC, ETH and SOL, estimated from open-interest growth, with a Liquidation Levels view and a realized-liquidation overlay. It refreshes every 120 seconds. | Estimated liquidation heatmaps alongside the LiqMap. [2] |
| Market coverage | Heatmap and Liquidation Map cover BTC, ETH and SOL. The heat surface is built from the stored open interest of Binance, Bybit, OKX, Deribit, Bitget and Hyperliquid. | 55 markets in the public market directory. The home page states 27+ exchanges and data workers monitored live, including DEX protocols, and 1,500+ instruments. [3] [2] |
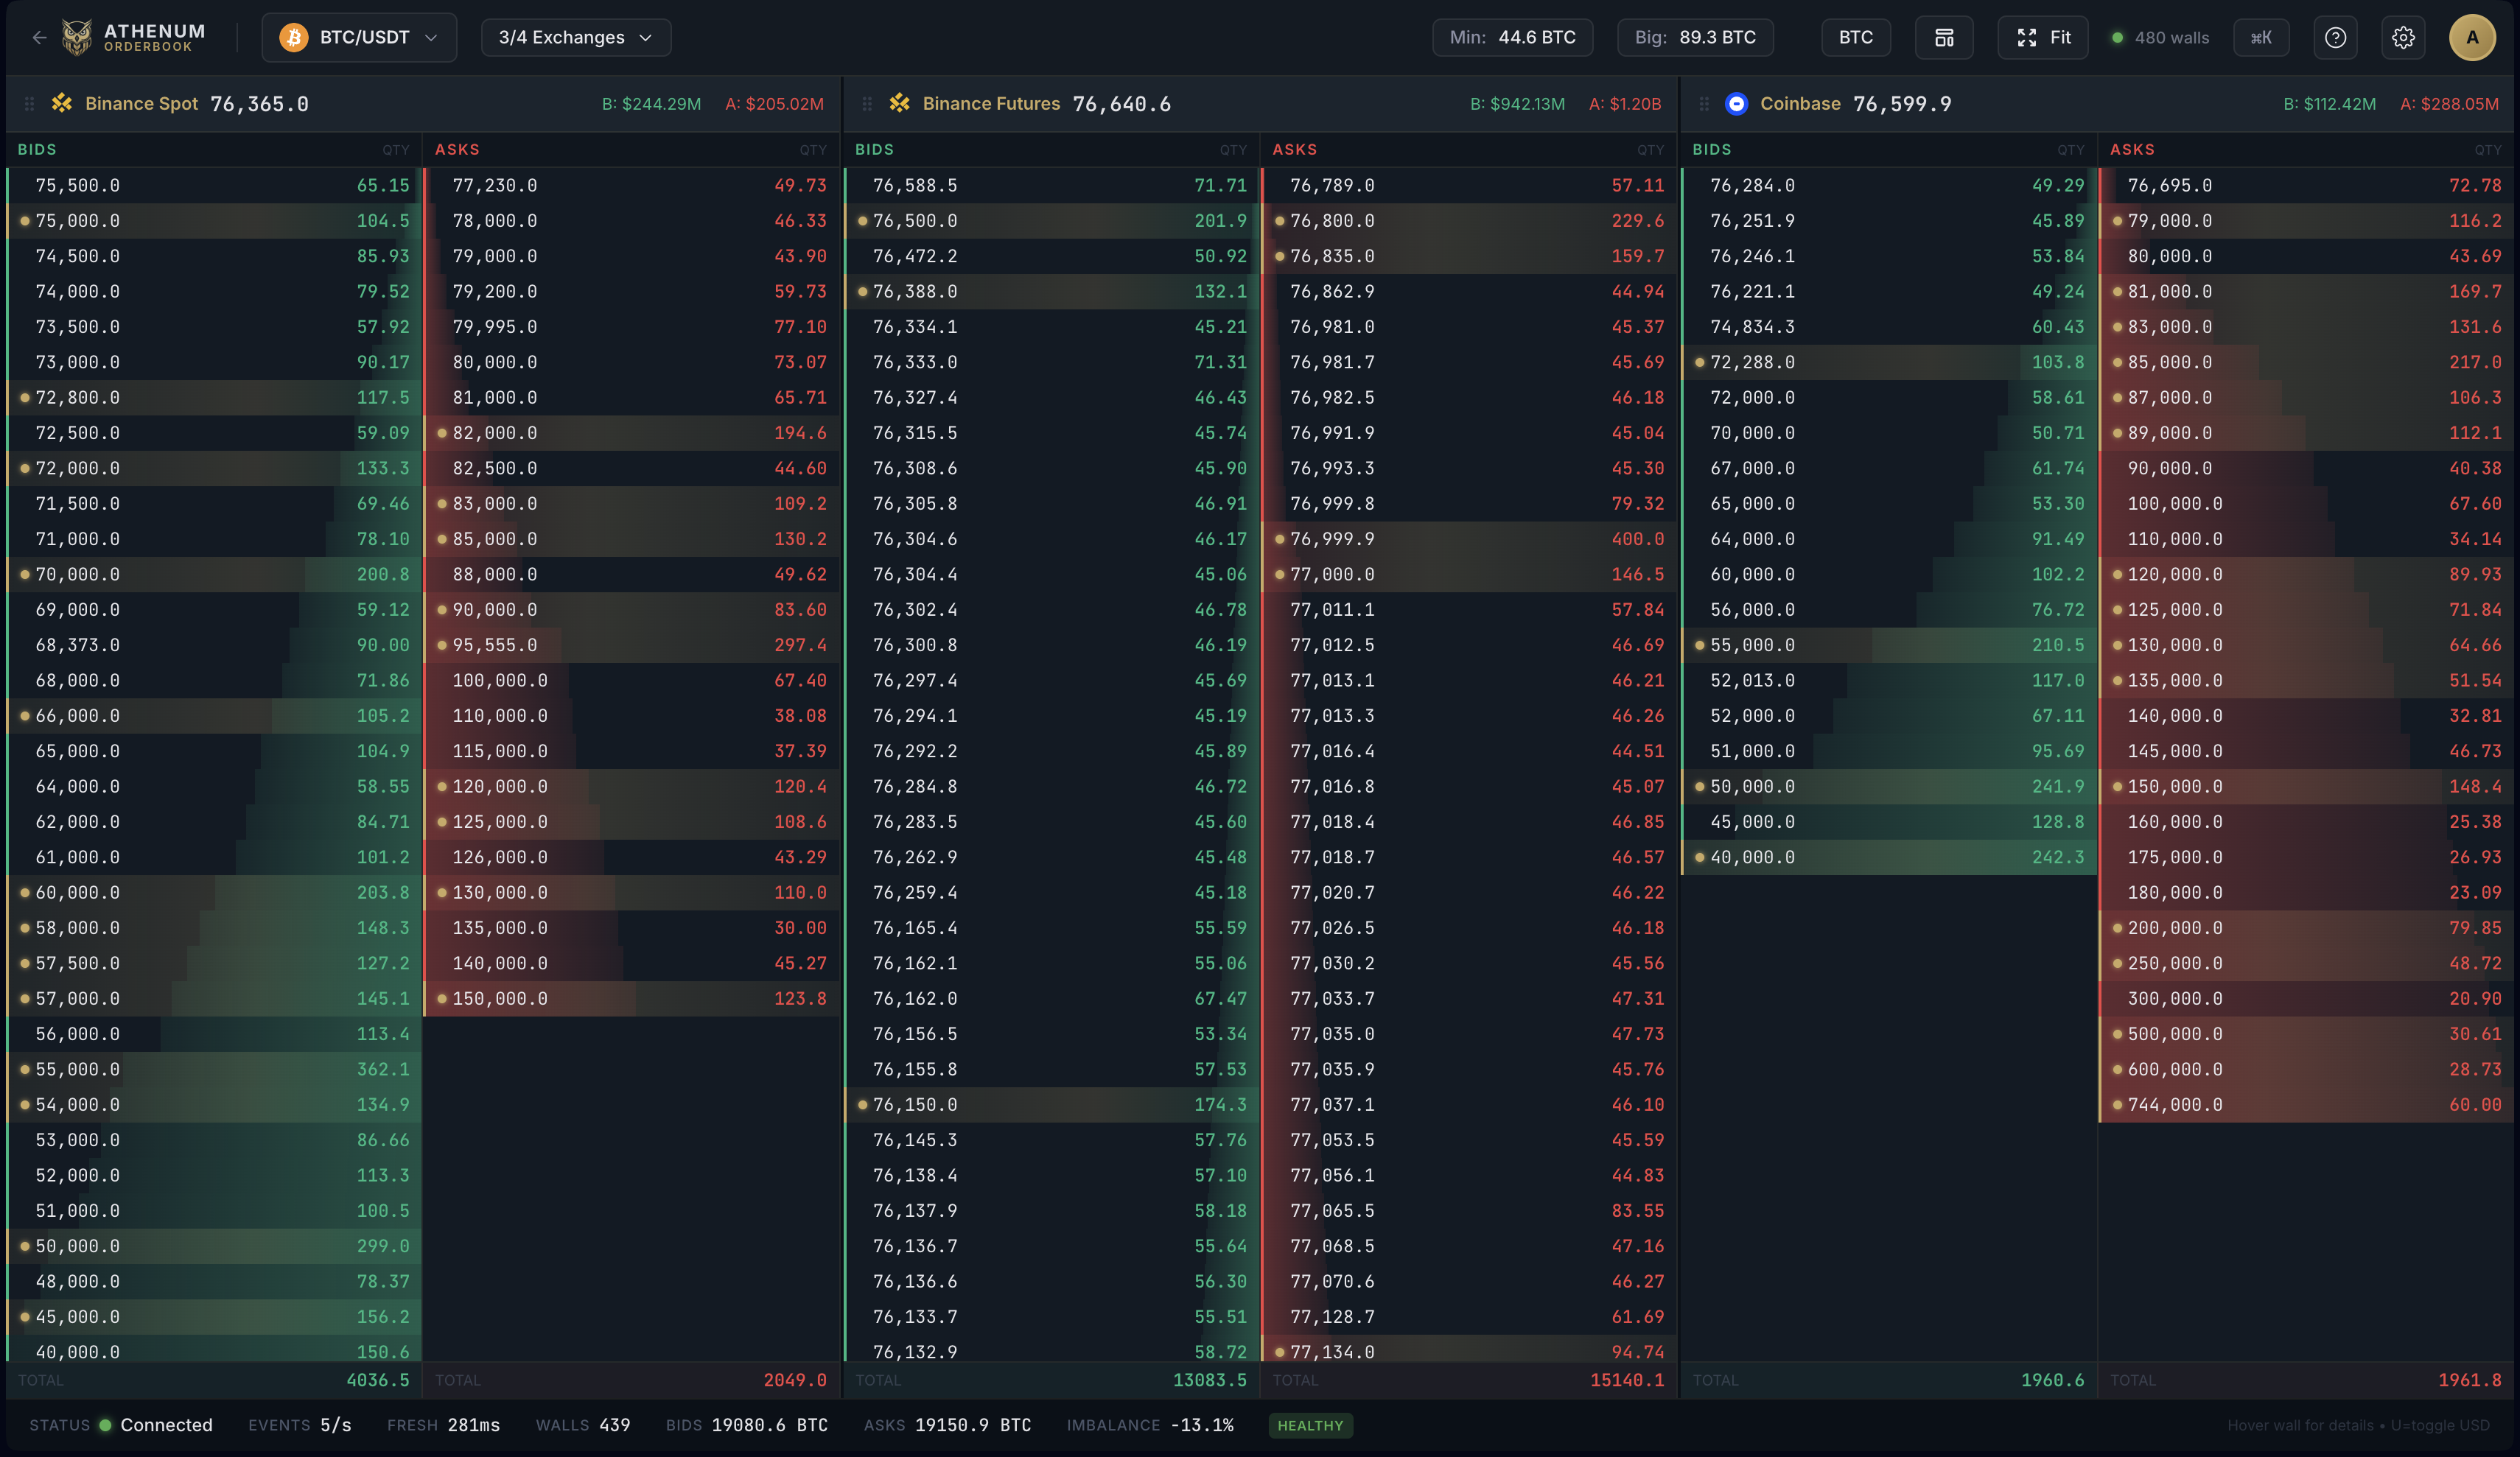
| Order book | Whale Walls follows large resting orders and their lifecycle on 4 markets: Binance Futures, Binance Spot, Coinbase and Hyperliquid. | Aggregated order book on Pro and Max. [1] |
| Options | Options Max Pain. | GEX+ views of options dealer gamma and vanna exposure. [2] |
| Free access | Free plan: 1 analysis domain; Delayed data, no real-time entitlement; 1 venue per feature; Up to 24 hours of history; ETHUSDT, 1h, 4h and 1d intervals; No alerts. Start with 7 days of Pro+. No credit card required. | The pricing page names no free plan. The home page offers a free LiqMap with live data; the public liquidation map page shows a short-lived Binance high-leverage snapshot. Guides and calculators are public, and credit-funded sessions cover occasional use. [1] [3] [2] |
| Free calculators | 37 free calculators that work without an account. | Liquidation, liquidation price, position size, leverage and P&L calculators on its public site. [4] |
| API | The Athenum API is in development and planned for Pro+. It is not available yet. | API and MCP tiers with REST and WebSocket endpoints; Pro includes 420 and Max 600 API credits per month. [1] |
| Regular price | Free plan at no cost. Lite $27, Pro $97, Pro+ $297 per month billed monthly; Lite $297, Pro $970 and Pro+ $2,673 per year billed yearly (USD). A founder offer on Pro+ Monthly is running. Current offer and terms | Pro $79 and Max $109 per month billed monthly, or $780 and $1,080 per year billed yearly. Genesis Pass: $5,000 or 0.05 BTC once, availability on request. As of 2026-11-19. [1] |
Where The Kingfisher is stronger
- Aggregated LiqMap and Multi Coin LiqMap on the Max plan. [1]
- A public directory of 55 liquidation-map markets and a free, short-lived Binance high-leverage LiqMap snapshot. [3]
- GEX+ options views (gamma and vanna exposure) and Toxic Order Flow. [1] [2]
- API and MCP tiers up to 15,000 credits, all instruments and full history; Pro and Max include API credits. [1]
What Athenum adds
- Time-by-price liquidation heatmap for BTC, ETH and SOL, estimated from open-interest growth, with a Liquidation Levels view and a realized-liquidation overlay. It refreshes every 120 seconds. How the heatmap works
- Liquidation Map for BTC, ETH and SOL: estimated liquidation levels by price for one exchange split by leverage tier (10x, 25x, 50x, 100x) or stacked across exchanges, over 1, 7 or 30 days.
- Whale Walls follows large resting orders and their lifecycle on 4 markets: Binance Futures, Binance Spot, Coinbase and Hyperliquid. Live Whale Walls Whale Walls documentation
- Volume Delta (CVD) covers 52 spot and futures instruments on 29 exchanges. Binance markets report taker volume directly; most other instruments are signed with a tick-rule estimate.
- Public live pages without an account: BTC and ETH funding on Binance, Bybit, OKX and Hyperliquid, and open interest on Binance, Bybit, OKX, Deribit, Bitget, Hyperliquid, Gate and HTX. Funding rates Open interest
- Macro, economic data and TradeFi areas sit in the same workspace. Pro: Order Flow + Derivatives, plus one of: Macro & Data, Macro Intelligence or TradeFi. Pro+: Order Flow, Derivatives, Macro & Data, Macro Intelligence and TradeFi. Individual module releases still apply. Plans and domains
- 37 free calculators that work without an account. Free calculators
- Published methods: the research studies come with downloadable data and calculation code, and the methodology page names the data sources.
How each tool estimates liquidations
The Kingfisher: The Kingfisher describes LiqMap as model-estimated liquidation pressure from a proprietary engine it has refined since 2020; its inputs, weightings and transformations are not published. [2]
Athenum: The estimated surface starts from each venue's open-interest growth, splits it into longs and shorts with a funding signal (the long share stays between 30 and 70 percent) and spreads it over a ladder of 49 leverage steps from 5x to 125x. Steps above a venue's own maximum leverage (50x on Hyperliquid, for example) are computed at that maximum, and each venue's maintenance margin sets the liquidation price. Intensity is relative, not dollars. Realized liquidations from Binance and Bybit are drawn as a separate overlay and count as a lower bound. The full model is published in the documentation. Read the liquidation heatmap documentation.
Both are estimates of where leveraged positions could be liquidated, not reported liquidations. Reported liquidation events are a separate data set and a lower bound, because exchange feeds limit what they publish.
Should I trust a liquidation model whose inputs are not published?
You can use it, but you cannot check it. A published model lets you test whether a band comes from new open interest, a leverage assumption or a venue gap. With a closed model, compare its levels against realized liquidations and price reactions over time before relying on them. [2]
A practical comparison you can repeat
Choose one market both tools cover, such as BTC on Binance, and the same window. Record the price levels of the three densest estimated zones above and below price in each tool, then note which zones were later crossed and whether realized liquidations followed. [3]
Evidence and limits
Our Bitcoin perp holding-cost audit compares funding with fees in a stated historical sample. For visible liquidity, read Whale Walls behavior and limitations and the heatmap interpretation checklist. Prices, entitlements and feed coverage can change; verify the exact edition and market before paying or migrating.
Sources checked for this comparison
- The Kingfisher: pricing and plans, checked
- The Kingfisher: home page, checked
- The Kingfisher: liquidation map and market directory, checked
- The Kingfisher: calculators, checked
Other comparisons
- Athenum vs CoinGlass
- Athenum vs Hyblock Capital
- Athenum vs Bookmap
- Athenum vs Exocharts
- Athenum vs TradingView
- Athenum vs Velo
For a broader shortlist, see the CoinGlass alternatives guide. For the side-by-side table of liquidation tools, visit the comparison overview.
Send a correction with the product edition, source URL and date.