Audit the construction of auction profiles · 1 / 5
Volume profile POC: resolve equal-volume price levels
A chart may draw one point-of-control line even when two price rows share the highest volume. The single line contains a display decision as well as a measurement. Reconstruct both before treating its movement as new market information.
Athenum7 minUpdated:
Find all maxima before selecting one
In this lesson, each row is one exact price in USD per base unit, and its height is traded base volume. First find the largest row volume and retain every price that has it. A tie means the data do not identify a unique highest-volume price. The chosen display policy resolves that ambiguity; it does not remove it from the underlying sample.
Define our first policy as selecting the tied price nearest the midpoint of the lowest and highest occupied price rows, then selecting the lower price if distances also tie. Sierra Chart documents this style of tie resolution. We apply the explicitly stated rule to an invented dataset, not to a captured vendor or Athenum chart. A highest-price tie policy would answer the display question differently.
Keep selection effects separate from trading effects
Record the row grid, population window, volume type and tie policy together. Even a rule that is deterministic can change its chosen price when the outer range changes. That does not necessarily mean volume increased at the new displayed POC. Inspect which input or rule changed before describing the line as evidence of buying or selling pressure.
A maximum describes activity in the selected past sample. It does not reveal how many traders participated, where their remaining positions are held or whether price will return. If a platform does not document its tie behaviour, retain the full maximum set and mark the displayed selection as unresolved rather than reverse-engineering a convenient trading story.
Two nine-unit peaks, one displayed line
The original teaching sample contains 25 units in total. Prices 99 and 101 each hold 9 units, exceeding every other row. The occupied range is 98 through 102, so its midpoint is 100. Both candidate prices are one price unit away.
The nearest-midpoint-then-lower policy therefore selects 99. A highest-price tie policy selects 101 using the same histogram. Report the tied set as well as the chosen result when comparing implementations. The different displayed coordinates alone do not establish a data-feed error.
| Price USD/unit | Volume, units |
|---|---|
| 98 | 2 |
| 99 | 9 |
| 100 | 3 |
| 101 | 9 |
| 102 | 2 |
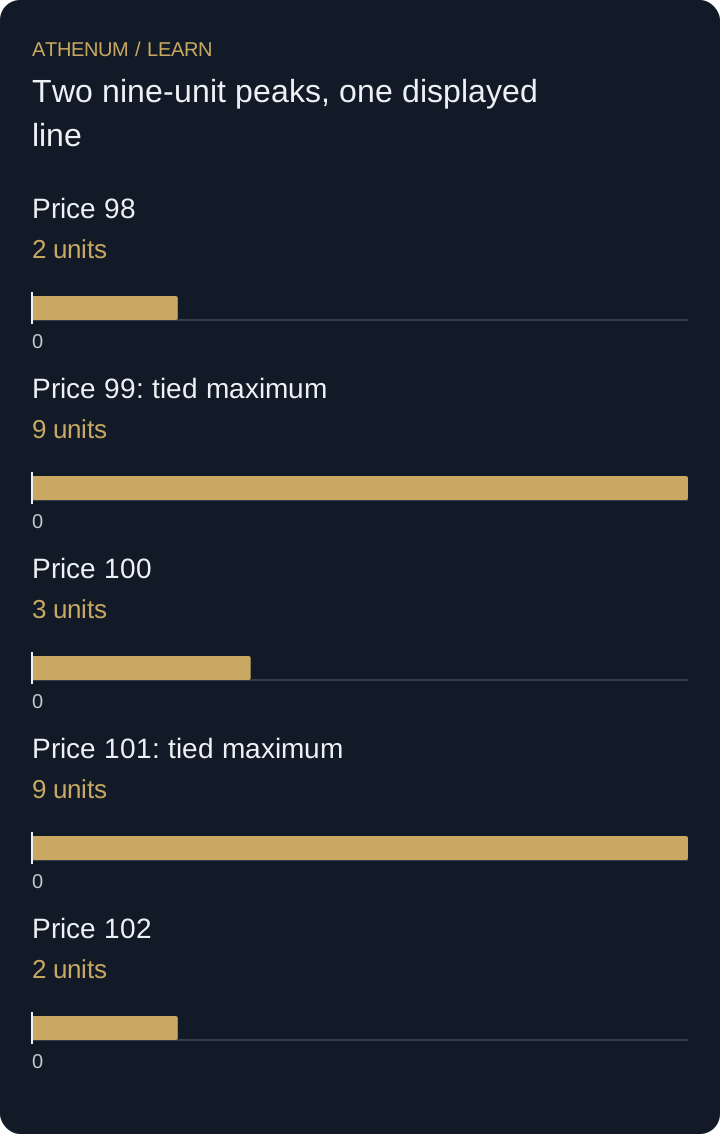 Open full-size diagram
- Price 98: 2 units
- Price 99: tied maximum: 9 units
- Price 100: 3 units
- Price 101: tied maximum: 9 units
- Price 102: 2 units
Averaging the tied prices changes the statistic
The average of 99 and 101 is 100, but that row contains only 3 units. Calling 100 the POC would replace the maximum with a different statistic. An average can be useful for another purpose; it must not silently inherit the name and interpretation of the highest-volume row.
Before acting
- Find every row sharing the maximum volume.
- Record the exact row grid and population window.
- State how ties are resolved and what defines the midpoint.
- Separate the selected display coordinate from the maximum set.
- Check changed inputs before inferring changed participation.
Check your understanding
Append one unit at price 103 and leave all previous rows unchanged. What does the nearest-midpoint-then-lower policy select, and did volume at the selected price increase?
Show the explained answer
The occupied-range midpoint becomes 100.5. Price 101 is closer than 99, so the selected POC changes to 101. Both tied maxima still contain 9 units; volume at 101 did not increase. Total volume is now 26. The selection changed because the outer range affected tie resolution, not because new trades occurred at 101.