Table of Contents8 sections
- What is the difference between a perpetual's mark price and the index price?
- How big was the discount, and did any exchange escape it?
- Why did longs keep paying funding on a perpetual that was cheaper than spot?
- Do the four exchanges at least agree on the trigger price?
- Does the disagreement get worse when Bitcoin moves?
- Why do the exchanges disagree about the price of Bitcoin at all?
- How do you read your liquidation price without fooling yourself?
- What this is and is not
Practise with worked lessons
- Align a stop trigger with the price series that actually activates it
Last trade, mark and index price can differ at the same moment. Compare all three triggers on one timeline and separate stop activation from execution.
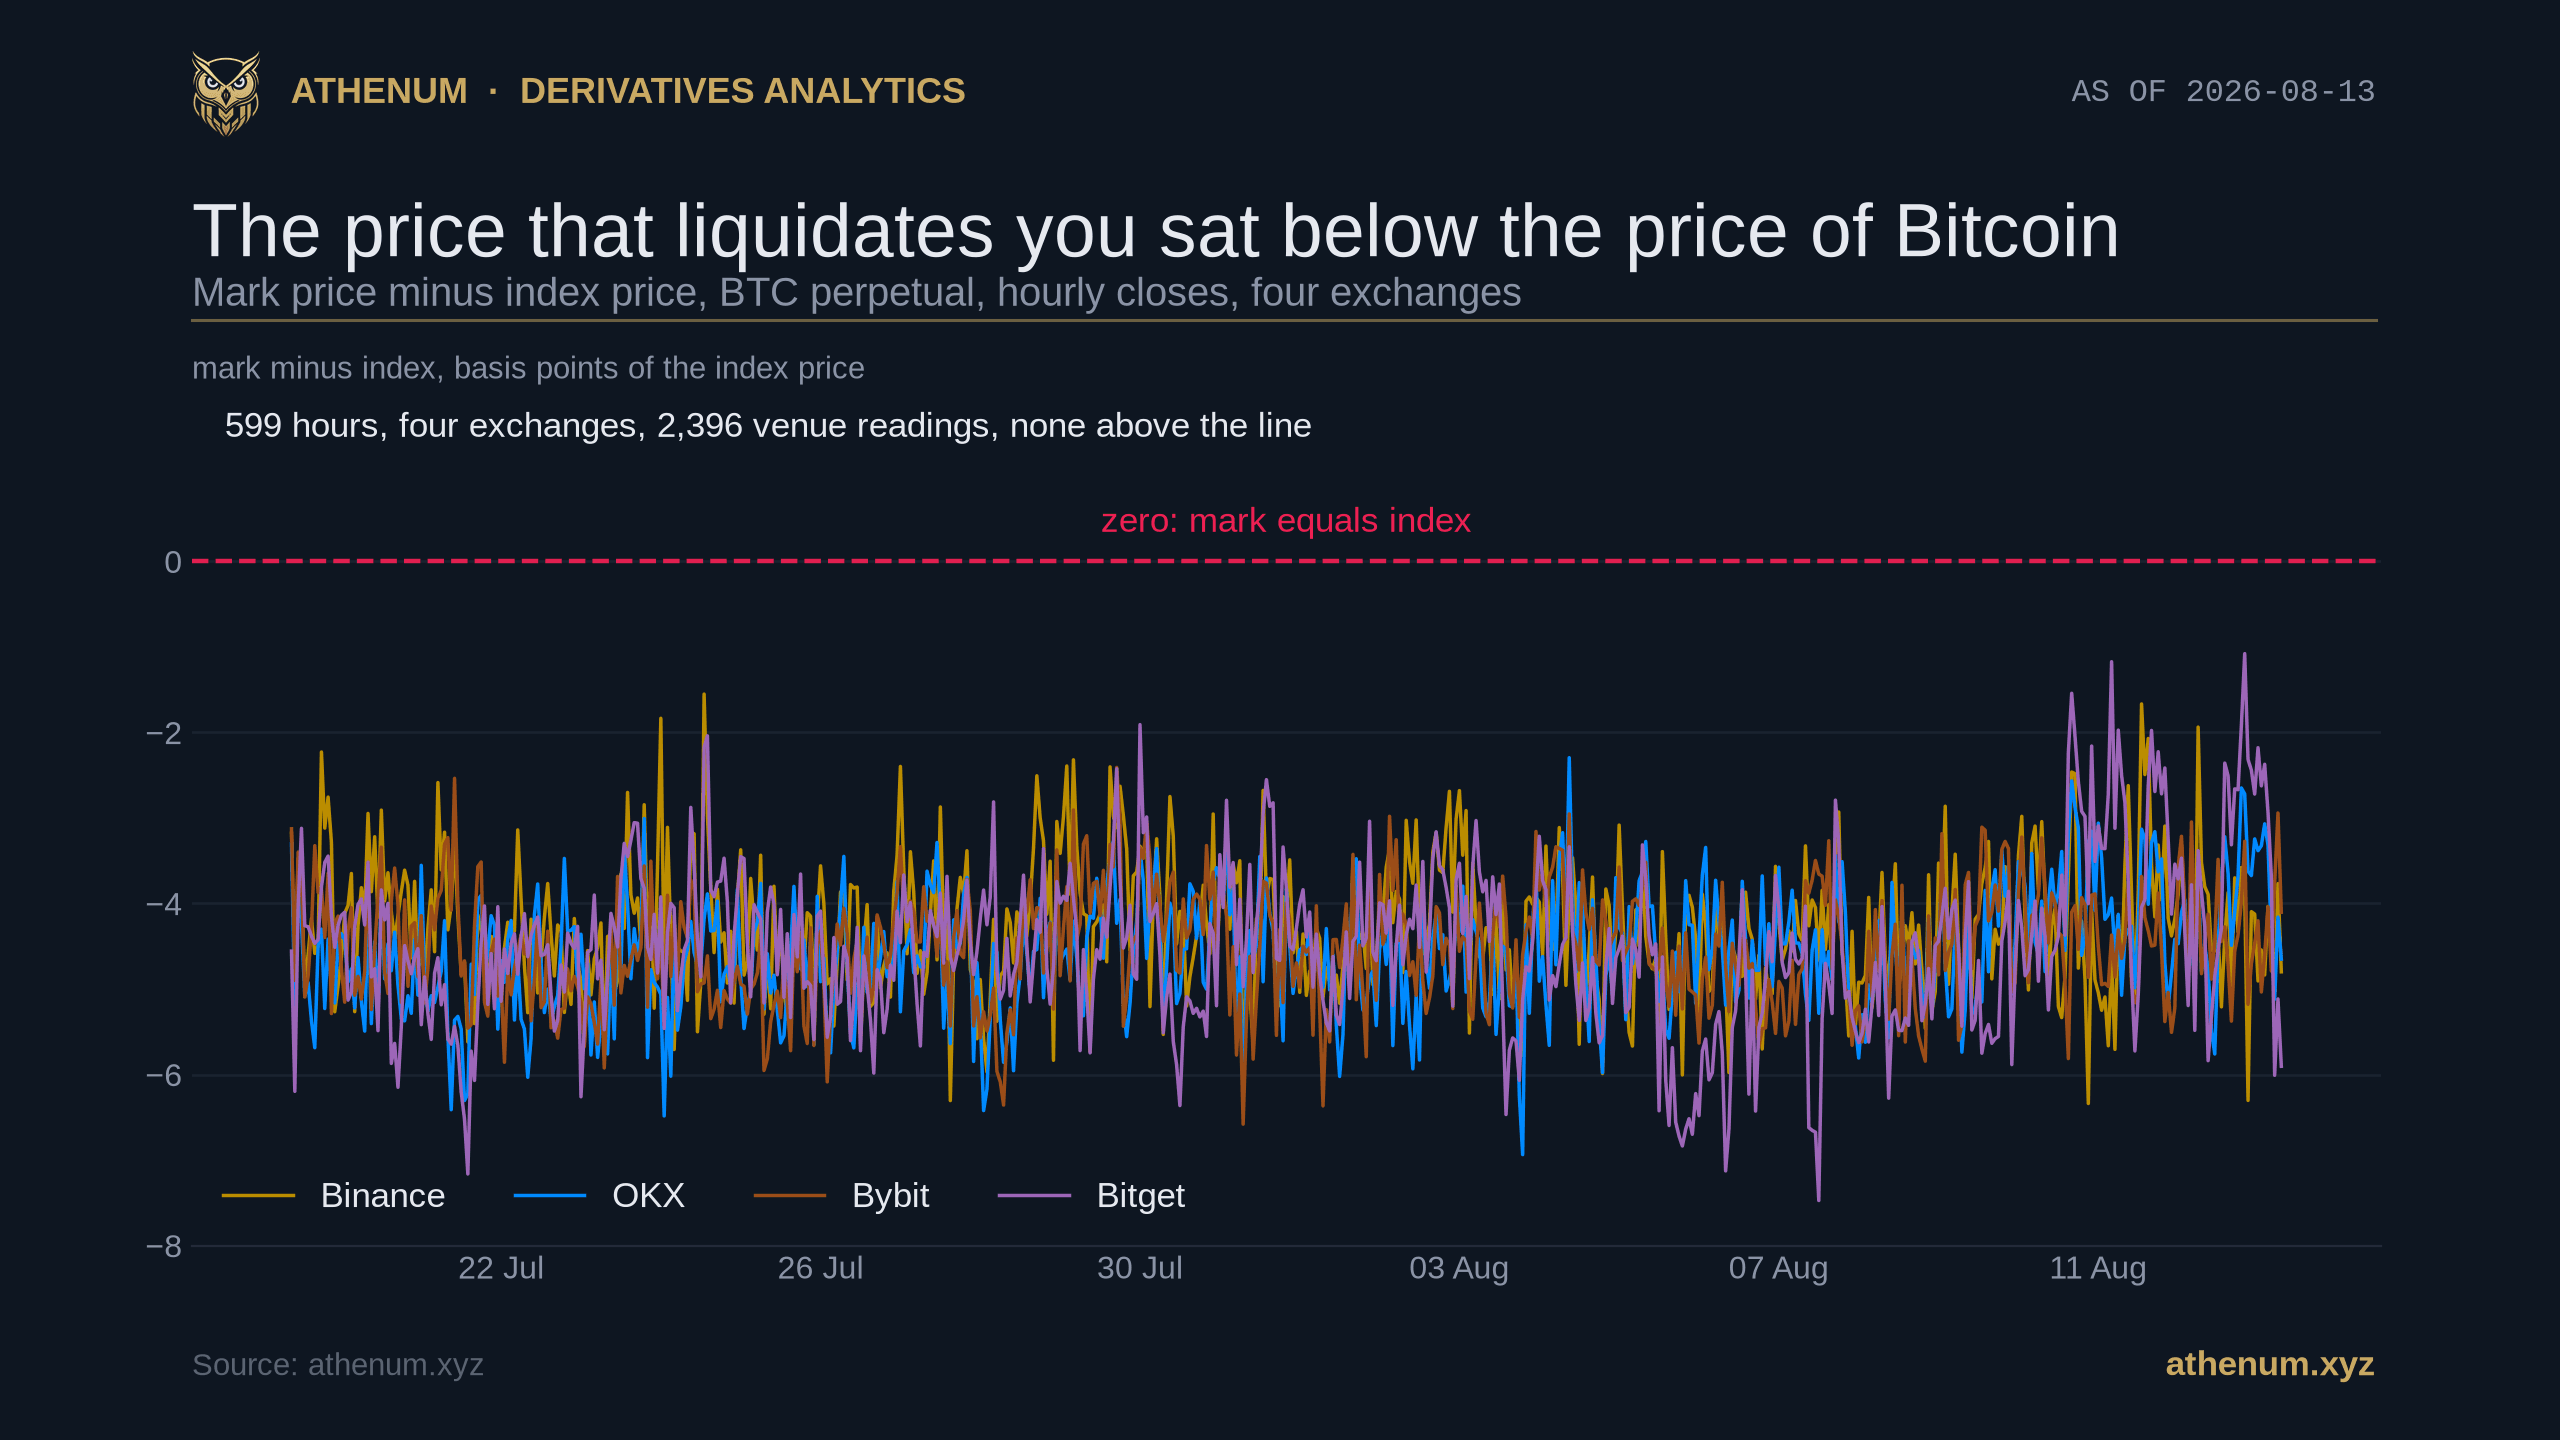
TLDR. A leveraged position is not closed out at the price on the spot chart. It is closed out at the price the exchange computes, and on a Bitcoin perpetual that price sat below the exchange's own spot index for the whole window we measured. Across the 599 hourly closes from 2026-07-19 09:00 UTC to 2026-08-13 07:00 UTC, the mark price was lower than the exchange's own spot index on Binance, OKX, Bybit and Bitget in every single hour, which is 2,396 venue readings without one exception. The typical gap was 4.29 to 4.59 basis points depending on the venue, about 29 US dollars at the price Bitcoin traded on 2026-08-13. And funding, the payment that is supposed to punish whichever side is over-eager, still ran positive: on Binance it was above zero in 560 of the 578 hours we could match. Longs paid to hold a contract that was cheaper than the asset it tracks. That sounds like a market anomaly and it is not one. It is what the published funding formula implies, and the rest of this post walks the arithmetic, tests it against the venues' own settled rates, and works out what it changes about a liquidation price.
What is the difference between a perpetual's mark price and the index price?
The index price is the exchange's answer to "what is Bitcoin worth right now", built as a weighted average of several spot markets. The mark price is the exchange's answer to "what is this contract worth right now", anchored on that index and adjusted by the perpetual's own premium or discount. Your unrealised profit, your margin ratio and your liquidation level are all computed on the mark: all four venues here document that a position is closed out when the mark price reaches its liquidation price. The Athenum explainer on mark, index and last price sets out why exchanges separate the three in the first place: a thin book can be pushed around, a basket of spot venues is harder to push.
That design has a consequence people rarely price in. If the perpetual persistently trades below the basket, then the number that decides your liquidation is persistently below the number on your chart. Which is exactly what we found, and the last section works out what it does and does not cost you, because the answer is not the obvious one.
We pulled the hourly index-price and mark-price candles that Binance, OKX, Bybit and Bitget each publish for their Bitcoin perpetual, kept the hours all four venues share, and dropped the newest bar of every series because it is still filling. That leaves 599 completed hours ending 2026-08-13 07:00 UTC. For every one of those hours, on every one of those venues, the mark closed below the index.
How big was the discount, and did any exchange escape it?
None escaped it, and the four agreed closely on the size. The median gap was minus 4.29 basis points on Binance, minus 4.50 on Bybit, minus 4.51 on Bitget and minus 4.59 on OKX. The full range across all four venues ran from minus 7.47 to minus 1.08 basis points, so even the single friendliest hour in twenty-five days still had the contract trading under the basket.

The distribution behind the headline, one box per exchange. The box is the middle half of the 599 hours and the whiskers are the full range, so the picture shows that no venue merely averaged below zero: every venue's entire observed range sits below zero. Bitget has the widest spread, reaching minus 7.47 basis points, and Binance the shallowest median at minus 4.29.
Twenty-five days is a window, not a law, so we checked the two venues that serve a longer history. Over Binance's own 999 completed hours back to 2026-07-02 17:00 UTC, the mark closed above the index in 3 of them, and one of those three is a tie that only survives at the sixth decimal, 0.00016 dollars. Over Bybit's 999 hours in the same period, in 0. The discount is a regime that has held for six weeks, not a rounding artifact of the shorter window, and it is also not a quirk of how we aligned hourly candles: at 2026-08-13 08:50 UTC we read each venue's own ticker, which quotes mark and index side by side in a single response on Binance, Bybit and Bitget, and needs two calls eight milliseconds apart on OKX, and got minus 5.12 basis points on Binance, minus 4.95 on Bitget, minus 4.75 on OKX and minus 3.98 on Bybit. On the two venues that also publish the last traded price in that same payload, the traded price sat below the index too, by 5.01 basis points on Bitget and 4.57 on Bybit. The contract really is changing hands below the basket.
One caution before reading anything into four venues agreeing. They are not four independent witnesses. They publish the same funding formula, with the same constants, and the next section shows that where the contract sits is consistent with that formula rather than with any view of the market. Four venues agreeing here is one mechanism observed four times, which is a weaker claim than it looks and a more useful one, because it means the number is predictable rather than sentimental. If you want the general vocabulary for a contract trading off its spot reference, the Athenum piece on basis and contango covers it; what follows is specific to perpetuals.
Why did longs keep paying funding on a perpetual that was cheaper than spot?
Because funding is not a measurement of the premium. It is a formula applied to the premium, and the formula has a subsidy built into it. Binance, OKX, Bybit and Bitget all publish the same shape: the funding rate is the average premium index plus a clamped interest term, F = P + clamp(I - P, +0.05%, -0.05%), with the interest rate I fixed at 0.01% per eight-hour funding interval. The Athenum note on the premium index takes that expression apart term by term; what matters here is one consequence of it.
Work through that expression once and it stops being opaque. While the premium P sits between minus 0.04% and plus 0.06%, the clamp returns exactly I - P, the two premium terms cancel, and funding is exactly I whatever the market is doing. Once P falls below minus 0.04%, the clamp saturates at +0.05% and funding becomes P + 0.05%, a straight line. So a perpetual sitting at parity with its index would charge longs the full 0.01% per eight hours, which is 10.95% annualized, for nothing at all. The contract has to trade below its index before that charge falls to something a carry desk will accept, and where it comes to rest is set by a constant in a formula rather than by anyone's view of Bitcoin.
One precision matters here and it cuts against our own headline measurement. The P in that formula is not mark minus index. It is built from the venue's impact bid and ask against the index price and then time-weighted across the whole funding interval. The gap we have been measuring is a proxy for it, a good one, but not the input itself.
So we tested the formula against the input it actually uses. Binance and Bybit both publish their premium index as a minute-by-minute series and their settled funding rates as a separate history, which makes the identity checkable end to end without touching our own data. For the interval that settled at 2026-08-13 08:00 UTC, the time-weighted average premium index was minus 0.042356% on Binance and minus 0.044129% on Bybit. Put those through the published formula and it predicts +0.007644% and +0.005871%. The rates the two venues actually settled were +0.007218% and +0.006966%, so the reconstruction lands within 0.00043 and 0.0011 percentage points. We sample the minute series where the venues sample every five seconds, which is where the remaining difference lives.
Two consequences follow, and one of them corrects a reading we were tempted by ourselves. The first is the pinned value: across our 578 hours funding sat at exactly +0.01000% per eight hours in 47 of them on Binance, 49 on OKX, 75 on Bitget and 30 on Bybit, and in exactly those hours the gap was narrower than usual, a median of minus 3.88 basis points on Binance against minus 4.34 in the other 531 hours. That is the clamp doing what it says. The second is that +0.01% is not a cap, however much it looks like one in a chart of a quiet market. Binance documents a funding cap of plus or minus 0.30% per interval for this contract and Bybit plus or minus 0.50%, thirty and fifty times wider, and the rate is not floored at zero either: over Binance's last 500 settled intervals, running from 2026-02-28 to 2026-08-13, 161 were negative and the lowest was minus 0.012276%.

The two series drawn on one time axis. Above: the perpetual trades below the spot basket in every hour. Below: funding on the same hours is mostly positive, so the side holding the cheaper-than-spot contract is the side paying. The dotted line marks plus 0.010 percent per eight hours, the level the rate keeps returning to on all four venues.
Counted over the 578 hours where our funding series and our price series line up, funding was positive in 560 hours on Binance, 517 on Hyperliquid, 504 on OKX, 438 on Bybit and 419 on Bitget, with medians of +0.00584%, +0.00765%, +0.00386%, +0.00376% and +0.00315% per eight hours. Those are hourly readings of a rate that only changes hands three times a day, so we also counted the stamps that actually settle. Of the 71 settlement stamps inside the window, the rate was positive at 70 on Binance, 62 on OKX, 56 on Bitget and 50 on Bybit. The pattern is real and it is not uniform: longs paid at 99% of Binance settlements and 70% of Bybit ones, so "longs always pay" would be overstating it by nearly a third of the sample on the venue where it is weakest.
What a single-venue page cannot show is what that costs at this moment. Reading Athenum's live cross-venue feed for the Bitcoin perpetual at 2026-08-13 07:00 UTC, and putting every venue on a common eight-hour basis, funding was positive everywhere: +0.0027% on Hyperliquid, +0.0068% on Bybit, +0.0081% on Binance, +0.0085% on OKX and +0.0093% on Bitget, a spread of 0.0066 percentage points between the cheapest and the dearest place to be long. Hyperliquid appears in that list and nowhere else in this post: it settles funding hourly rather than every eight hours, so its rate is converted to a common basis to be comparable, and it is not one of the four venues in the price panel. Over the past 168 hours that same cross-venue spread had a median of 0.0073 points, a middle half of 0.0057 to 0.0095 and a peak of 0.0243, so 2026-08-13 07:00 UTC was an ordinary hour rather than a wide one. You can turn any of those rates into a holding cost with the Athenum funding rate calculator, and the sign of the rate is itself venue-specific, as we measured in our post on negative funding by exchange.
Do the four exchanges at least agree on the trigger price?
More closely than most people would guess, and less closely on the trigger than on spot. Taking the highest minus the lowest of the four venues in the same hour, the index price spread had a median of 2.46 US dollars, or 0.379 basis points, with a middle half of 1.62 to 3.79 dollars and a worst hour of 30.97 dollars. The mark price spread was about three times wider: a median of 7.80 dollars, or 1.216 basis points, a middle half of 5.38 to 11.20 dollars, and a worst hour of 34.20 dollars at 2026-07-29 19:00 UTC.

Highest minus lowest of the four venues in the same hour, drawn as full distributions rather than as two averages. The exchanges agree on what Bitcoin is worth to a median of 0.38 basis points, and on what your position is worth to a median of 1.22, because the mark carries each venue's own premium on top of a basket that is itself venue-specific.
Put those two numbers next to each other and the practical ranking is clear. The 7.80 dollars above is the widest of four venues in the same hour; between any two of them the median difference is 3.80 dollars, with a middle half of 1.77 to 6.70. Whether you read the mark or the spot index differs by about 28 dollars, which is 3.7 times the four-venue spread and more than seven times a typical pair. Which exchange you picked is the smaller question. On 2026-08-13 07:00 UTC specifically the four index prices spanned 1.40 dollars, from 63,863.20 on Bitget to 63,864.60 on OKX, while the four mark prices spanned 12.50 dollars, from 63,825.50 on Bitget to 63,838.00 on Bybit.
Does the disagreement get worse when Bitcoin moves?
Yes, and the honest addition is: not by very much. Ranking all 599 hours by that hour's own high-to-low range and splitting them into deciles, the median cross-venue index spread rises from 0.29 basis points in the calmest tenth to 0.48 in the busiest, and the median mark spread from 0.98 to 1.23, though the mark line is not a staircase: it peaks at 1.39 in the sixth decile, not the tenth. The rank correlation between an hour's range and its cross-venue spread is +0.201 for the index and +0.154 for the mark. Shuffling the same data 5,000 times under five different seeds, 25,000 shuffles in all, reached a correlation that large 0 times for the index and 2 times for the mark, so both survive at p below 0.001 while the mark is the weaker of the two. Neither is large: the rank correlation accounts for 4.0% of the variation for the index and 2.4% for the mark.

Cross-venue spread by volatility decile, with the middle half of each decile shaded. The trend across the deciles is upward and it survives a shuffle test, but the bands overlap so heavily that no single busy hour can be predicted from the decile it lands in. Each decile holds 59 hours and the last one 68.
The bands in that picture are the point. A rising line of medians would be easy to over-read as "the venues fall apart under stress". They do not, at least not at this scale of stress: on the mark line the middle half of the calmest decile and the middle half of the busiest overlap across most of their length, so knowing an hour's decile tells you very little about that hour's spread. The largest single-hour mark spread in the whole window, 34.20 dollars, is still only 5.38 basis points, and it is roughly the same size as the mark-versus-spot gap that was present in every ordinary hour.
The discount itself behaves differently again, and we checked this specifically because the pessimistic version of the story would matter a great deal. Averaged across the four venues and cut by the same volatility deciles, the gap has a median of minus 4.71 basis points in the calmest tenth of hours and minus 4.31 in the busiest. Note the sign of that: the gap gets smaller as the market gets busier, and the rank correlation confirms it at +0.130, with 4 of 5,000 shuffles reaching that far. It is also the same whichever way price went, minus 4.46 basis points across the 299 falling hours and minus 4.53 across the 299 rising ones, which is 598 of our 599 hours because the first has no hour before it. So the discount is a level, not a stress amplifier. It does not blow out at the moment a leveraged long is most exposed, which is the version of this finding that would have been alarming and is not what the data shows.
Why do the exchanges disagree about the price of Bitcoin at all?
Because they are not averaging the same markets, and all four of them publish exactly what they are averaging. Binance lists eight spot markets, OKX five, Bybit six and Bitget six, each with its weight, and reading the four side by side shows four different definitions of the same three words.

All four baskets, read from each exchange's own public endpoint on 2026-08-13, Binance and OKX at 08:50 UTC and Bybit and Bitget at 09:13 UTC. Binance and OKX use fixed weights while Bybit and Bitget re-weight by 24 hour volume, which is why Bybit hands Binance spot 44.43 percent, more than the 22.66 percent it gives its own market. Only OKX carries a USD-quoted leg, the Coinbase BTC/USD market at 18.75 percent.
Three things in that picture do real work. The first is self-weighting, and it is not shy: Binance takes 43.48% of its Bitcoin index from Binance spot, Bitget takes 30.00% from Bitget, OKX takes 25.00% from OKX and Bybit 22.66% from Bybit. Every basket also contains Binance spot, which is the one market none of them can leave out.
The second is that the four are not built the same way. Binance and OKX publish fixed weights, exact fractions that only change by announcement. Bybit and Bitget re-weight by 24 hour volume, which is why Bybit's basket gives Binance spot 44.43%, almost twice its own 22.66%, and why the same Coinbase BTC-USDT market that carries 13.04% of the Binance index carries 0.14% of the Bybit one. One spot market can count for ninety-three times more in one Bitcoin index than in another.
The third is the quote currency. Twenty-four of the twenty-five legs across the four baskets are quoted in USDT, and only one is not: Coinbase BTC/USD, which it converts. At 2026-08-13 08:50 UTC that leg was priced at 63,712.80 US dollars and entered the OKX index at 63,775.30, a conversion factor of 1.000981, which implies a tether price of about 0.99902 dollars at that moment. Against an 18.75% weight that conversion is worth 11.72 dollars on the OKX index, or 1.84 basis points, so a stablecoin's own price quietly enters a Bitcoin index through one leg. It is a unit correction rather than a thumb on the scale, and our own panel shows it working: across the 599 hours OKX's index sits a median of 0.28 dollars above the four-venue mean, not eleven. Skip the conversion and OKX's index would sit roughly 11.72 dollars below its peers, nearly five times the median cross-venue disagreement of 2.46. None of this explains the discount we started with, though. Binance's basket contains no USD-quoted leg at all, and Binance's perpetual still traded 4.29 basis points under it.
How do you read your liquidation price without fooling yourself?
1. Read the mark, not the chart. The number that closes your position is the venue's mark price. On 2026-08-13 07:00 UTC that number was 63,833.26 on Binance while the same venue's spot index read 63,863.91.
2. Do not price the gap as a cost, because it cancels. This is the intuitive reading and it is the wrong one, so it is worth the paragraph. Your entry was a mark price and your liquidation level was computed from it, so the discount sits on both ends of the trade. Write the mark as the index times (1 - d): you enter at I0(1 - d), the venue sets your level at I0(1 - d)(1 - m) for a maintenance distance m, and the mark reaches it when the index reaches I0(1 - m). The d divides out exactly. A long in a market with a 4.5 basis point discount is liquidated at the same index level as a long in a market with none.
3. Price the movement of the gap instead, which does not cancel. What can move your trigger in index terms is how far the discount travels between the hour you enter and the hour you are closed out. That is small and we can put a number on it: across the 599 hours the four-venue average discount has a middle half only 0.74 basis points wide, about 4.74 dollars, and it moves by a standard deviation of 0.74 to 0.92 basis points from one hour to the next, roughly 4.72 to 5.90 dollars. So the exposure this creates is single digit dollars per Bitcoin, not the 28 the level would suggest. The stability of the discount is exactly what makes it harmless, and an unstable one would not be.
4. Do not read funding as the premium. Funding was positive at 70 of the 71 Binance settlements in the window while the gap was negative in every one of the 599 hours. Positive funding does not mean the contract is trading rich, it means the clamped interest term has not been used up yet.
5. Check which basket your venue uses. Two exchanges can weight overlapping spot markets differently, re-weight them by volume, and quote one of them in a different currency, which is worth a median of 2.46 dollars of index disagreement and occasionally 30.97.
6. Size the position on the venue you will actually use. Between any two of the four venues the mark differs by a median of 3.80 dollars, with a worst four-venue hour of 34.20, so the venue you pick moves the trigger by less than a rounding error on most days. Where positioning does lean, it leans on the crowd rather than on the mark, which we measured in our study of ten published long/short numbers. The Athenum liquidation calculator takes an entry, a leverage and a maintenance margin and returns the level, and the leverage calculator shows how quickly that level approaches as size rises.
What this is and is not
Every price figure above comes from an endpoint the exchange itself publishes without authentication, so any reader can pull the same rows and get the same answer. The one exception is stated where it appears: the per-venue funding series, including the five-venue reading for 2026-08-13 07:00 UTC, comes from our own cross-venue feed, because no single venue publishes the other four. The window is 599 hours because that is what all four venues serve in common: Binance and Bybit each return about 1,000 hourly candles, OKX and Bitget about 600, and we cut to the intersection rather than compare venues over different periods. We dropped the newest bar of every series before measuring, then tested whether the precaution mattered rather than assuming it. Re-pulling every endpoint at 2026-08-13 09:01 UTC, after the 08:00 UTC hour had closed, changed 6 of the 6,392 rows the two pulls share. Six and not eight: the eight series are an index and a mark series per venue, and Bitget's two had already rolled at the first pull, so their newest bar was complete and did not move. In the other six, the row that changed is the one that was still filling. No completed bar moved anywhere, so the precaution mattered and nothing else did.
Three limits are worth stating plainly. First, this is a regime and not a constant of nature. The resting point is anchored on a published constant, the 0.01% interest rate per interval, so a venue that changed that constant, or a market that pushed the premium far enough for the clamp to stop binding, would move the gap somewhere else. Second, the four venues are not four independent confirmations of anything, because they share the formula, and we have said so where it matters rather than counting the agreement as evidence. Third, we compare each venue's mark against its own index, so no choice of ours about which spot price is correct can contaminate the result. Where we do compare venues against each other, the numbers are correspondingly tiny and we have reported them at that size.
One number in this post is easy to misread and should not be. The implied tether price of about 0.99902 dollars is a rate derived from one exchange's index construction at one instant, not a traded quote, and a stablecoin resting a few basis points under a dollar has been ordinary rather than notable. It also cannot be the cause of the discount we measured, because the perpetual and the index are both quoted in the same currency, so the peg cancels out of the comparison.
Nothing here is a forecast. A perpetual trading below spot does not predict the next move, and a positive funding rate does not either. The claim is narrower: the price that closes your position is a different number from the price you are watching, that difference had one sign for twenty-five straight days on four exchanges, its size follows from a formula those exchanges publish, and it is checkable in a single API call whenever you want to know where it stands.
Every price above came off endpoints anyone can call, and the cross-venue funding beside them came off Athenum's live normalized feed. The 34 calculators sitting beside that feed are free of charge: none asks for an account, none asks for an email, and none limits how many times you can run it. If you want the cross-venue view in one place, Athenum opens on a free 7 day Pro+ trial with no card.
One terminal. All the data.
Liquidations, orderbook depth, whale walls & open interest from 4 exchanges, all real-time, in one place.
No credit card required

Athenum Analytics
Athenum Analytics is our three-person editorial team covering crypto derivatives, market data and macroeconomic context.