Liquidation heatmap limitations
A bright zone is a reason to inspect the model and the market. It does not establish a future liquidation, an executable order or a trader's intent.
By Athenum Analytics · Reviewed . This checklist addresses interpretation failures; the introductory heatmap guide covers the reading workflow.
First identify what the color represents
| View | What it measures | What it cannot establish |
|---|---|---|
| Estimated liquidation heatmap | A model of potential liquidation concentrations under position and leverage assumptions. | Exact future liquidation volume or every account's liquidation price. |
| Order-book heatmap or wall | Displayed resting liquidity within the feed's visible depth. | A guaranteed fill, hidden liquidity or the owner's intent. |
| Reported liquidation prints | Events delivered by the selected venue's liquidation feed. | Complete global liquidations when feeds differ or omit events. |
Which timeframe should an intraday trader use?
There is no universally correct lookback. The chart lookback describes the data included in the display; your holding period describes the trade. Record both. Compare a short and a longer lookback with the same venue, model, scale and current price. A level that appears only after changing normalization needs a different interpretation from newly observed orders.
Can Whale Walls detect spoofing?
Athenum's Whale Walls lifecycle view helps examine visible levels as they appear, persist and change. A high score or a disappearing wall is an observation, not a finding of manipulation. A cancellation can reflect repricing, risk management or changing liquidity. Execution, feed gaps and depth limits can also change the display.
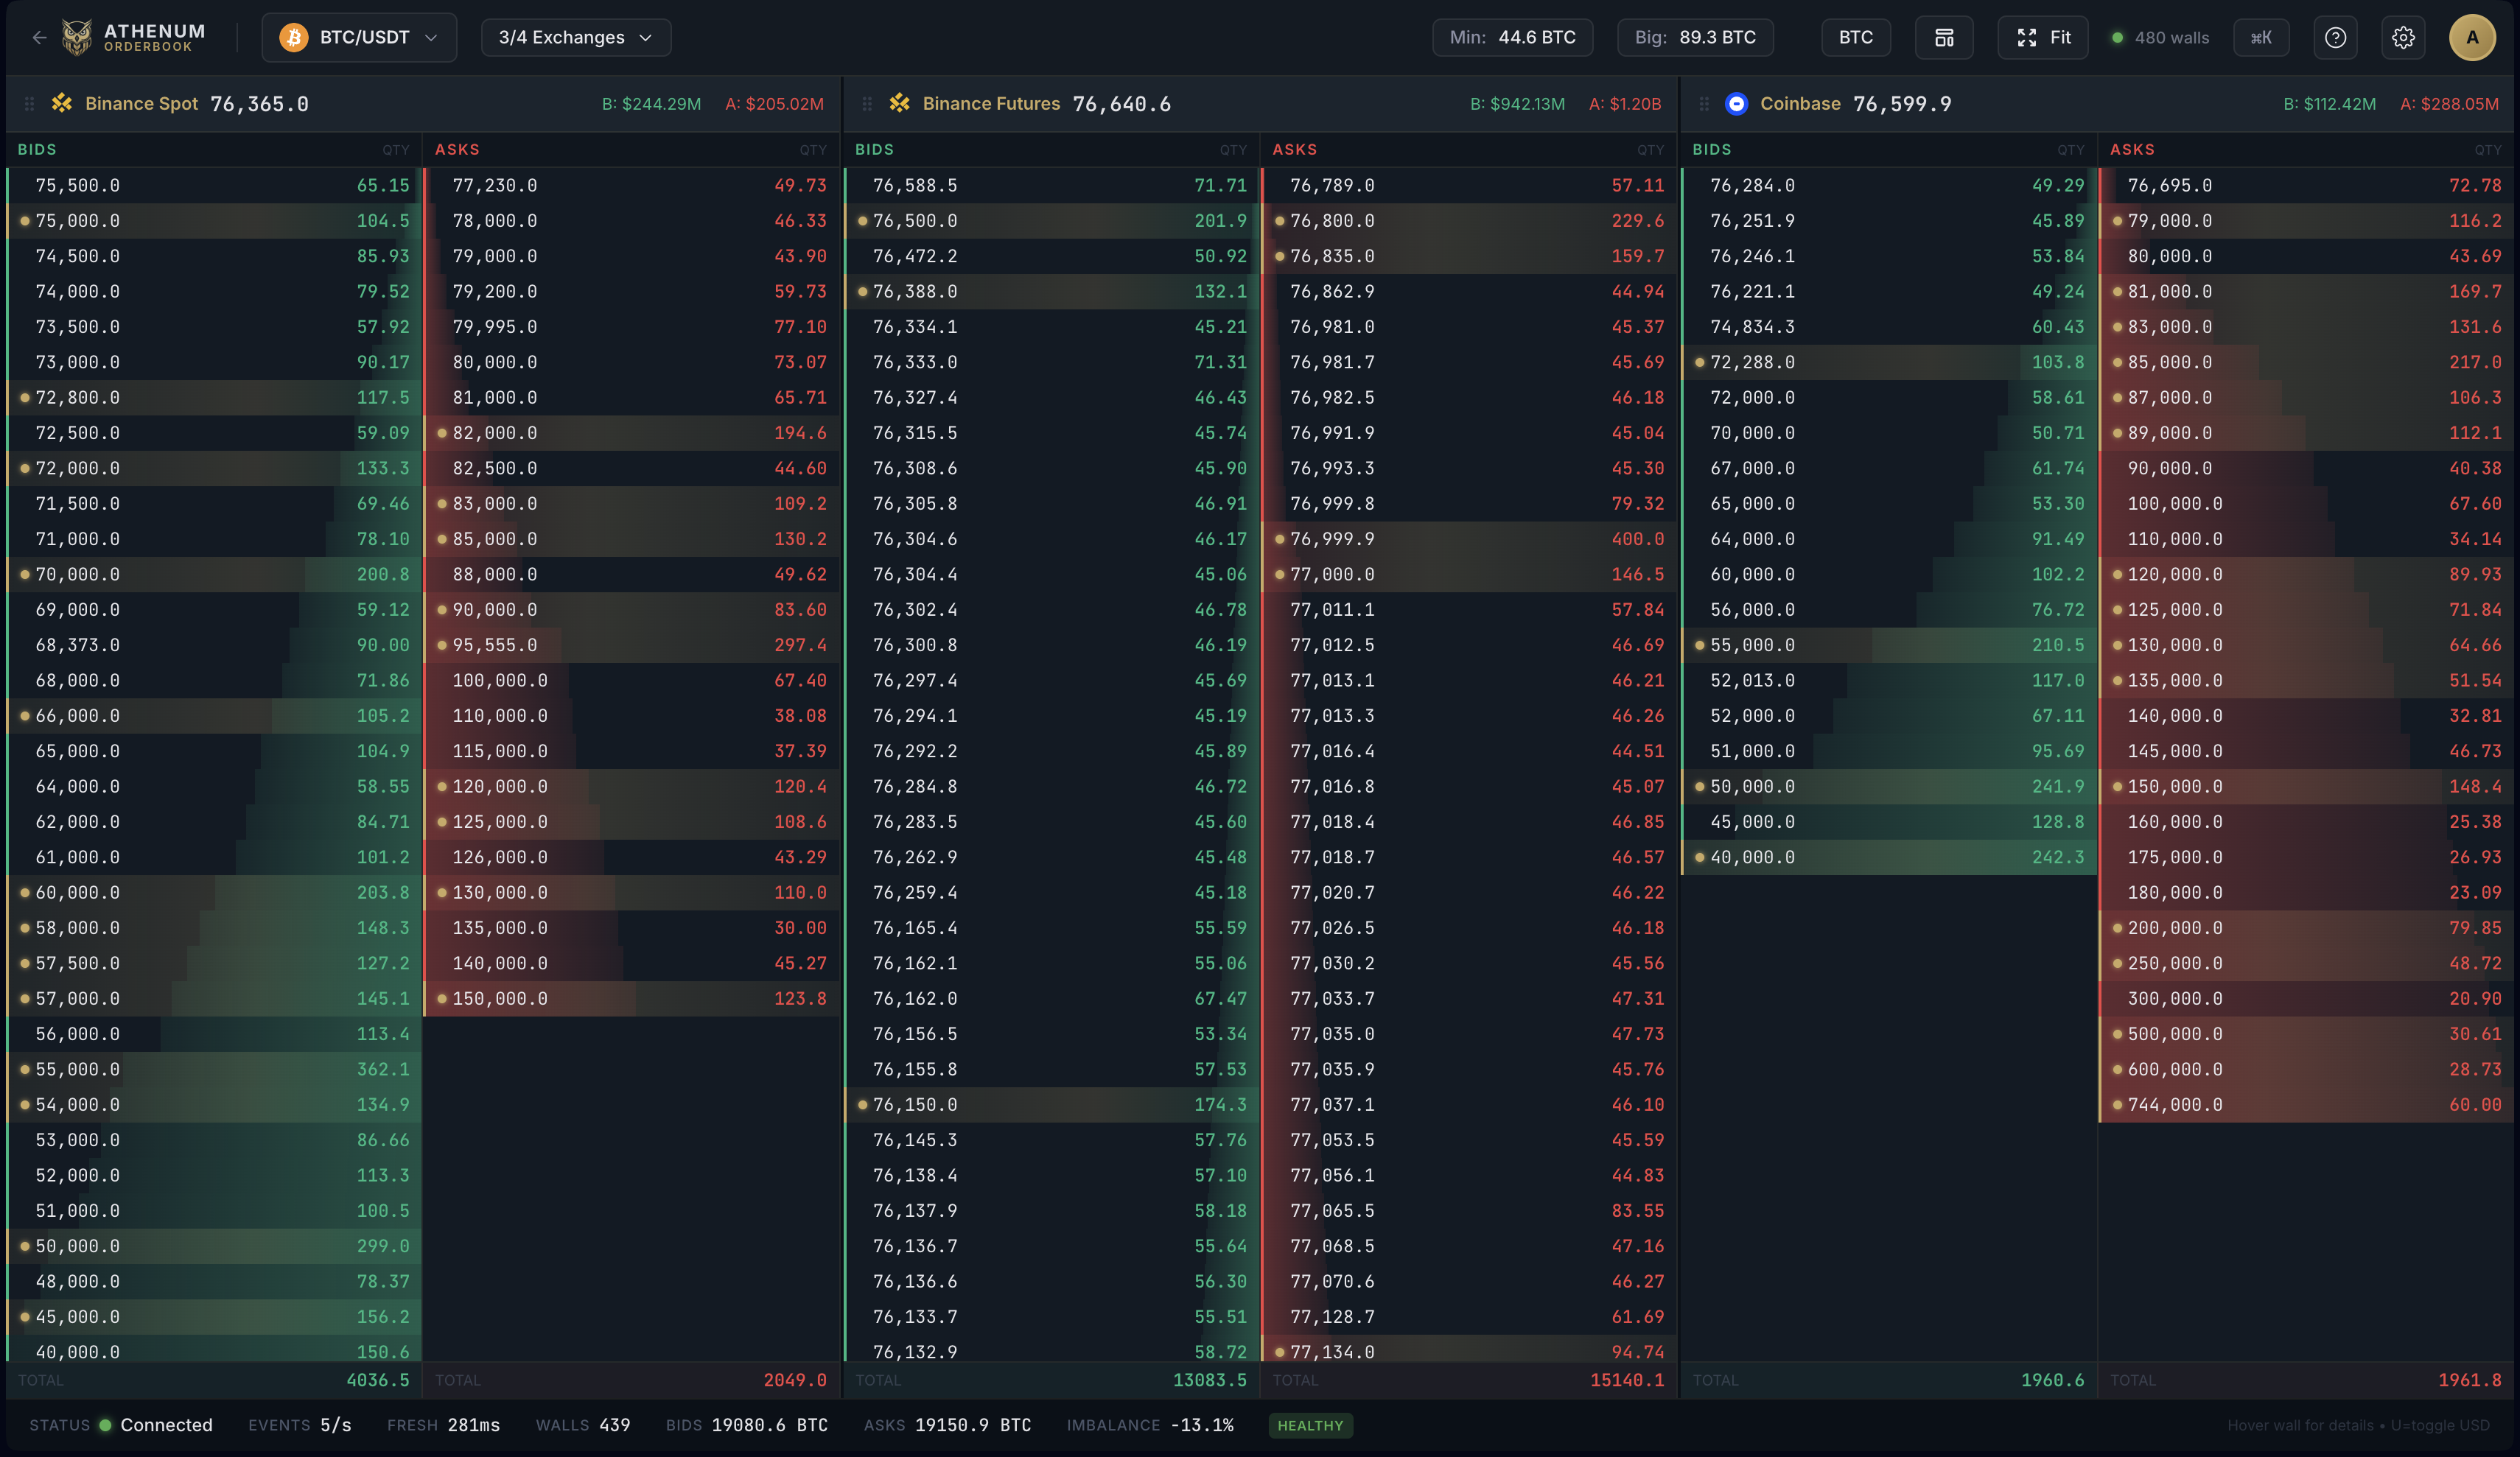
A repeatable wall-review checklist
- Save the exact venue, contract, quote currency, UTC time and depth boundary.
- Follow the level over time. Separate additions and cancellations from executed volume.
- Check whether the level moved outside the subscribed depth or the feed disconnected.
- Compare spot and futures separately before constructing an aggregate.
- Record what would invalidate your interpretation. Do not convert persistence into a promised price target.
What our historical liquidation study adds
Our BTC leverage study used 8,760 hypothetical entries from 2025-08-25 to 2026-08-25. Under its fixed 0.4% maintenance-margin model, 3,399 hypothetical 20x longs touched the threshold within seven days. These are overlapping historical windows, not observed account liquidations or a forecast. Fees and funding were excluded. The result illustrates why the model and denominator must accompany a percentage.
Compare the definitions before comparing products
CoinGlass explains its estimated heatmap concentrations. Bookmap documents depth-boundary and heatmap settings. Different pictures can result from different inputs and display rules. See Athenum vs CoinGlass and Athenum vs Bookmap for workflow-specific checks.
Report a correction with the model, venue, timestamp and source.