Range analysis and acceptance · 1 / 5
Define a locked-in range as a hypothesis you can test
Locked-in range analysis links a period of contained price action with changes in outstanding exposure. Its useful part is the question it raises: how does price behave when it leaves an area where exposure grew? The name must not become a claim that every participant is known or unable to exit.
Athenum8 minUpdated:
Make the range reproducible
Record instrument, venue set, timezone, start, end and the rule for its boundaries. One study might use the high and low of a fixed two-hour window; another might require repeated tests of a zone. These are different methods. Choose one before looking at the subsequent breakout, and keep the original selection when documenting the outcome.
Measure normalised OI across that same window. A rise indicates net growth under the chosen convention, not a precise count of traders whose entries sit inside the box. Transfers and offsetting openings/closures can replace holders. Dollar revaluation can also imitate growth if the OI series is not normalised.
Treat departure from the range as a new test
An upside departure may put some shorts under pressure; a downside departure may pressure some longs. Yet hedging, collateral and different entries make individual responses uncertain. You do not need an omniscient market-maker story to investigate whether the boundary is accepted or rejected.
Write an acceptance condition and an invalidation condition. For example, two completed five-minute closes beyond a boundary followed by a defined retest create an observable sequence. The parameter choice is a research hypothesis, not a universal standard. Compare outcomes across all qualifying ranges instead of selecting only those followed by dramatic trends.
Freeze a two-hour box
From 09:00 to 11:00 UTC, an illustrative asset trades between 100 and 102. Normalised single-sided OI rises from 1,000 to 1,250 contracts, a 25% increase. At 11:00, freeze the range and record the data. No later candle may move its start or boundaries in this version of the study.
You then test an upside departure using two five-minute closes above 102. A wick to 102.40 followed by a close at 101.80 does not qualify. A qualifying departure can still fail later; specify whether a completed close back below 102 invalidates the setup and include execution costs in any trade simulation.
| Field | Declared value |
|---|---|
| Observation window | 09:00–11:00 UTC |
| Range boundaries | 100–102 |
| Normalised OI | 1,000 → 1,250 contracts |
| Net OI growth | +25% |
| Upside qualification | Two completed 5-minute closes above 102 |
- 1Select fixed window
- 2Record range and OI
- 3Freeze settings
- 4Test departure
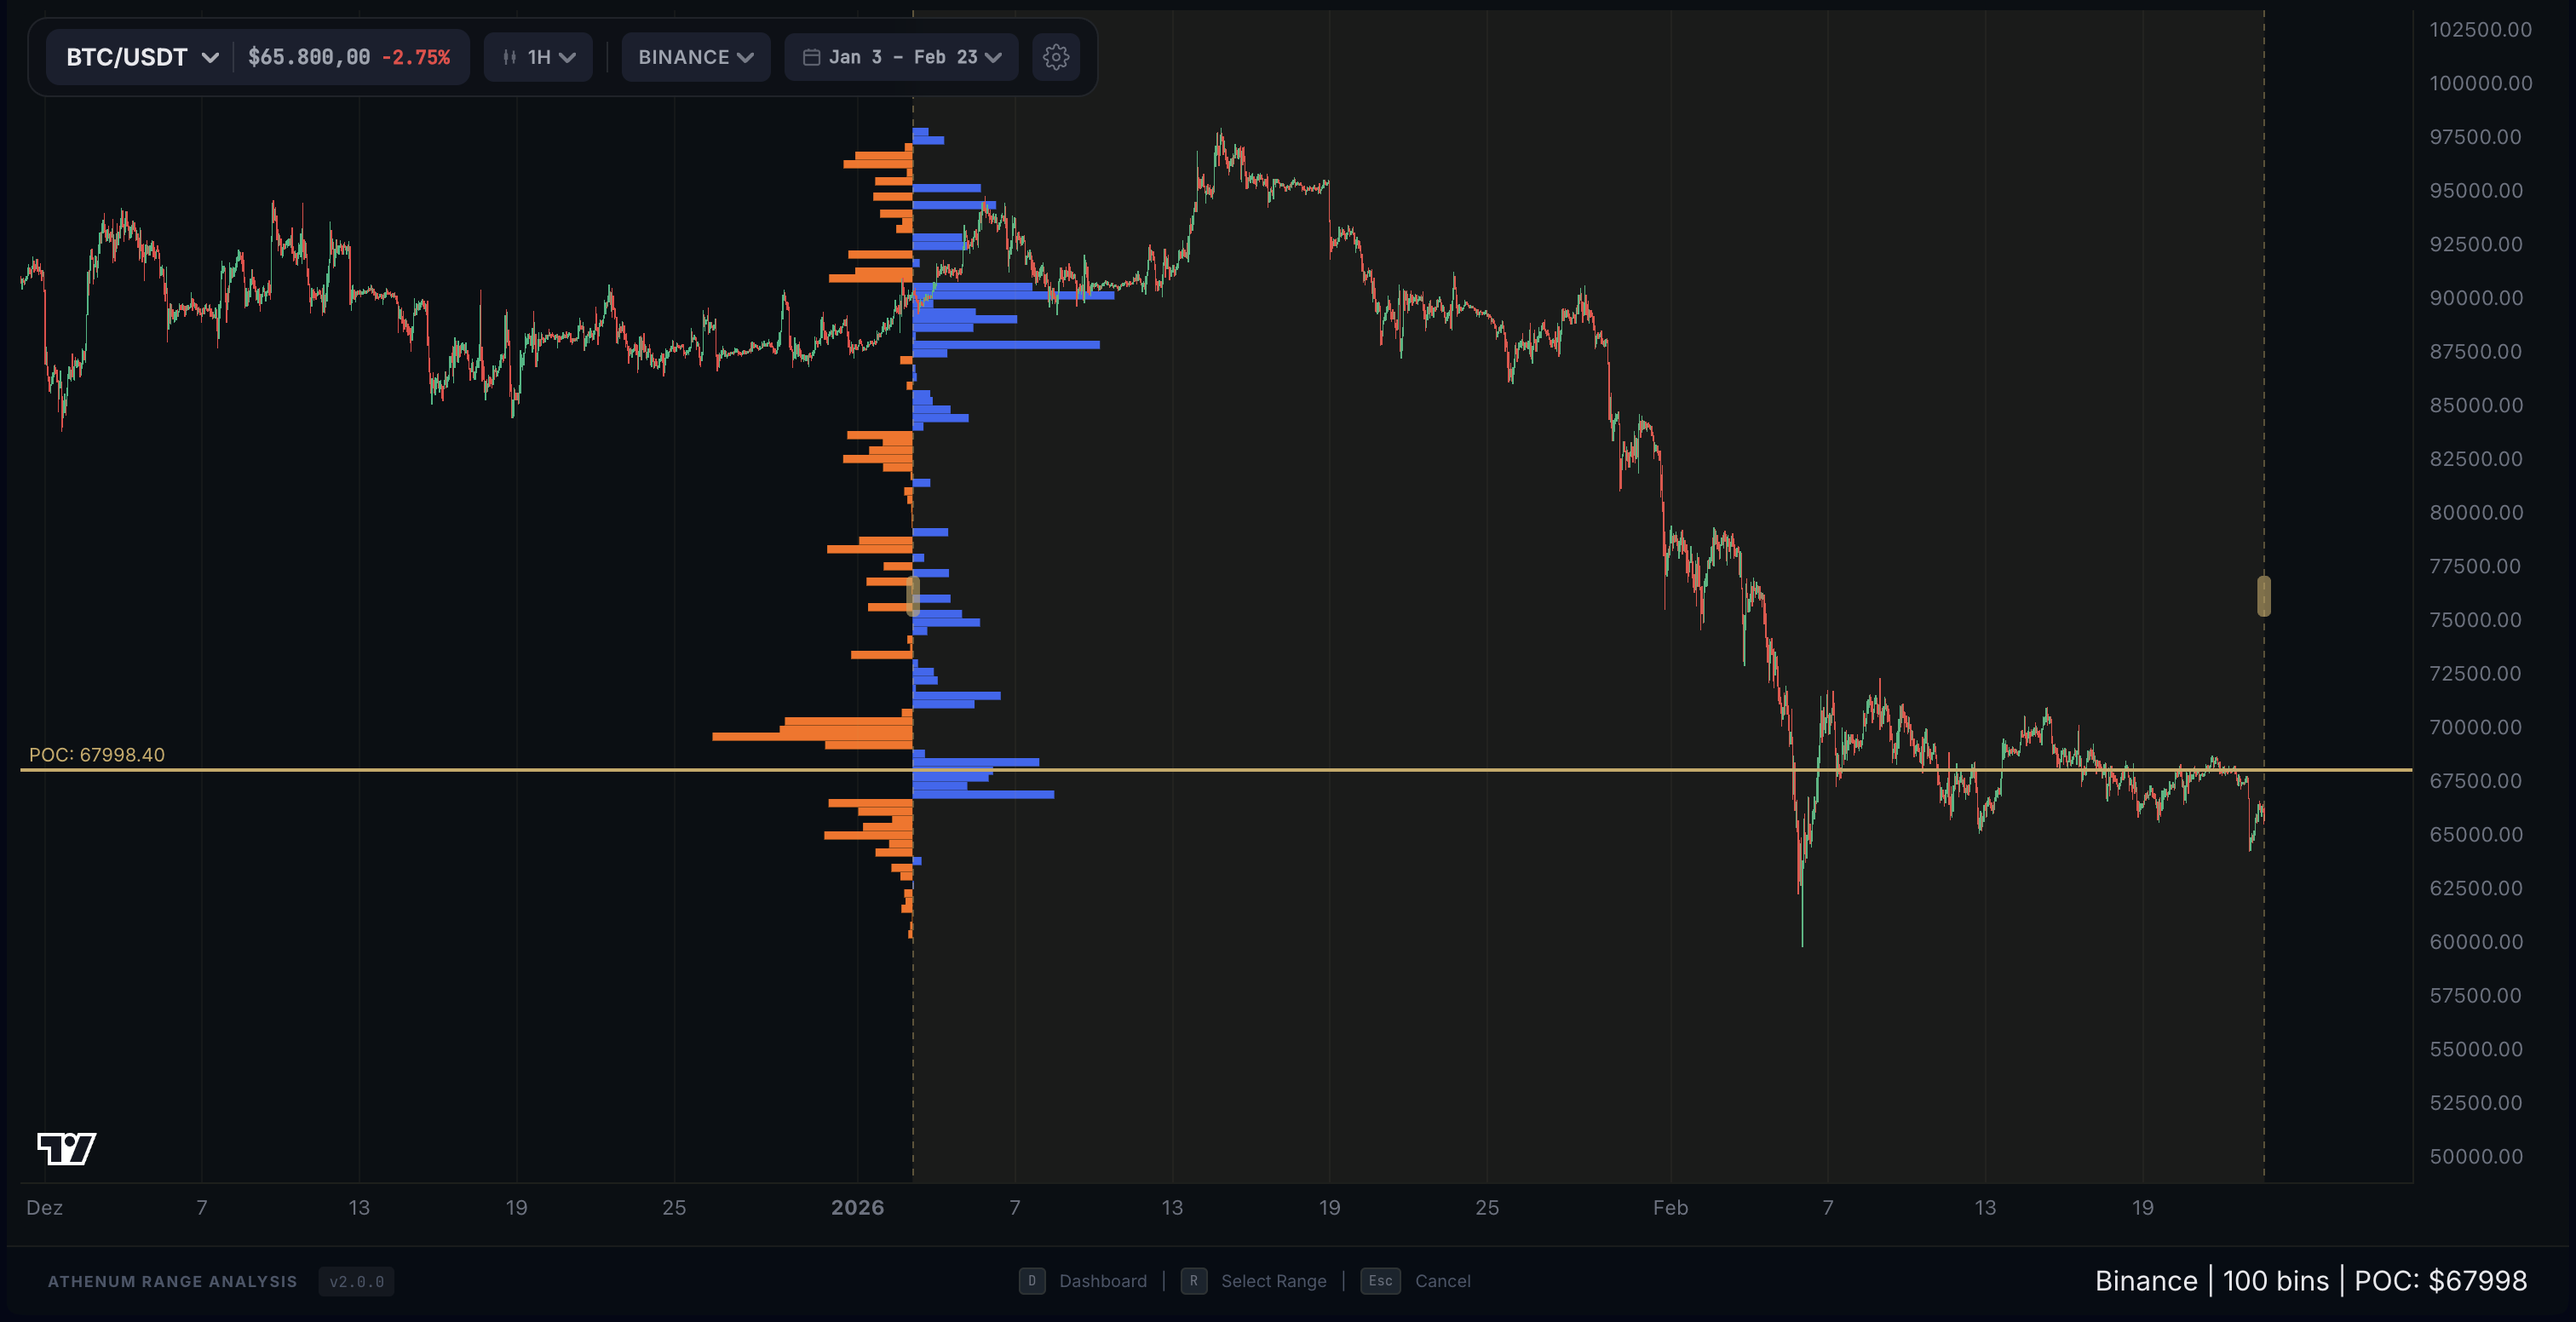
High OI does not prove a locked original cohort
A new holder can replace an old holder while OI stays constant. Some positions may also have opened before the range or be hedged on another market. Describe the setup as a range with observed exposure growth. Claims about exact trapped entries, private stops or a single controlling market maker go beyond the evidence.
Before acting
- Fix instrument, venues, timeframe, timezone and selection rule.
- Save the range before the departure occurs.
- Normalise OI and record missing observations.
- Define acceptance, invalidation and maximum evaluation time.
- Keep all qualifying ranges, including uneventful and failed departures.
Check your understanding
After a failed breakout, you move the range start forward until its OI increase becomes much larger. Can the revised range validate the original rule?
Show the explained answer
No. The selection changed after the outcome was known. Preserve the original failed observation. A new selection rule can be investigated as a separate version, but it needs evaluation on later data that did not choose the rule.