Compare trading workspaces · Reviewed
Athenum vs CoinGlass
Compare Athenum and CoinGlass by trading task: funding, liquidation estimates, order-book evidence and macro context, with sources and practical checks.
Published by Athenum Analytics, the maker of Athenum. This is our assessment of workflow fit, based on the linked documentation and our product. It is not an independent benchmark or a measured performance ranking.
Which fits your task?
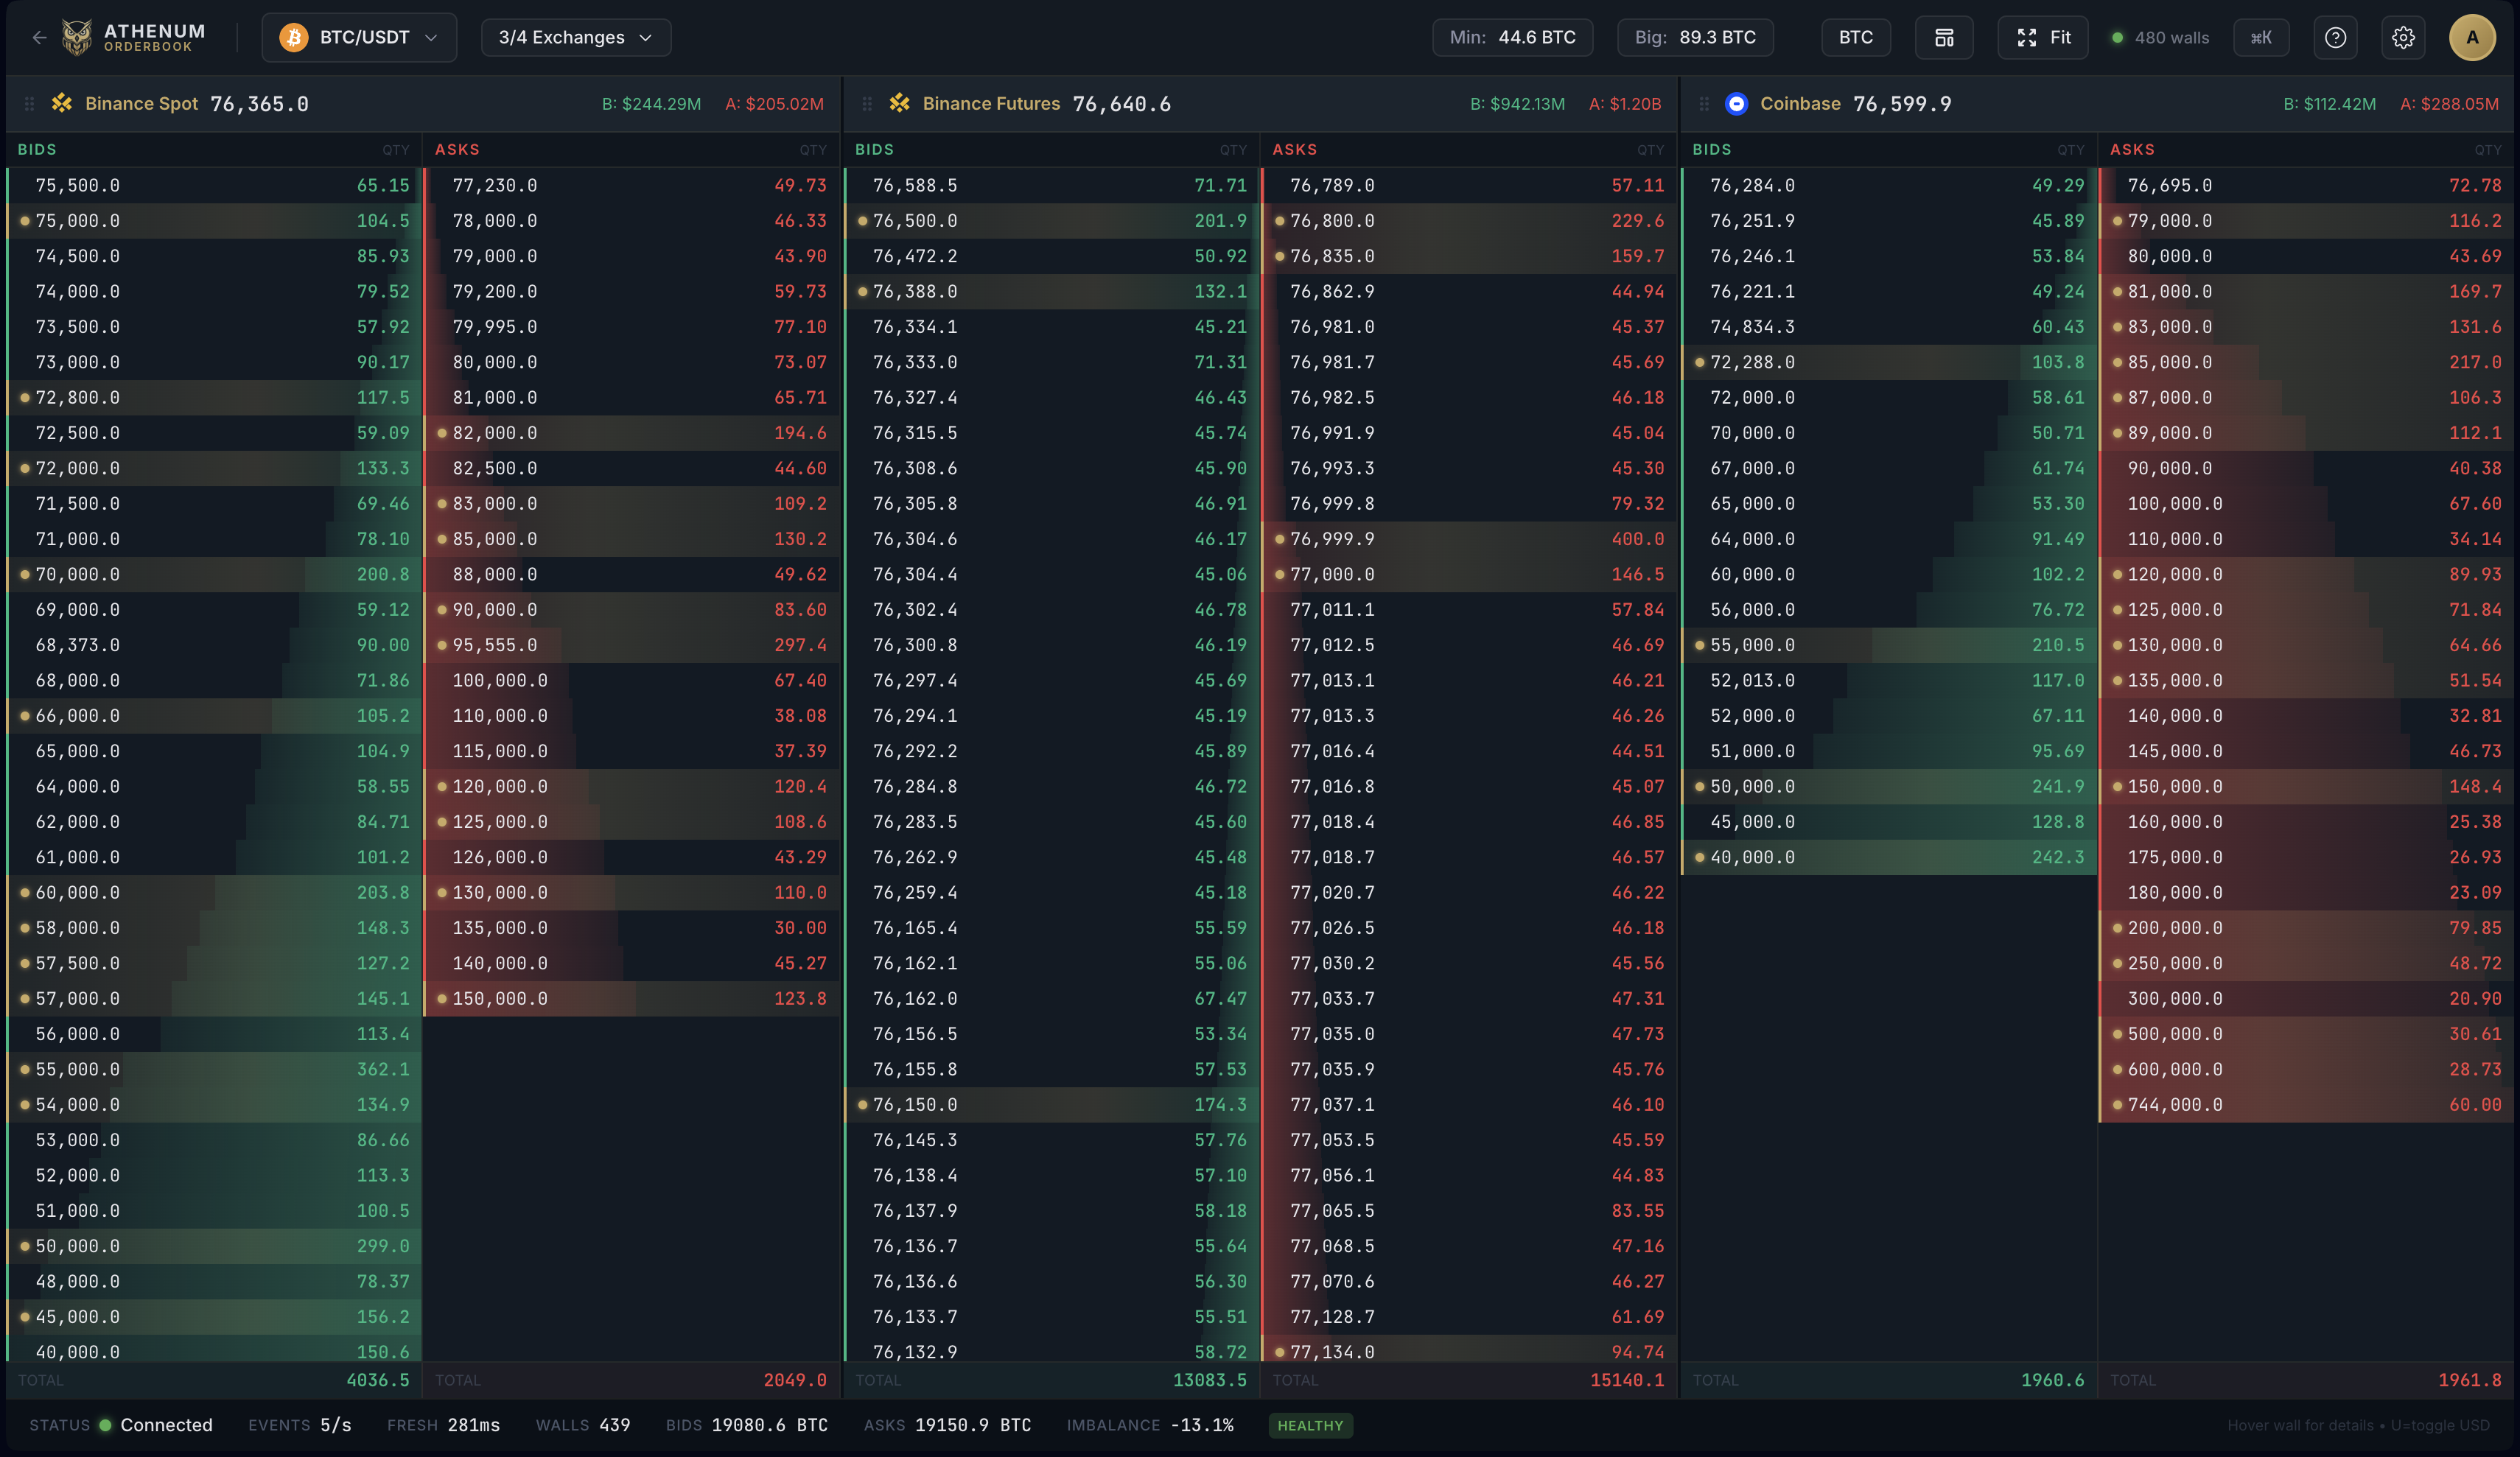
Consider Athenum when your question joins exchange positioning with economic events and the behavior of visible order-book walls in one workspace. Start by matching the same contract and timestamp across panels.
Keep CoinGlass in your workflow when you depend on its liquidation-map models or its funding and open-interest comparisons. Those are useful specialist views; an Athenum order-book wall is a different kind of evidence.
| Task | Athenum | CoinGlass |
|---|---|---|
| Funding comparisons | Funding views alongside positioning and macro panels; compare the exact settlement interval. | Documents exchange, cumulative, OI-weighted and volume-weighted funding endpoints. |
| Liquidation heatmaps | Liquidation data and visible order-book liquidity have separate meanings. Whale Walls follows displayed book levels. | Its heatmaps estimate potential liquidation concentrations. Intensity is relative, not an exact count of future liquidations. |
| Macro workflow | Economic events and macro context can be read alongside derivatives panels. | Do not infer a missing macro feature from a funding screenshot. Verify the current product view against your specific event workflow. |
| Interpretation | Use wall persistence, changes and executions as observations; they cannot prove trader intent. | Compare the selected model, venue and lookback before interpreting a bright zone as risk. |
Can either tool tell me that a bright level must be liquidated?
No. A modeled liquidation zone depends on position and leverage assumptions. A visible book wall is a resting order that can change or cancel. Neither establishes a price target, an inevitable liquidation or proof of spoofing.
A practical comparison you can repeat
For a BTC funding decision, record the exchange, contract, rate interval, last update and planned holding period. Then compare signed funding with your own fee tier. Our Binance study found a fee crossover at hour 136 in one historical window; it is not a rule for the next trade.
Evidence and limits
Our Bitcoin perp holding-cost audit compares funding with fees in a stated historical sample. For visible liquidity, read Whale Walls behavior and limitations and the heatmap interpretation checklist. Prices, entitlements and feed coverage can change; verify the exact edition and market before paying or migrating.
Sources checked for this comparison
For a broader shortlist, see the CoinGlass alternatives guide. For another direct comparison, visit the workspace comparison directory.
Send a correction with the product edition, source URL and date.