Table of Contents6 sections
- What does the Bitcoin funding rate actually measure?
- Does a high Bitcoin funding rate predict the next eight hours?
- Does funding at least describe the move it just priced?
- The 2026-08-28 Bitcoin funding print is the highest on the board. What does that predict?
- We have said this four times without measuring it. Two Athenum posts said the opposite.
- How can you check this yourself?
Practise with worked lessons
- Distinguish crowded positioning from a squeeze
Use funding and open interest as context for crowded positioning. Require an adverse price move and forced-flow evidence before calling it a squeeze.
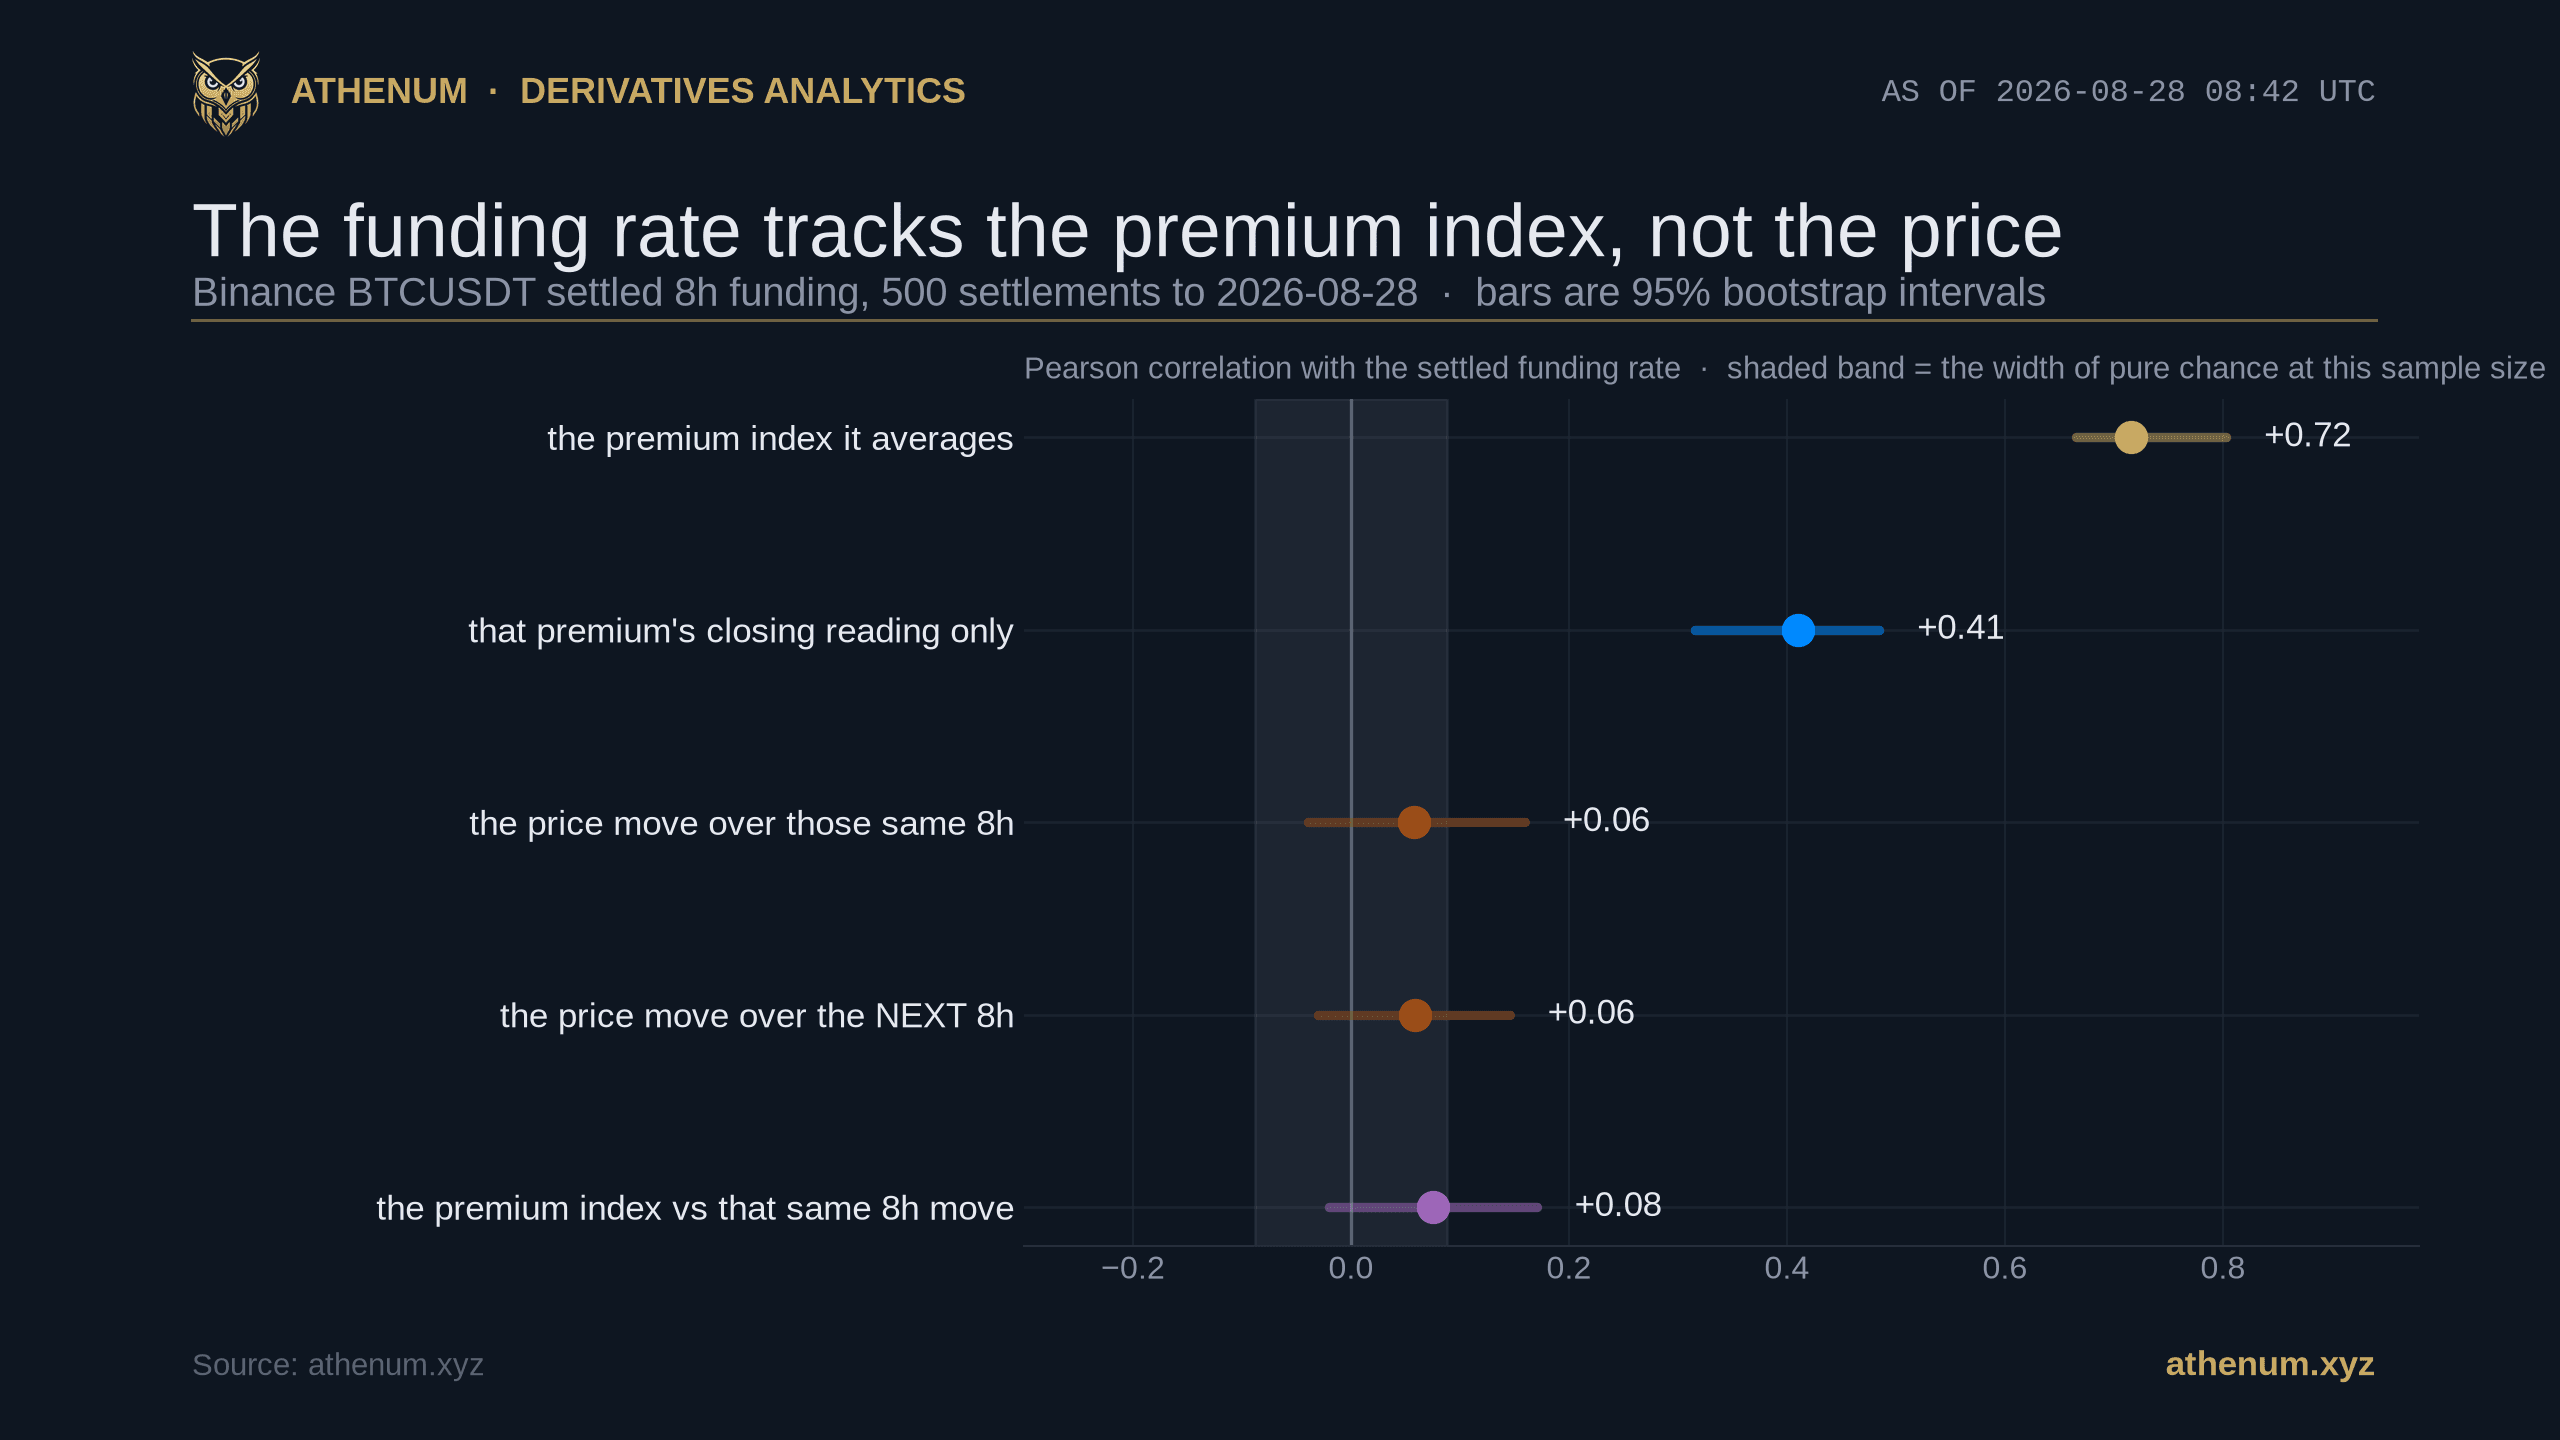
TLDR. The Bitcoin funding rate is the fee perpetual longs and shorts exchange every eight hours, and almost every description of it, ours included, says it measures crowding or conviction and then invites you to read that forward as a statement about price. This post tests only that second step. Measured on 2026-08-28 over 500 Binance BTCUSDT settlements back to 2026-03-15, the settled rate correlates +0.72 (95 percent interval +0.67 to +0.80) with the premium index it is built from. On the 492 of those settlements that have a full forward window, it correlates +0.06 (interval -0.04 to +0.16, so indistinguishable from zero) with the price move over the very eight hours it prices. Looking forward is the same answer: on Binance, OKX and Bybit, 2,760 settlements in all, at horizons of 8, 24 and 72 hours, we ran 18 forward tests and none came in below p = 0.05, the smallest p among those 18 being 0.21. Funding is a good instrument pointed at the premium index. Over these windows it is not pointed at price.
What does the Bitcoin funding rate actually measure?
The premium of the perpetual over its own index, averaged over the interval, and that is not a figure of speech. As their pages read on 2026-08-28, Binance, OKX, Bybit and Bitget each define the funding rate as an average premium index plus a clamped interest term, though the outer form differs and they are not interchangeable: three of the four divide the whole bracket by 8 over the funding interval, while Bybit instead scales the interest input by the interval.
On Binance, the venue measured here, the premium index is worth stating precisely because the loose version is wrong. Binance samples it every five seconds from the IMPACT BID and ASK prices, which are the average fill prices for a fixed notional walked into the order book, against the index price. It is not built from where the perpetual last traded, and when the index price sits between the impact bid and the impact ask the premium index is exactly zero no matter what the last trade did. The rate then uses the average of those samples, weighted linearly toward settlement rather than equally. So the quantity funding is defined on is a level, a gap between prices at each instant, and not a change. Binance also publishes the band: while the premium index sits between -0.04 and +0.06 percent, the funding rate equals the 0.01 percent interest rate exactly.
We have shown that link before, and more exactly than a correlation can. In the Athenum study of the Bitcoin perpetual's discount to spot we pushed the measured premium through the published formula and landed within 0.0011 percentage points of the rate two venues actually settled. That post also warns, in its own words, that "funding is not a measurement of the premium. It is a formula applied to the premium, and the formula has a subsidy built into it." Both things are true, and the correlation below is not trying to improve on the reconstruction. It exists for one reason: a formula reconstruction cannot be compared against a price return, and a correlation can. Putting both questions on the same scale is the only way to see how far apart the answers are.

The same 500 settled Binance funding rates, plotted against the premium they average (r = +0.716) and against the next eight hours of price (r = +0.059).
For each of the 500 settlements from 2026-03-15 to 2026-08-28 we averaged the eight one hour premium bars inside the interval the rate priced, and correlated that average against the rate that settled at the end of it. The answer is +0.7156, with a 95 percent interval of +0.665 to +0.803 and a permutation p below 0.0001. A straight line through those points explains 51 percent of the variance in the settled rate. Use only the premium's closing reading instead of the eight hour average and the correlation falls to +0.4096, interval +0.316 to +0.484.
The right hand panel above is the forward question, and it belongs to the next section. It is drawn on all 500 settlements and reads +0.059; the next section uses the 492 that also have a full 72 hour window ahead of them and reads +0.055 for the same quantity. The difference between those two numbers is eight rows, not a disagreement.
Now the honest part, because +0.72 is not as impressive as it looks and we would rather say so than let a reader over-read it. Funding is by construction a clamped function of the venue's own premium average, so the true relationship is close to one; what +0.72 actually measures is how much of that our proxy recovers, and the fitted slope of 0.40 says the proxy is lossy. It is lossy in two ways, and only one of them is sampling: our eight hourly bars are coarser than the venue's five second grid, and we weight them equally where the venue weights them linearly toward settlement. A sampling gap tends to push a correlation toward zero. A weighting mismatch is systematic and we cannot sign it, so we do not claim the true number is higher, only that it is not this one. Run the obvious placebo and it gets narrower still: correlate each settled rate against the premium average of the PREVIOUS interval, a window it was not built from, and you still get +0.57, and against the NEXT interval +0.59. Both series drift slowly, so most of the raw number is shared persistence rather than the specific link. Strip the drift by first differencing both series and the correct interval holds at +0.47 while the previous interval collapses to -0.14 and the next to -0.05, which is the version of this result worth carrying. The link is real and it is interval specific. It is also measured through an instrument we built, which is why the comparison in the next two sections is the point: the very same proxy, on the very same rows, reaches +0.06 against price.
One more caveat, pointing the other way from the placebo. Inside that -0.04 to +0.06 percent band the settled rate stops carrying any information about the premium at all, which pinned 38 of these 500 Binance settlements, 7.6 percent, to exactly 0.010000 percent, and that flattening subtracts from the correlation rather than adding to it. Our own measured average premium of -0.0458 percent sits just outside the band, which is why the pinning is 7.6 percent of settlements and not most of them. The funding-to-premium join is sound. That is narrower than it sounds, and worth saying plainly: the next two sections join funding to price, which is a different series on a different bar grid, and nothing above tests that join. What protects it is the stamp snapping and the same-board rule set out at the end of this post.
One number in the chart above deserves a note before it is misread. The premium index on Binance BTCUSDT averaged -0.0458 percent over this window and was negative in 99.3 percent of the 4,000 hourly bars inside those intervals, which means the perpetual traded persistently below its own index while funding stayed positive. Funding correlates at +0.72 with a quantity that sat on the other side of zero for essentially the whole window, because the correlation is about the two moving together, not about their levels. That is the clamp doing its job, and it is the subject of the discount study linked above.
Does a high Bitcoin funding rate predict the next eight hours?
No, and not at 24 or 72 hours either. We ran the forward test three ways on each of Binance, OKX and Bybit, always keeping funding and price on the same board so the two sides are the same instrument: Binance BTCUSDT USD-M with 492 settlements from 2026-03-15, OKX BTC-USDT-SWAP with 277 from 2026-05-25, which is the documented floor rather than a surprise (OKX's own reference says of that endpoint "This endpoint can return data up to three months"), and Bybit BTCUSDT linear with 1,991 settlements reaching back to 2024-10-31. All three windows end on 2026-08-25, because the most recent settlements have no full 72 hour window ahead of them yet.

Nine forward tests across Binance, OKX and Bybit at three horizons: every point estimate sits between -0.051 and +0.076 and every 95 percent interval contains zero.
Every one of the nine point estimates falls between -0.051 and +0.076, and every one of the nine 95 percent bootstrap intervals contains zero. Add nine permutation tests on the gap in mean next move between the top and the bottom funding group and there are 18 forward tests in total. None of them comes in below p = 0.05, and the smallest p among the 18 is 0.21.
That absence is worth stating carefully, because an absence only means something once you know what chance predicts. At 18 tests, chance alone would be expected to produce about 0.9 hits at the 5 percent level, and that expectation holds whether or not the tests are related to each other. These tests are heavily related: the nine permutation tests run on the same nine board and horizon pairs as the nine correlations, the 24 and 72 hour windows each contain the 8 hour one, and all three boards price the same asset over overlapping windows. So the honest statement is that zero hits out of eighteen overlapping tests is exactly the shape of a null, and that we cannot attach a probability to the zero.
The decile split is the version of this test a trader would actually recognise, because nobody trades a correlation. Take every settlement at or above the ninetieth percentile of funding on each board, and every settlement at or below the tenth, and look at what the next eight hours did.

Next 8 hour price move grouped by the funding print: on Binance the top group median is +0.04 percent against +0.04 percent for all settlements, and the boxes are wider rather than higher.
Group by value, not by rank. That sounds like pedantry and it is the opposite: on OKX all 34 settlements at or above the cut print the identical 0.010000 percent, so a rank based top decile of 28 would decide six of its own members by sort order, and the group's median next eight hours ranges from -0.230 to +0.203 percent depending on which six the sort happens to drop, a swing that crosses zero. On Bybit the cut is also 0.010000 percent, 479 settlements sit at or above it and 404 of those are exactly at it, so a top 199 silently discards 280 rows that qualify. Only Binance has a clean cut. Grouping by value removes the lottery, and it is why the numbers below are not the ones a naive decile would print.
On Binance the cut is a funding print of +0.008943 percent or higher, 49 settlements. Their median next eight hours is +0.039 percent against +0.040 percent for all 492, a gap of under two thousandths of a percentage point that carries no direction worth reading. What does differ is the spread: their interquartile range runs from -0.836 to +0.730 percent against -0.538 to +0.608 percent for the full set, wider rather than higher. On OKX the 34 settlements at or above +0.010000 percent have a median of +0.028 percent against +0.036 percent for all 277, which puts the extreme group below the full sample rather than above it. On Bybit the 479 at or above +0.010000 percent have a median of +0.064 percent against +0.030 percent.
The low group is the half of this test that matters most for the older Athenum posts discussed further down, so here it is on its own terms. On Binance the 49 settlements at or below -0.004510 percent were followed by a median eight hours of -0.041 percent and were positive 24 of 49 times, 49.0 percent. On OKX the 28 at or below -0.001883 percent have a median of -0.001 percent, positive 14 of 28, exactly half. On Bybit the 199 at or below -0.002638 percent have a median of -0.015 percent, positive 98 of 199, 49.2 percent. Every one of those three is a coin flip inside its own interval.
Read only the medians and there is half a story there, and it does not survive the spread. The share of top group settlements followed by a positive eight hours is 53.1 percent on Binance, and a 95 percent interval on that share runs from 39.4 to 66.3 percent, which comfortably contains the 52.2 percent that all Binance settlements produce and comfortably contains a coin flip. On OKX it is exactly 50.0 percent, interval 34.1 to 65.9 percent, against a full sample of 53.1 percent. On Bybit, where the group holds 479 observations rather than 34, the interval narrows to 49.0 to 57.9 percent around a share of 53.4 percent, and the full sample sits at 51.3 percent, inside it. The larger sample does not sharpen a signal. It sharpens a zero.
Board | Settlements | Window | vs the same 8h move | vs next 8h | vs next 24h | vs next 72h |
|---|---|---|---|---|---|---|
Binance BTCUSDT USD-M | 492 | 2026-03-15 to 2026-08-25 | +0.061 | +0.055 | +0.020 | -0.051 |
OKX BTC-USDT-SWAP | 277 | 2026-05-25 to 2026-08-25 | -0.098 | -0.009 | +0.000 | +0.076 |
Bybit BTCUSDT linear | 1,991 | 2024-10-31 to 2026-08-25 | +0.180 | -0.015 | +0.006 | -0.001 |
Only the Bybit figure in the first numeric column has a 95 percent interval that excludes zero. Every figure in the other three columns has an interval that contains it.
Does funding at least describe the move it just priced?
Barely, and on two of the three the answer cannot be told apart from zero. Over the same interval the rate prices, the correlation between the settled funding rate and the price move is +0.061 on Binance (interval -0.042 to +0.158), -0.098 on OKX (interval -0.249 to +0.035) and +0.180 on Bybit (interval +0.123 to +0.236). Only the Bybit figure is distinguishable from zero, and it is small: the strongest of the three explains about 3 percent of the variance in the eight hour return.
Resist the obvious reading of that spread. Binance overlaps both of the others, but the OKX and Bybit intervals do not overlap each other at all, and the tempting conclusion is that the venues genuinely differ. They may. These three numbers cannot show it, because Bybit's is measured over twenty two months back to 2024-10-31 and OKX's over three months from 2026-05-25, so the comparison is between eras at least as much as between venues. What is safe to say is the common part: on none of the three does the settled rate carry much information about the price path in the window it measures.
That result has a mechanical explanation, and it is the same distinction the first section made. We correlated the premium index itself, not the funding rate, against the price move over the same eight hours on Binance: +0.075, with a 95 percent interval of -0.021 to +0.170 and a permutation p of 0.09. So the weak link is not something funding does to the premium. The premium and the return are close to unrelated to begin with, because one is a level and the other is a change, and a market can rally all day with the perpetual sitting flat against its index.
This is the sentence to take away. Funding is not a broken measure of price. It is an accurate measure of something that is not price.
The 2026-08-28 Bitcoin funding print is the highest on the board. What does that predict?
Nothing, and this is the cleanest demonstration in the post because it uses the number a reader would have seen on a screen on the morning of publication. The Binance BTCUSDT settlement at 2026-08-28 08:00 UTC printed exactly 0.010000 percent. Of the last 500 settlements, 92.4 percent are strictly below that, so on a naive reading the rate is at its maximum. It is at the maximum because 38 of those 500 tie at exactly that value: 0.010000 percent per eight hours is the fixed interest term showing through when a venue's own premium is small, which we measured across venues in negative funding rates by exchange. It is a floor of the formula wearing the costume of a market extreme.
Athenum's own cross-venue Bitcoin perpetual feed carries the Binance leg hour by hour, and for the hour ending 2026-08-28 08:00 UTC it reads 0.010000 percent, the same figure Binance's own funding history returns for that settlement. That agreement is not decoration: it is the check that the series tested here is the one the venue actually settled rather than the running estimate a ticker shows.

The 36 Binance settlements that printed exactly 0.010000 percent were followed by an up move 18 times and a down move 18 times, against 52.2 percent up across all 492.
So what happened after the other times the board printed this exact number? Of the 36 such settlements with a full forward window, 18 were followed by an up move over the next eight hours and 18 by a down move, a 50.0 percent share with a 95 percent interval of 34.5 to 65.5 percent against 52.2 percent across all 492. Their median next eight hours is -0.011 percent against +0.040 percent for the full set, and the difference in mean move is -0.0553 percentage points at a permutation p of 0.77.
The exact 18 against 18 is a coincidence and should not be read as significant in itself; with 36 draws at roughly even odds, a split this close is among the most likely outcomes rather than a remarkable one. The interval is the finding, and it is wide enough to contain everything from a losing coin to a decent one. This permutation test is a nineteenth alongside the eighteen counted earlier, which moves the number of hits chance would predict from about 0.9 to about 0.95 and leaves the count of hits at zero.
We have said this four times without measuring it. Two Athenum posts said the opposite.
The claim that funding does not forecast direction is already house doctrine here, asserted and never tested. The explainer on how funding is calculated states flatly: "Funding does not predict direction." The OI-weighted funding post says weighting "does not turn funding into a timing signal" and that "It tells you how the market is positioned, not when that positioning will reverse." The FOMC post says "The takeaway is not that a stretched funding rate predicts direction." The discount study says "A perpetual trading below spot does not predict the next move, and a positive funding rate does not either." Four posts, four assertions, and until today not one measurement behind them. That is the gap this post closes, and stating it is the honest way to publish a result we have been assuming.
Two older Athenum posts go the other way, and it would be dishonest to publish this measurement without naming them. The March 2026 funding rate collapse post, dated 2026-03-29, describes a setup in which "Binance funding turns deeply negative while Hyperliquid remains at or near its positive cap" and says of that split: "Historically, this divergence resolves violently." The sentence that follows it does not soften that, it sharpens it: "Either the longs capitulate and funding converges negative across venues, or the shorts on Binance get squeezed and both venues reset to neutral." The same post does hedge its other forward claim, prefacing a February precedent with "The divergence does not guarantee a squeeze, but it does indicate that leveraged futures participants, not longer-duration capital, are driving the negative funding rate." The April 2026 funding divergence post, dated 2026-04-19, promised to explain "what historical precedent suggests about how this resolves" and ran a section headed "Historical Context: What Happens After Extreme Negative Funding".
Now the limits, four of them, and a reader deserves them before the verdict. First, both of those posts are about extreme NEGATIVE funding, so the low group numbers above are the relevant half, not the top: on Binance the 49 settlements at or below -0.004510 percent were followed by an up move 24 of 49 times and a median of -0.041 percent, which is a coin flip. Second, the March claim is about a GAP between Binance and Hyperliquid, and Hyperliquid is not one of the boards tested here, so this test constrains the general reading of an extreme print rather than that specific cross-venue setup. Third, the February precedent is a joint claim, negative funding together with persistent ETF inflows, and a test conditioned on funding alone cannot refute a pair. Fourth, 72 hours is the longest horizon here, so a claim about a multi-week regime is outside what these settlements can reach.
What this test does constrain is the weaker, sign-neutral reading a trader takes off a funding screen: that an extreme print on its own tilts the next eight to seventy two hours. It does not. An extreme print does mark where one side is paying to hold a position, and that remains a real fact about the present. The step that does not survive is the one after it, which turns a description into an expectation.
How can you check this yourself?
Every number above comes from a public endpoint that needs no key and no account, and the method is four steps that each remove one way of getting it wrong.
Pull the settled rates, not the ticker. A venue's ticker shows a running estimate of the coming settlement, not the rate that last settled, and we measured how far that estimate travels before the stamp in what the funding rate does before settlement. Whether the venue warns you about that varies: as their reference pages read on 2026-08-28, OKX calls its field a predicted rate and points at a separate settled field, Bybit says its rate fluctuates in real time until the funding timestamp, and Binance's description of lastFundingRate reads in full "This is the Latest funding rate". Take the funding history endpoint instead. Binance stamps 248 of these 500 settlements between one and twenty six milliseconds past the hour, so snap each stamp to the nearest eight hour boundary rather than testing it for equality; requiring exact equality would silently discard those 248 rows.
Take the price from the same board as the funding. Bybit runs at least three Bitcoin perpetual boards, the USDT-settled linear BTCUSDT, the coin-settled inverse BTCUSD and the USDC-settled BTCPERP, and their funding is not the same number: at the 2026-08-28 00:00 UTC settlement the linear board settled at +0.002538 percent while the inverse board settled at -0.004754 percent, opposite signs on the same asset at the same venue at the same second. A venue is not a board. Line the price windows up with the accrual window, so that the backward return covers exactly the interval the rate priced and the forward return covers exactly the next one, and take each return from the open of its first bar to the close of its last, so that no price sits on both sides of the comparison.
Put an interval on every correlation before you read it. A correlation on 277 observations has a standard error near 0.06 all by itself, so anything under about 0.12 is inside the noise before the market says a word. We report the outer envelope of two 95 percent bootstrap intervals, one resampling settlements independently and one resampling in blocks of nine consecutive settlements, because funding is serially correlated and independent resampling alone would understate the interval.
And compute what chance predicts before you call an absence a finding. Eighteen tests at the 5 percent level should hand you about 0.9 false positives, whether or not they are independent; getting zero is not evidence of anything unusual, it is the expected shape of a null, and because these eighteen overlap heavily no probability can be attached to the zero. If you want to run the carry side of this arithmetic yourself, the free funding rate calculator turns a per interval rate into an annual rate and a dollar schedule, and the APR to APY calculator separates out how much of any annualised figure is the compounding assumption rather than the rate.
What this post does not claim is as important as what it does. It does not say funding is useless: a rate of 0.0100 percent per eight hours, charged at three settlements a day, is a real cost of about 11 percent a year to a long, or 11.6 percent if you compound it, and cost is worth knowing whether or not it forecasts. It does not measure crowding or positioning, which is the thing funding is usually said to describe; it substitutes price for that, deliberately, because price is the thing readers actually act on. It does not test funding jointly with anything else, and a conditional signal that needs open interest, spot flows or a volatility regime beside it is untested here rather than refuted.
Two limits are sharp enough that a reader should hold the conclusion inside them, and we would rather name them than have someone else do it. The first is the REGIME. The Binance and OKX windows sit entirely inside a stretch in which the perpetual traded below its own index in 99.3 percent of the 4,000 hourly bars we measured, which is one funding regime and not a sample of many; the twenty two month Bybit window spans several, and it is the only window in the study that produced an interval excluding zero. We discounted that one as an era comparison in the section above, and the same scepticism has to run the other way: two short single regime nulls are weaker evidence for a general claim than one long sample is for a specific one. The second is the SMALLEST THING THIS COULD SEE. With 277 observations a correlation below about 0.12 is invisible here whatever the market is doing, so a small, persistent, high turnover edge would sit inside the blind spot rather than be refuted by these tests. What is measured is the absence of a LARGE effect over these windows, which is exactly the effect a screen reading trader thinks they are acting on, and not the absence of any effect at all.
Every figure above was read on 2026-08-28 against the public endpoints of Binance, OKX and Bybit and against Athenum's own cross-venue feed. The 34 calculators on the site are free to use: no account, no email address, no usage limits. The terminal opens on a free 7 day Pro+ trial.
One terminal. All the data.
Liquidations, orderbook depth, whale walls & open interest from 4 exchanges, all real-time, in one place.
No credit card required

Athenum Analytics
Athenum Analytics is our three-person editorial team covering crypto derivatives, market data and macroeconomic context.