Table of Contents8 sections
- Bitcoin Futures Roll: the Next Quarter Fills Before the Front One Drains
- What is the roll in Bitcoin futures, and when does it happen?
- Does the front quarterly contract drain as expiry approaches?
- How much of a venue's Bitcoin book is dated at all?
- Is the December contract really far dated and thin?
- What does it cost to roll from September to December?
- How big is the perpetual side that absorbed the roll?
- How can you check this yourself?
Bitcoin Futures Roll: the Next Quarter Fills Before the Front One Drains
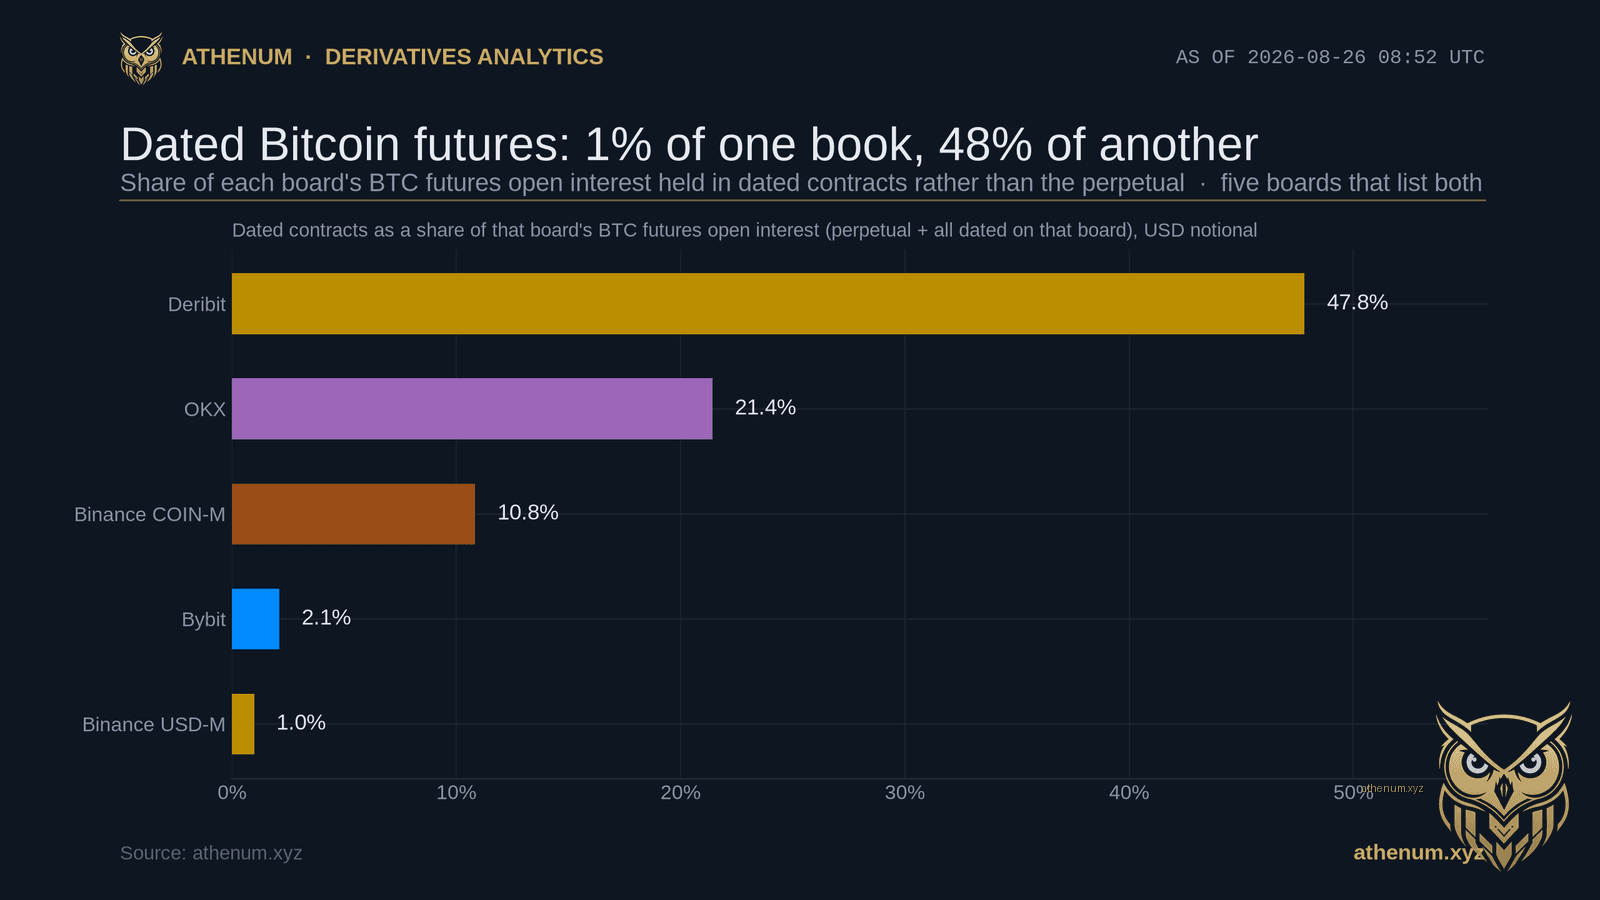
TLDR. The Bitcoin futures roll is the moment traders move exposure out of an expiring contract and into the next one, and it does not look like the handover most people picture. Measured on 2026-08-26 at 08:52 UTC, about 30 days before the 2026-09-25 quarterly expiry, the December contract already held between 0.54 and 0.68 of September's open interest, median 0.61 across five boards. Only one of those boards publishes the daily history that shows the path rather than the level: over the 30 snapshots to 2026-08-26, Binance COIN-M September open interest went from $78.32M to $87.52M and December from $17.07M to $45.50M. Weighed against each series' own daily noise, September's rise is inside the band a driftless series would produce and December's is outside it, so the defensible claim is that the front contract did not drain while the next one filled. How much of this you can see at all depends on the board: counting every dated contract a board lists, dated exposure is 1.0 percent of the Bitcoin futures book on Binance USD-M and 47.8 percent on Deribit.
What is the roll in Bitcoin futures, and when does it happen?
A dated futures contract has a fixed expiry, so anyone who wants to keep the exposure past that date has to close the expiring contract and open the next one. That pair of trades is the roll, and on traditional venues it produces a recognisable pattern: open interest drains out of the front contract over the last week or two and appears in the next one, with the crossover treated as the moment the market's centre of gravity moves.
Bitcoin has the same contract structure and does not produce the same pattern, for one structural reason: the perpetual swap has no expiry, so the exposure that would otherwise be rolled never has to move at all. That much we have written before, in the Athenum explainer on perpetual swaps versus dated futures. That piece also says something this measurement contradicts, and the rest of this post is mostly about that.
Here is the sentence in question: "The front-month or current-quarter contract is usually liquid; far-dated contracts thin out quickly." Only Deribit, among the five boards in the table, lists dates beyond December, and on Deribit that sentence is false of the first far date and true of the two beyond it. September 2026 holds $380.37M of open interest and December 2026 holds $233.62M, a step down of 39 percent. The next two dates then fall off a cliff: March 2027 holds $59.49M and June 2027 holds $12.13M, each roughly a quarter to a fifth of the date before it. So on this board the older sentence is right about the tail and wrong about the first step, and the curve is one moderate step followed by a cliff rather than a smooth decay. It is worth saying that Deribit is not the only far ladder in Bitcoin and the others do not all agree: Bybit's linear board, described below, runs out to June 2027 and in the same 09:16 UTC read its June rung, $7.08M, is larger than its March rung, $5.19M, so the cliff is a Deribit shape rather than a market law.
Does the front quarterly contract drain as expiry approaches?
No, at least not 30 days out, and this is the part a snapshot cannot answer. Binance COIN-M publishes daily open interest per contract slot, which lets the two quarterly contracts be tracked separately over the 30 snapshots ending 2026-08-26. They are 00:00 UTC point readings spanning 30 days, and Binance's series carries no row for 2026-07-30, so one of the 29 steps covers two days rather than one.

Binance COIN-M BTCUSD open interest, 30 snapshots to 2026-08-26: September +11.7 percent is inside its own noise band, December +166.5 percent is outside it.
Over that window the September contract went from $78.32M to $87.52M and the December contract from $17.07M to $45.50M. Both rose. The perpetual on the same venue went from $1,170.34M to $1,236.97M, up 5.7 percent.
The percentages alone would overstate this badly, so here is the dispersion behind them. September's daily changes have a sample standard deviation of $1.82M, so across 29 steps a series with no drift at all would wander about $9.79M from its own noise. September's net move was $9.20M, which is 0.94 of that band. December's daily changes have almost the same standard deviation, $1.82M, and its net move was $28.43M, or 2.90 of the band.
Those bands are still too generous, because they assume each day is independent and these days are not. The lag-1 autocorrelation of the daily changes is +0.22 for September and +0.36 for December, and positive serial correlation widens the band a random walk would produce. Correcting for it gives $12.14M for September and $14.09M for December, which moves September to 0.76 of its band and December to 2.02 of its own. So the result is directional rather than dramatic: on either treatment September's rise is inside the range its own noise produces, and December's is outside it.
Two more things the endpoints hide. Seventy-four percent of September's net move is a single day, 2026-08-22, worth $6.84M; strip that one day out and the remaining 28 steps add $2.36M. And the series did not rise monotonically: it fell to $69.59M on 2026-08-02, 11.1 percent below where it started. The honest reading is therefore much narrower than "the front contract grew". It is that the front contract did not drain on net, and that the test is not powerful enough to say much more: a 95 percent interval on the underlying drift runs from minus $15.67M to plus $34.07M, so this window can neither rule out a further large build nor rule out a $15M drain, which is the post's own thesis running against itself. The next contract, by contrast, filled by an amount larger than its own noise on either band. The ratio between them went from 0.218 to 0.520 in 30 days, and the dated share of that venue's Bitcoin futures book went from 7.54 percent to 9.71 percent. Both figures are on the 00:00 UTC snapshot basis this series uses; the same venue reads 0.54 and 10.84 percent in the 08:52 UTC capture below, and the gap between the two is one morning of trading, not a disagreement.
Rolling is usually described as a transfer out of one contract and into the next. On this board, over this window, nothing left the front contract on net, though the path was not flat while it happened.
How much of a venue's Bitcoin book is dated at all?
Almost none of it on most venues, and the venues differ from one another by a factor of about 49. Measured at 08:52 UTC on 2026-08-26 from each venue's own public endpoint:
Board | Perpetual open interest | September 2026 | December 2026 | Perpetual divided by September |
|---|---|---|---|---|
Binance USD-M | $8,346.94M | $49.43M | $33.51M | 168.9x |
Binance COIN-M | $1,044.42M | $82.67M | $44.27M | 12.6x |
Deribit | $907.73M | $380.37M | $233.62M | 2.4x |
Bybit inverse | $490.03M | $6.69M | $3.86M | 73.3x |
OKX inverse | $468.83M | $55.02M | $35.85M | 8.5x |

Bitcoin open interest by contract, 2026-08-26 08:52 UTC: even Deribit, the most dated-heavy board at 2.4x, is majority perpetual.
Counting only the two quarterly contracts, dated exposure is 0.98 percent of the Bitcoin futures book on Binance USD-M, 2.11 percent on Bybit inverse, 10.84 percent on Binance COIN-M, 16.23 percent on OKX inverse and 40.35 percent on Deribit. Counting every dated contract on that same board, including Deribit's and OKX's weeklies and monthlies, Deribit reaches 47.82 percent and OKX inverse 21.42 percent, while the other three are unchanged because those boards carry no further dated Bitcoin contracts. The cover chart at the top of this post plots the second, all dated reading; the quarterly only figures come from the table above, and they are the like for like ones because every board lists those two contracts.
Board, not venue, is the unit here, and the distinction is load bearing rather than pedantic. Several of these venues run more than one Bitcoin futures board and the boards do not resemble each other. Bybit's inverse board in the table holds $490.03M in its perpetual; the linear BTCUSDT board it runs alongside held $3,749.98M when we read it at 09:16 UTC, with its own dated ladder of eight contracts worth $120.06M in total, of which September is $30.50M and December $19.34M. That board is not in this table, and its December over September ratio is 0.634, which lands inside the cluster below rather than disturbing it. Read a row as a statement about one board and it holds; read it as a statement about the whole venue and it does not.
One thing this ratio is safe from is worth stating, because we have published the trap twice. A venue's open interest number carries conventions: some venues count both sides of a position, which we measured in open interest, one side or both, and coin denominated and dollar denominated figures move differently, which we covered in open interest in coins versus dollars. Neither affects the numbers in this table, because each ratio divides two contracts from the same venue reported through the same endpoint under the same convention, so any uniform factor cancels. That is why the comparison here is always within a venue, and why the cross venue column is a share rather than a sum.
Is the December contract really far dated and thin?
Not at 30 days from the September expiry. Dividing December open interest by September open interest at the same venue and the same instant gives a tight cluster.

December over September Bitcoin open interest on 2026-08-26: 0.54 to 0.68 across five boards, median 0.61, n = 5.
Binance COIN-M reads 0.54, Bybit inverse 0.58, Deribit 0.61, OKX inverse 0.65 and Binance USD-M 0.68. The median is 0.61 and the full range across the five is 0.14 wide. Five boards with different contract sizes, different settlement currencies and different clienteles landing this close together is why the cluster is worth more than any single reading in it. The sample is five, which is small enough that the honest quantity is the range, 0.54 to 0.68, and the median is a convenience.
What the cluster does not tell you is whether 0.61 is normal for this point in the cycle, because one expiry is one observation. The Binance COIN-M history above is the only part of this post that speaks to the path rather than the level, and it covers a single roll cycle.
What does it cost to roll from September to December?
The price of the roll is the spread between the two contracts, and the five boards agree on it far more closely than they agree on anything derived from it. Measured in a single 2.6 second pass at 2026-08-26 09:17:02 UTC, moving from September to December cost +1.169 percent on OKX inverse, +1.169 percent on Binance USD-M, +1.174 percent on Bybit inverse, +1.177 percent on Binance COIN-M and +1.249 percent on Deribit: a spread of 0.080 percentage points across the whole set, over the 91 days between the two expiries.
Annualise a different quantity and the numbers spread out. The figure above is September against December over 91 days; what follows is each September contract against its own board's index, over the 29.95 days to expiry. In the same 09:17:02 UTC pass, that basis annualises to +3.78 percent on Deribit, +4.21 percent on Binance USD-M, +4.29 percent on Bybit inverse, +4.49 percent on OKX inverse and +4.96 percent on Binance COIN-M, a spread of 1.18 points, while the five index prices themselves sit within $14.53 of each other.
The reason to insist on one pass is that we got this wrong first. An earlier capture read the marks and the index prices about three minutes apart, and that alone produced an apparent spread of 2.36 points and made two boards look like carry outliers they are not. At 30 days the annualisation factor is 365 divided by 29.95, which is 12.19, so every dollar of stale index is worth more than twelve dollars of annualised basis. That is the same amplifier we measured directly in the Bitcoin futures basis term structure, pointed at our own capture rather than at the market. Quote the raw spread when the horizon is short, treat the annualised version as a derived figure with a large multiplier attached, and read both legs at the same instant. If you want to run the perpetual side of the same comparison, the free funding rate calculator turns a per interval funding rate into an annual cost, and the APR to APY calculator shows how much of any annualised figure is the compounding assumption rather than the rate itself.
How big is the perpetual side that absorbed the roll?
Large enough that the entire quarterly complex is a rounding error against it. For the hour ending 2026-08-26 at 07:00 UTC, Athenum's cross venue feed recorded Bitcoin perpetual open interest of $8.37B on Binance, $3.74B on Bybit, $2.86B on Hyperliquid, $2.75B on Bitget, $2.31B on OKX and $0.91B on Deribit. Note which boards those are: the Bybit and OKX legs here are the linear USDT boards, four and five times the size of the inverse boards that carry the dated contracts in the table above, which is the sharpest illustration in this post of why board and venue are not the same word.

Athenum's six perpetual legs against each venue's own endpoint on 2026-08-26: every leg agrees within 1.33 percent, largest on Hyperliquid and smallest on Bitget.
Every one of those six legs was re-read directly at the venue's own public endpoint at 08:56 UTC the same morning and reproduced within 1.33 percent, the largest gap being Hyperliquid and the smallest Bitget at 0.09 percent. The two reads are under two hours apart, and all six gaps happen to point the same way, which is more than elapsed time alone would explain, so treat 1.33 percent as the size of the agreement and not as a drift measurement. Deribit is the cleanest check available here, because it is the one venue where the same quantity appears in both halves of this post: our feed put its perpetual at $909.42M and Deribit's own endpoint put it at $907.73M, 0.19 percent apart.
Those six legs sum to $20.95B as the venues publish them. The feed's own total for that hour reads $21.10B, which is $152M more than the six named legs add up to, so the named breakdown is not the whole of it and we are quoting the part we checked. Bybit's leg follows its own venue default field, which counts both sides of a position, so a strictly single sided six venue total is $19.08B. Read that total against the quarterly complex carefully, because the two do not cover the same boards: our feed counts Binance once, reads Bybit and OKX on their linear boards rather than the inverse ones in the table, and adds Hyperliquid, which lists no dated Bitcoin contracts at all. The clean like for like comparison is the one inside the table above, where the $925.28M held in the September and December contracts is 8.2 percent of the $11.26B of perpetual open interest on those same five boards. Both sides of that ratio use each board's own published field, so Bybit's double sided convention sits in the numerator and the denominator alike and its small legs move the answer by less than a tenth of a point. Either way, the contract that never has to be rolled is an order of magnitude larger than the ones that do.
How can you check this yourself?
Every figure above comes from a public endpoint that needs no key and no account, and the method is four steps.
1. Pull each venue's open interest per instrument, not per pair, so the perpetual and the dated contracts stay separate. The instrument name carries the expiry on all five venues, in one of two shapes: a date, as in Deribit's BTC-25SEP26 and Binance's BTCUSD_260925, or a futures month code, as in Bybit's BTCUSDU26 for September and BTCUSDZ26 for December. 2. Convert everything to one unit before comparing anything. Binance COIN-M and OKX's inverse BTC-USD series quote Bitcoin contracts in $100 units, Bybit's inverse contracts in $1 units, Deribit reports open interest already in dollars, and Binance USD-M reports it in BTC, so that one has to be multiplied by a price before it can join the others. The unit is a property of the series and not of the venue: OKX's own BTC-USD_UM dated series sits in the same endpoint response at 0.01 BTC per contract, so applying the $100 figure to it overstates it by more than a hundredfold. Skipping this step is the single most common way a cross venue futures table ends up wrong. 3. Compare within a venue, not across. Divide December by September on the same venue, then compare those ratios. Anything a venue does uniformly to both legs cancels in the ratio and does not cancel in a sum. 4. Take the daily history before drawing a trend. Binance COIN-M publishes open interest per contract slot as a 00:00 UTC point snapshot, which is what the 30 day panel above uses; it is a snapshot rather than a daily average, so intraday moves are invisible to it, and today's 00:00 UTC reading of $87.52M for September sat at $82.67M by 08:52 UTC.
The result behind all of this is one claim with a date attached: on 2026-08-26, one month before a quarterly expiry, the far contract was not yet thin on any of the five boards, and on the one board that publishes a daily history the Bitcoin futures roll had moved nothing out of the front contract on net. Re-run it a week before expiry and you may well get a different answer, which is the point of writing down the date.
The data behind this post is Athenum's live cross venue view of Binance, Bybit, OKX, Bitget, Deribit and Hyperliquid, checked here leg by leg against each venue's own endpoint, and the 34 calculators alongside it are free, ask for no account and no email address, and carry no usage limits. The terminal itself opens on a free 7 day Pro+ trial.
One terminal. All the data.
Liquidations, orderbook depth, whale walls & open interest from 4 exchanges, all real-time, in one place.
No credit card required

Athenum Analytics
Athenum Analytics is our three-person editorial team covering crypto derivatives, market data and macroeconomic context.