Table of Contents7 sections
- Which UTC hours moved Bitcoin most in the last 30 days?
- Does the same pattern hold over 200 days?
- How much of the hour-of-day pattern is noise?
- Do two honest measurements of the same month even agree?
- What actually creates real time-of-day structure in crypto?
- Do the APAC, EU and US sessions behave differently?
- How do you read an hour-of-day chart without fooling yourself?
Practise with worked lessons
- Choose timeframes and session context without moving the goalposts
Give context, setup and execution timeframes separate roles before entry. Align UTC timestamps, daylight-saving changes, funding events and incomplete candles.
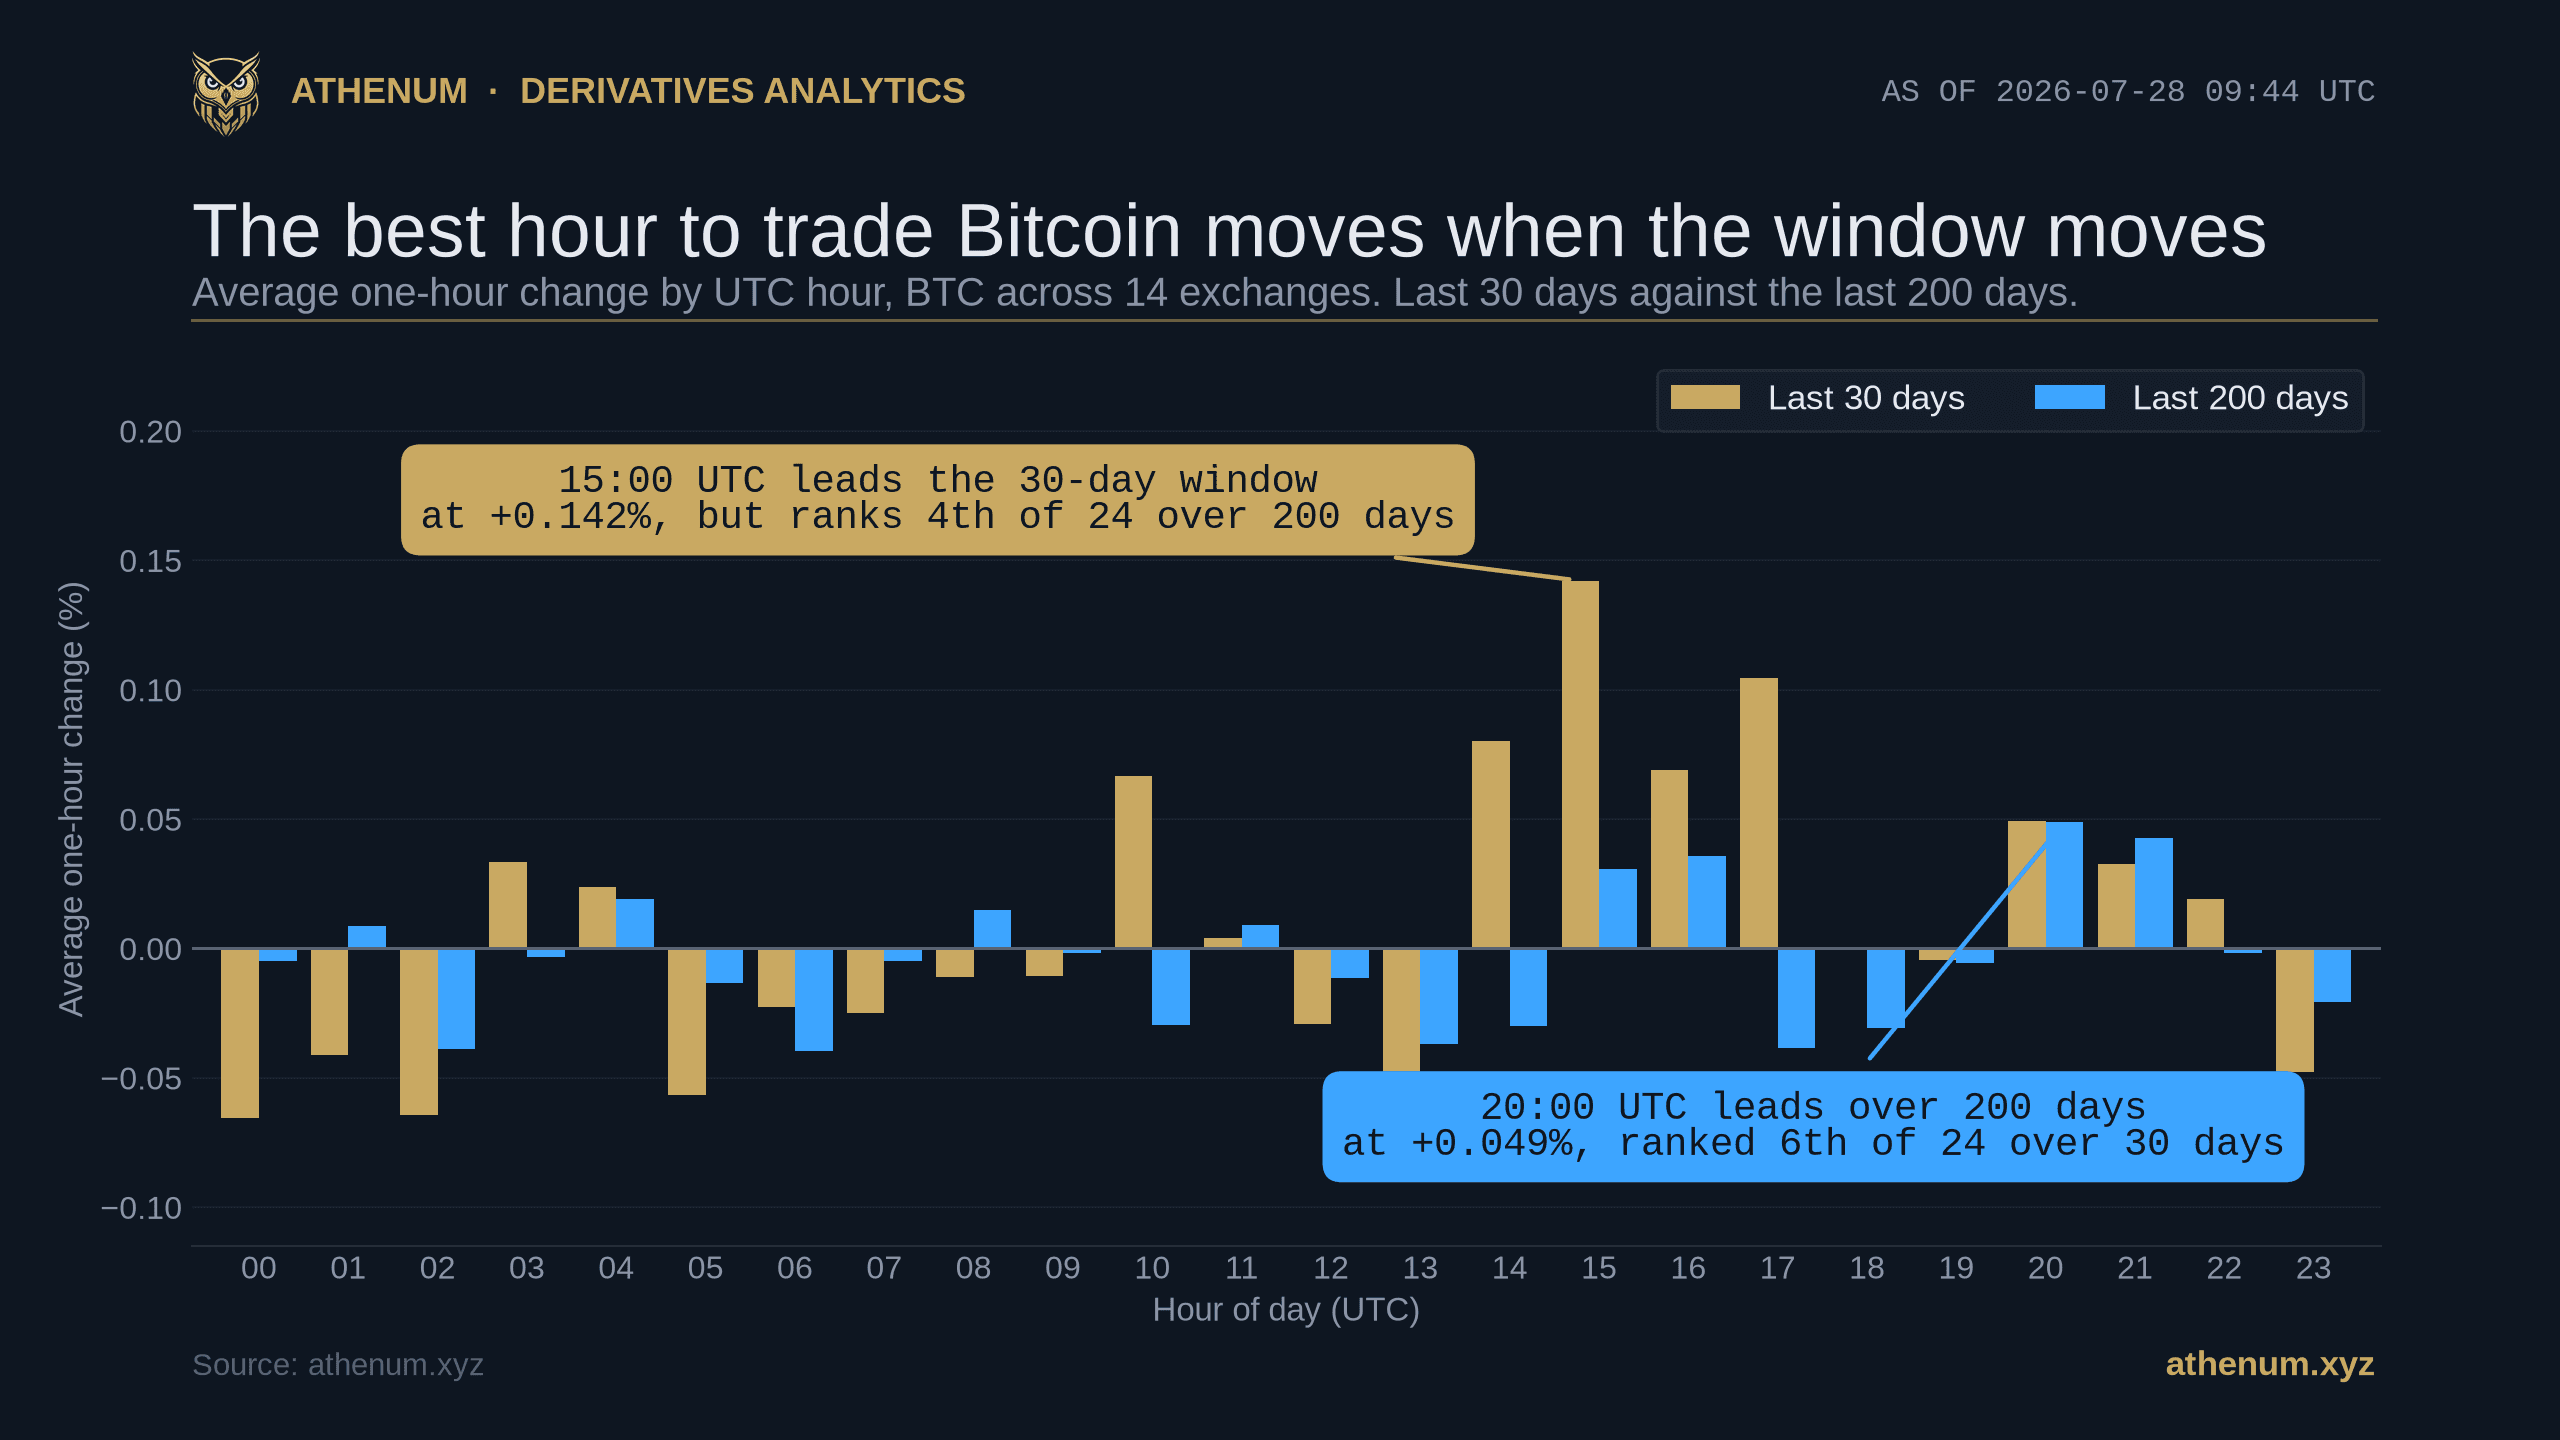
TLDR. Crypto trading hours run on a 24/7 clock with no opening bell, so every hour-of-day chart has a winner and none of them has to mean anything. On 2026-07-28, Athenum's live cross-exchange Bitcoin feed says the strongest UTC hour of the last 30 days is 15:00 UTC at +0.142% on average, and the weakest is 13:00 UTC at -0.066%. Stretch the same measurement to 200 days and the leaderboard rearranges: 20:00 UTC takes first at +0.049%, while 15:00 UTC drops to fourth. Eight of the 24 hours change sign between the two windows. That is not a data problem, it is a sample-size problem: a 30-day window holds 29 or 30 observations per hour, and once each hour carries its own error bar, not one of the 24 sits even two standard errors away from zero. Crypto does have real time-of-day structure, but it comes from the settlement calendar, not from the return ranking. This post separates the two.

Bitcoin's best UTC hour on 2026-07-28: 15:00 UTC over 30 days, 20:00 UTC over 200 days, measured across 14 exchanges.
Which UTC hours moved Bitcoin most in the last 30 days?
Over the 30 days ending 2026-07-28, the average one-hour change in Bitcoin, measured across the 14 exchanges Athenum normalizes into one feed, ranks 15:00 UTC first at +0.142%, 17:00 UTC second at +0.105% and 14:00 UTC third at +0.080%. The weakest hour is 13:00 UTC at -0.066%, though it is a photo finish: 00:00 UTC is second-worst at -0.065%, which is 0.0002 points away. Bitcoin traded at $63,445 on the feed's 2026-07-28 09:00 UTC reading, so a 0.142% hour is worth about $90 on one coin.
Three things are worth noticing before anyone builds a schedule out of that.
1. The top of the table clusters in the afternoon and evening UTC block, which is the overlap between European afternoon trading and the US cash session. 2. The gap between the best and the worst hour is 0.208 percentage points. A single Bitcoin hour scatters by 0.26 points at the median across the 24 slots, so the whole 24-hour spread is smaller than one typical hour's move. 3. Each of those averages rests on 29 or 30 observations, one per calendar day. The feed samples the market far more often than that, so the underlying hour-of-day reading carries about 1,700 samples per hour slot, but a 30-day window still contains only 30 days. Sample count is not observation count, and only the second one shrinks an error bar.
Does the same pattern hold over 200 days?
No. As of 2026-07-28, the feed's published hour-of-day reading reaches back about 200 days, and over that longer window the ranking rearranges. The order runs 20:00 UTC first at +0.049%, 21:00 UTC second at +0.043%, and the 30-day champion 15:00 UTC down in fourth at +0.031%. Running it the other way is just as unflattering: the 200-day leader 20:00 UTC only ranks sixth over the last 30 days. The worst hour moves too, from 13:00 UTC on the short window to 06:00 UTC on the long one.
That reshuffle is not an artifact of one data source either. Measure the same 200 days on Binance's public hourly closes instead and the leader is 16:00 UTC, with 20:00 UTC second and the aggregate's own 200-day margin, 0.089 points between best and worst, widening to 0.160 points on the public series. Two reasonable measurements of the same 200 days do not even agree on which hour won.

8 of the 24 UTC hours change sign between the 30-day and 200-day windows on 2026-07-28, same feed and same measurement.
The sharpest way to see it is the sign. Eight of the 24 hours, 01:00, 03:00, 08:00, 10:00, 14:00, 17:00, 18:00 and 22:00 UTC, are positive on one window and negative on the other. Same asset, same feed, same arithmetic. The only thing that changed is how far back the look-back reaches.
Be strict about that count too, the way the venue comparison below is. The weakest of them is 18:00 UTC, which sits at +0.0006% over the 30 days, inside the same 0.005 points where a sign means nothing, and reads negative on the feed's own published version of the same month. Seven of the eight are reversals worth the name. The spread itself also collapses: 0.208 points between best and worst over 30 days, 0.089 points over 200 days. Longer windows do not sharpen the pattern here, they flatten it, which is the fingerprint of an average converging toward zero rather than toward a real edge.
How much of the hour-of-day pattern is noise?
Most of it, and the arithmetic is short enough to check by hand. The one step that matters is giving every hour its own error bar, because Bitcoin's hourly volatility is not the same at every hour: across the 24 slots the standard deviation of a one-hour move ranges from 0.17 to 0.45 points, with a median of 0.26. Using one blanket figure for all 24 flatters the noisiest hours, and the noisiest hours are exactly the ones that take the extremes of a 30-day ranking.
One note on sourcing before the numbers, because it is the kind of thing that quietly breaks an analysis. The 30-day figures in this post are recomputed hour by hour from the feed's own hourly Bitcoin series, which is what makes a per-hour error bar possible at all. That recomputation reproduces the feed's published hour-of-day reading to within 0.013 points on every one of the 24 hours, so the two agree; the recomputed series is used throughout only because it also carries the scatter.
Take the winner. Over the 30 days to 2026-07-28, 15:00 UTC averaged +0.142%, but its own hourly moves scatter by 0.44 points, the second widest of any hour on the clock. Divide that by the square root of its 30 observations and its standard error is 0.080 points, which puts the reading 1.78 standard errors from zero. Not two. Run the same sum on all 24 and 0 of them clear two standard errors; the closest is 10:00 UTC at 1.83, and it is not the hour that tops the ranking.
Question | 30-day window, 14-exchange aggregate | 200-day window, Binance public closes |
|---|---|---|
Observations per hour | 29 to 30 | 200 to 201 |
Standard error per hour | 0.031 to 0.083 points | 0.024 to 0.051 points |
Best hour | 15:00 UTC at +0.142% | 16:00 UTC at +0.078% |
Best minus worst hour | 0.208 points | 0.160 points |
Largest reading, in standard errors | 1.83 | 2.12 |
Hours at least 2 standard errors from zero | 0 of 24 | 1 of 24 |
Hours clearing the 24-test threshold (3.39 and 3.12) | 0 of 24 | 0 of 24 |

Per-hour error bars to 2026-07-28: 0 of 24 hours clear zero on the 30-day aggregate, 1 of 24 on the 200-day public series.
The right-hand panel is the fair long-run test, and it is measured on Binance's public hourly closes rather than the aggregate for a simple reason: the aggregate's published 200-day reading is an average without the day-by-day scatter an error bar needs, and an error bar you cannot compute is worse than one you borrow from a series any reader can download. Over those 200 days exactly 1 hour of 24 clears two standard errors, 11:00 UTC at -2.12, and it is a negative hour, not a winning one. It also clears by a hair. That single result is not evidence of anything, because ranking 24 hours means running 24 tests at once, and 24 tests at the usual 5% threshold are expected to throw up about one false positive on their own. To survive 24 simultaneous two-sided comparisons an hour needs about 3.39 standard errors on the 30-day window, where there are fewer observations to go on, and about 3.12 on the 200-day one. On 2026-07-28 none of them has it on either.
There is a second test that needs no statistical vocabulary at all. Take every hourly return in the window, shuffle the UTC labels at random so that no hour keeps its own data, then measure the gap between the best and worst hour of that fake clock. Repeat it 2,000 times and you learn how big a spread pure chance manufactures. Over the last 30 days the real gap is 0.208 points and the median random gap is 0.211 points, so the real clock produces slightly less spread than randomly relabeled data does on a typical run. Over 200 days the real gap of 0.160 points does beat the median random gap of 0.134 points, but it stays under the 0.176 points that chance reaches one time in twenty, which is the usual bar for calling something real. This shuffle handles the 24-way multiplicity by construction, which is why it is worth running alongside the error bars rather than instead of them.
None of this is a contrarian position, though neither of the studies below tests hour of day directly. Coinbase Institutional's 2025 review of calendar effects in Bitcoin found that no calendar month clears a significance hurdle once confidence intervals are attached, and a 2024 Finance Research Letters study that widened the test to 500 coins reported no robust evidence of return anomalies, with the one robust finding being lower trading activity at weekends rather than a difference in returns. Both point the same way at the calendar frequencies they do test: activity has a clock, returns do not.
One honest caveat about the shuffle, because it cuts in the direction of the conclusion rather than against it. Reshuffling assumes each hour is an independent draw, and crypto volatility clusters, so the true random spread is if anything wider than 0.176 points. A more careful test would make the hour-of-day pattern look weaker still, not stronger.
Do two honest measurements of the same month even agree?
They do not, and that is the most useful single check a reader can run. Take exactly the same 30 days ending 2026-07-28 and measure the hour-of-day pattern twice: once on the 14-exchange aggregate, and once on Binance's public hourly BTCUSDT closes, which anyone can download without an account. The aggregate peaks at 15:00 UTC. Binance peaks at 16:00 UTC, where the aggregate ranks that hour only fourth. The aggregate's champion 15:00 UTC ranks third on Binance. The two disagree even on direction for 3 hours: 12:00, 17:00 and 19:00 UTC. Be strict about that count: 1 of those 3 sits on an aggregate reading inside 0.005 points of zero, where a sign is a coin flip about a number that is already nothing. The disagreements worth the name are 12:00 and 17:00 UTC, and at 17:00 UTC the two readings are 0.113 points apart on a quantity whose whole 24-hour range is 0.208 points.

The same 30 days to 2026-07-28 measured two ways: the aggregate's best hour is 15:00 UTC, Binance's is 16:00 UTC.
Neither measurement is wrong. An aggregate across 14 exchanges and a single venue's closing prints are different estimators of the same thing, and when the underlying signal is small relative to the noise, two good estimators can rank the same month differently. That is exactly what an effect too small to measure looks like from the outside. If a real 0.142% edge lived at 15:00 UTC, both measurements would find it, the way both of them agree on the price itself: $63,445 on the aggregate's 2026-07-28 09:00 UTC reading and $63,529 on Binance at its 2026-07-28 09:44 UTC snapshot, a gap of 0.13%. A large real effect survives a change of measurement. Whatever is here does not, which is the signature of an effect too small to detect at this sample size rather than proof that no effect exists at all.
What actually creates real time-of-day structure in crypto?
The calendar, not the return average. Crypto spot and perpetual markets never close, but several things inside them happen at fixed clock times, and those are mechanical rather than statistical.
Event | When | Why it matters |
|---|---|---|
Perpetual funding settlement on Binance, Bybit, OKX and Bitget | 00:00, 08:00 and 16:00 UTC | Cash changes hands between longs and shorts; crowded positions get repriced |
Perpetual funding settlement on Hyperliquid | Every hour | The same daily cost is paid in 24 slices instead of 3 |
Deribit options and dated futures expiry | 08:00 UTC | Open interest at the strike stops existing, which concentrates hedging into the hours before it |
US equity cash session | 13:30 to 20:00 UTC while New York is on daylight time | Macro releases and risk repricing arrive with it |
CME crypto futures maintenance | About two hours each Saturday, plus a pause of about two minutes on weekdays | The only scheduled halt left in an otherwise continuous week, since 2026-05-29 |
Those are the hours worth having in your head, and none of them is a claim about which hour goes up. A funding settlement is a cash flow with a known size, and you can price it exactly rather than guess at it: the free Athenum funding rate calculator turns a rate into the dollar cost of a hold, and the reason the same perpetual costs different amounts on different venues is the settlement interval itself, which is worked through in funding rate intervals.
One more piece of the old folklore is now out of date. The weekend gap in Bitcoin futures, where the CME closed on Friday evening and reopened on Sunday leaving an unfilled hole in the chart, is not the market structure of 2026. CME crypto futures went to a near-continuous schedule at 16:00 Central Time on 2026-05-29, keeping only a pause of about two minutes on weekdays and a maintenance window of about two hours each Saturday, so the classic Friday-to-Sunday gap no longer forms. Anyone reading an hour-of-day or day-of-week chart built on data from before that date is reading a market that has since changed its opening hours.
Do the APAC, EU and US sessions behave differently?
Slightly, and less durably than the hour-of-day chart suggests. Group the 24 hours into three eight-hour blocks and sum each block's average contribution to one day's move. Over the 30 days to 2026-07-28 the ranking is US first, then EU, then APAC.
Session | Hours | Last 30 days | Last 200 days |
|---|---|---|---|
APAC | 00:00-08:00 UTC | -0.218% | -0.077% |
EU | 08:00-16:00 UTC | +0.171% | -0.054% |
US | 16:00-24:00 UTC | +0.218% | +0.030% |

Session contributions to 2026-07-28: APAC negative on both windows, EU positive over 30 days and negative over 200.
APAC is the only block that stays negative on both windows, at -0.218% over 30 days and -0.077% over 200. The EU block reverses outright, from +0.171% to -0.054%. The US block keeps its sign but loses most of its size, from +0.218% to +0.030%, leaving about a seventh of the 30-day figure.
Apply the post's own second check to those three numbers before believing any of them. A session total is a sum of eight hourly moves, so it is noisier than a single hour, not quieter: measured day by day across the same month the US block's own standard error is 0.158 points, the EU block's is 0.210 and APAC's is 0.145. That puts US at 1.38 standard errors from zero, EU at 0.81 and APAC at -1.50. None of the three clears two. Pooling eight hours does improve the ratio of signal to noise, by roughly the square root of eight rather than by eight, and even that is not enough here.
How do you read an hour-of-day chart without fooling yourself?
Five checks, in the order that kills the most bad conclusions fastest.
1. Count the observations, not the samples. A 30-day hourly chart has about 30 numbers behind each bar no matter how finely the underlying data is sampled. A reading built on roughly 1,700 samples per hour slot still has only 30 calendar days inside it. 2. Put an error bar on it, and use each hour's own scatter rather than one blanket number. Divide that hour's own standard deviation by the square root of its observation count. On 2026-07-28 the winning hour's scatter is 0.44 points, the second widest on the clock, which is most of the reason it is winning. 3. Change the window and look again. If the best hour survives from 30 days to 200 days it is worth a second look. On 2026-07-28 it does not: 15:00 UTC drops to fourth. 4. Change the measurement and look again. An aggregate and a single venue should agree about anything real. Where they disagree, the effect is smaller than the difference between two reasonable ways of measuring it. 5. Separate the calendar from the average. Funding at 00:00, 08:00 and 16:00 UTC and expiry at 08:00 UTC are scheduled facts you can plan a position around. The ranking of hourly returns is an estimate, and on 2026-07-28 an estimate too small to act on. Price the scheduled part in the free funding rate calculator, size the trade in the position size calculator, and cost the whole round trip including funding in the PnL calculator.
Two neighboring reads finish the picture. If you want the structural reason venues charge different amounts to hold the same perpetual at the same moment, that is funding rate intervals. If you want the other half of intraday cost, the part that shows up on every entry and exit rather than at a settlement stamp, that is the bid-ask spread and tick size. And for what open interest is doing while the clock runs, the four regimes are laid out in open interest and price.
Nothing above needed a paid data terminal. Athenum's live derivatives feed spans 14 exchanges, and its 34 calculators stay free: no account, no email, no usage limits. The Binance leg is public data anyone can pull without an account either, which is the point of quoting it. When you want the hour-of-day view running against a live market rather than a screenshot of one, it is in the Athenum terminal.
One terminal. All the data.
Liquidations, orderbook depth, whale walls & open interest from 4 exchanges, all real-time, in one place.
No credit card required

Athenum Analytics
Athenum Analytics is our three-person editorial team covering crypto derivatives, market data and macroeconomic context.