The 25-delta risk reversal is the implied-volatility gap between an out-of-the-money call and an out-of-the-money put at the same distance from spot. It is one of the cleanest read-outs of directional positioning in crypto options: when puts carry richer implied vol than equivalent calls, the market is paying up for downside protection (fear); when calls are richer, it is paying up for upside exposure (greed). Read as a level and as a change over time, the risk reversal tells you which side of the tail traders are hedging, a signal that often moves before spot does.
What is options skew?
If every option on an asset were priced off a single "fair" volatility, a plot of implied volatility against strike would be a flat line. In real markets it is not flat. Out-of-the-money options usually trade at different implied volatilities than at-the-money ones, and the puts and calls are rarely symmetric. That asymmetry is skew.
Skew exists because option demand is not balanced. Different participants want different protection. The price of an option is, in part, the price of the insurance it provides, and the side of the market that more people want to insure against trades at a higher implied volatility. Skew is therefore a positioning signal hiding inside a pricing surface: it shows where the crowd is willing to pay up.
The full picture across all strikes is the volatility smile (or smirk). The risk reversal is a way to compress that whole curve into a single, comparable number.
What is the 25-delta risk reversal?
The 25-delta risk reversal is the implied volatility of a 25-delta call minus the implied volatility of a 25-delta put for the same expiry:
Risk reversal = IV(25Δ call) − IV(25Δ put)
Delta is roughly the option's sensitivity to spot and a loose proxy for the probability it finishes in the money. A 25-delta call and a 25-delta put sit at comparable distances out of the money on either side of spot, close enough to be liquid and actively traded, far enough out to reflect genuine directional bets rather than at-the-money noise. That balance is why the 25-delta points, rather than the 10-delta tails or the at-the-money strike, are the conventional gauge.
The sign tells the story:
- Positive risk reversal, calls cost more implied vol than equivalent puts. The market is paying up for upside; positioning leans bullish or is reaching for a rally.
- Negative risk reversal, puts cost more implied vol than equivalent calls. The market is paying up for downside protection; positioning leans defensive or fearful.
- Near zero, upside and downside are priced symmetrically, with no strong directional lean in the demand for optionality.
How do you read it as a directional-fear gauge?
Read the risk reversal two ways at once: its level and its rate of change.
The level tells you the standing bias. A persistently negative reading means downside insurance is structurally in demand, traders keep paying more to hedge a drop than to chase a pop. A persistently positive reading means the opposite: appetite for upside convexity is the dominant flow.
The change is often the louder signal. A risk reversal that swings sharply more negative over hours or days means demand for downside protection is being repriced in real time, frequently while spot is still holding up. Because hedging and positioning adjustments can lead price, a fast move in the risk reversal is one of the earlier tells that conviction is shifting. A sudden swing toward positive can mark capitulation in the hedging, or a scramble for upside after a breakout.
A practical habit: compare the risk reversal across tenors. Short-dated risk reversals react to immediate event risk and near-term fear; longer-dated ones reflect structural positioning. When short-dated skew turns sharply more negative than the longer-dated curve, the market is pricing an acute, near-term worry rather than a regime change.
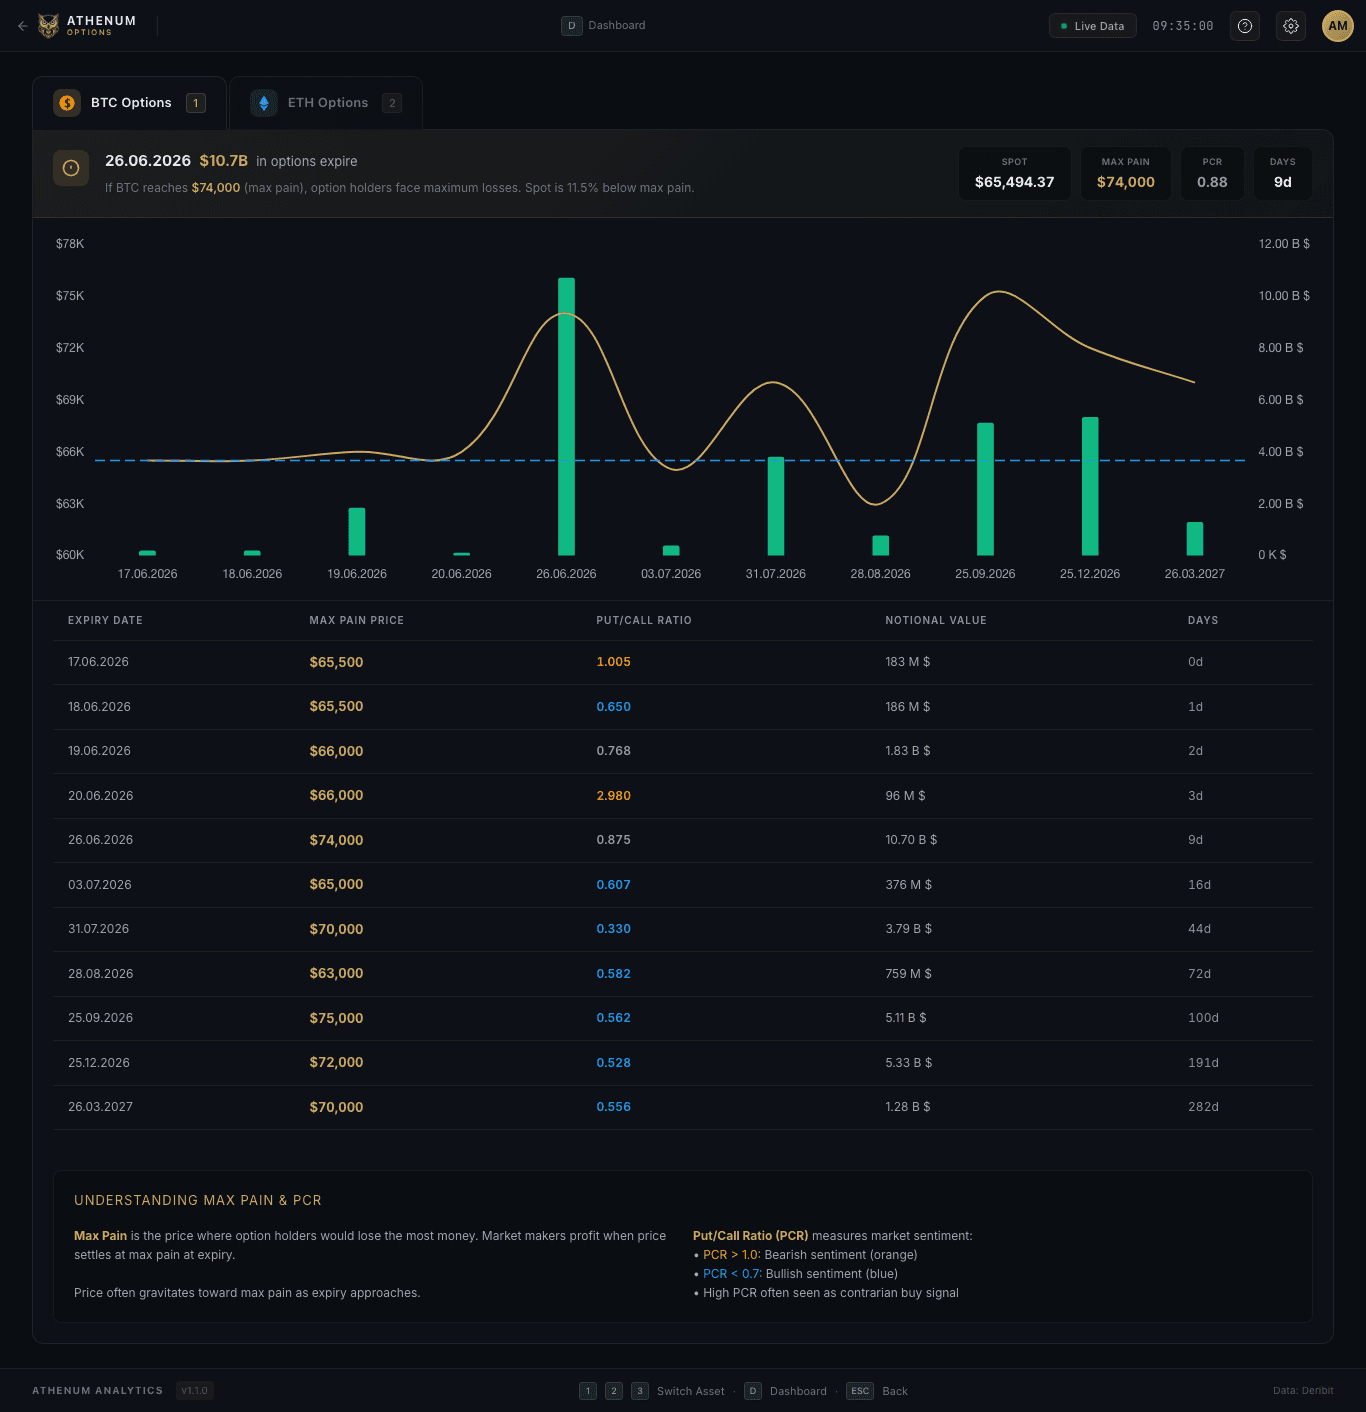
If you want to see the option surface, funding, open interest, and order-flow context side by side rather than in isolation, a unified analytics terminal like Athenum is built to put those layers in one workspace.
Why is crypto skew different from equities?
This is the part that trips up traders coming from traditional markets. Equity indices carry an almost permanent put skew: protection against a crash is structurally bid because institutions are net long stock and constantly hedge tail risk. The index risk reversal there is reliably negative.
Crypto has historically behaved differently. For long stretches, crypto risk reversals have leaned positive, calls richer than puts, because so much positioning is built around reaching for upside rather than insuring a long book. That does not mean crypto never fears: under genuine stress, crypto risk reversals can flip hard negative as demand for downside protection spikes, and short-dated skew can swing violently in a single session.
The takeaway is that there is no universal "normal" sign for crypto skew the way there is for equity indices. You have to read the risk reversal relative to its own recent range and across tenors, not against an equity-style assumption that negative is the default. A crypto risk reversal sitting near zero might already be unusually defensive by crypto's own standards.
What are the limits of the signal?
The risk reversal is a positioning gauge, not a forecast. A few caveats keep it honest:
- It measures demand, not direction. A negative reading tells you people are paying for protection. Heavy hedging can coincide with a bottom as easily as a top, crowded fear sometimes precedes a bounce.
- It is a relative read. Skew is most informative versus its own history and across tenors, not as a single absolute number.
- Liquidity matters. The cleaner the options market on a given asset and expiry, the more meaningful the skew. Thin, illiquid strikes produce noisy implied vols.
- It pairs best with other signals. Risk reversals gain meaning next to open interest, funding rates, realized-versus-implied spreads, and spot order flow, not on their own.
Practitioner takeaway
Treat the 25-delta risk reversal as a sentiment thermometer for the options market: which tail is the crowd paying to hedge, and how fast is that changing? Watch the direction and speed of the move more than any single value, compare short- and long-dated skew to separate event fear from regime shifts, and read crypto's reading against its own range rather than an equity playbook. It will not call the top or bottom for you, but it often shows you where the fear is being priced before that fear shows up in price.
Juggling CoinGlass, Hyblock & TradingLite tabs
Paying $100+/mo across fragmented tools
Stale data you can’t trust for entries
One terminal. All the data.
Liquidations, orderbook depth, whale walls & open interest from 4 exchanges, all real-time, in one place.