Table of Contents9 sections
- What is a funding rate cap, and what is it not?
- Has Bitcoin's funding rate ever actually reached its cap?
- Why does the answer change completely depending on which year you read?
- Can you compare an old settlement against today's cap at all?
- Which contracts actually reach the cap, and when?
- What happens to your bill when a contract does hit the cap?
- How far is funding from its cap right now?
- How should you size a position against a funding cap?
- What does this post not say?
Practise with worked lessons
- Funding forecast vs payment: explain the rate and exposure gap
A 30 USDT funding estimate became a 12 USDT receipt. Separate the rate change from the exposure change and reconcile the account's actual funding entry.
TLDR. Every crypto perpetual carries a published maximum funding rate, and almost nobody checks how often it is actually reached. We walked the entire settled funding history of Binance's BTCUSDT perpetual, all 7,609 settlements from 2019-09-10 08:00 UTC to 2026-08-20 08:00 UTC, against the 0.300% per 8 hours cap the contract carries today. The cap has been reached exactly once, on 2020-02-12 00:00 UTC, and the floor exactly once, on 2020-03-13 08:00 UTC. In 2022, 2025 and 2026 the rate never once passed 0.0100%, which is 3.3% of the cap, across 2,885 settlements. On the long tail it is a different instrument entirely: ALPACAUSDT settled at or past 2% 27 times inside six days in April 2025, and a sweep of 281,101 settlements on 569 live contracts, read today, found 48 floor settlements on 21 contracts once a reconfigured outlier is set aside. Two things follow that most write-ups miss. Reaching the cap does not cap your bill, because on Binance, OKX and Bybit it triggers a switch to more frequent settlement. And 7 of 12 long-lived contracts have settled a rate strictly above the cap they carry today, which means the limits in force then were not the limits in force now, so scoring an old rate against a current cap compares two rulebooks.
What is a funding rate cap, and what is it not?
A perpetual futures contract has no expiry, so instead of converging to a settlement price it pays a periodic cash transfer between longs and shorts called funding. Each venue publishes, per contract, a maximum and a minimum that transfer can be. Binance returns them on a no-key endpoint as `adjustedFundingRateCap` and `adjustedFundingRateFloor` next to `fundingIntervalHours`, and for BTCUSDT on 2026-08-20 those read 0.00300, -0.00300 and 8.
Where does 0.300% come from? Binance's funding FAQ gives the rule for a named list of about 34 major contracts: the cap is 0.75 times the maintenance margin ratio, and the floor is its negative. BTCUSDT's maintenance margin ratio at the lowest risk tier is 0.4%, and 0.75 x 0.4% = 0.300%. Everything not on that list is capped at 2%.
Two things the number is not.
It is not a per-day figure. 0.300% on an 8 hour contract is 0.900% a day; the same 0.300% on a 4 hour contract would be 1.800%. Note also what Binance's API documentation does and does not say: the response table for `adjustedFundingRateCap` carries an example value and no description, so neither the unit nor the period is stated there at all. Both are established elsewhere, in the FAQ and in the settlement-frequency announcement. The full census of how far those caps spread across a whole board is in Athenum's post on the per-symbol funding interval, and this post does not repeat it. This post asks what the market actually does inside the band.
It is also not the 0.0100% figure that dominates funding data. That is the interest-rate term in the published formula, not a limit. Binance's current form, in force since 2025-09-18, is the premium index plus a premium-clamped interest term, all divided by 8/N for a contract that settles every N hours, and only then clamped to the cap. While the perpetual trades close enough to its index, the premium terms cancel and the settlement lands on the interest rate itself. So 0.0100% is a resting point and 0.300% is a ceiling, and they sit a factor of 30 apart. The mechanics are in how crypto perpetual funding rates are calculated.
Has Bitcoin's funding rate ever actually reached its cap?
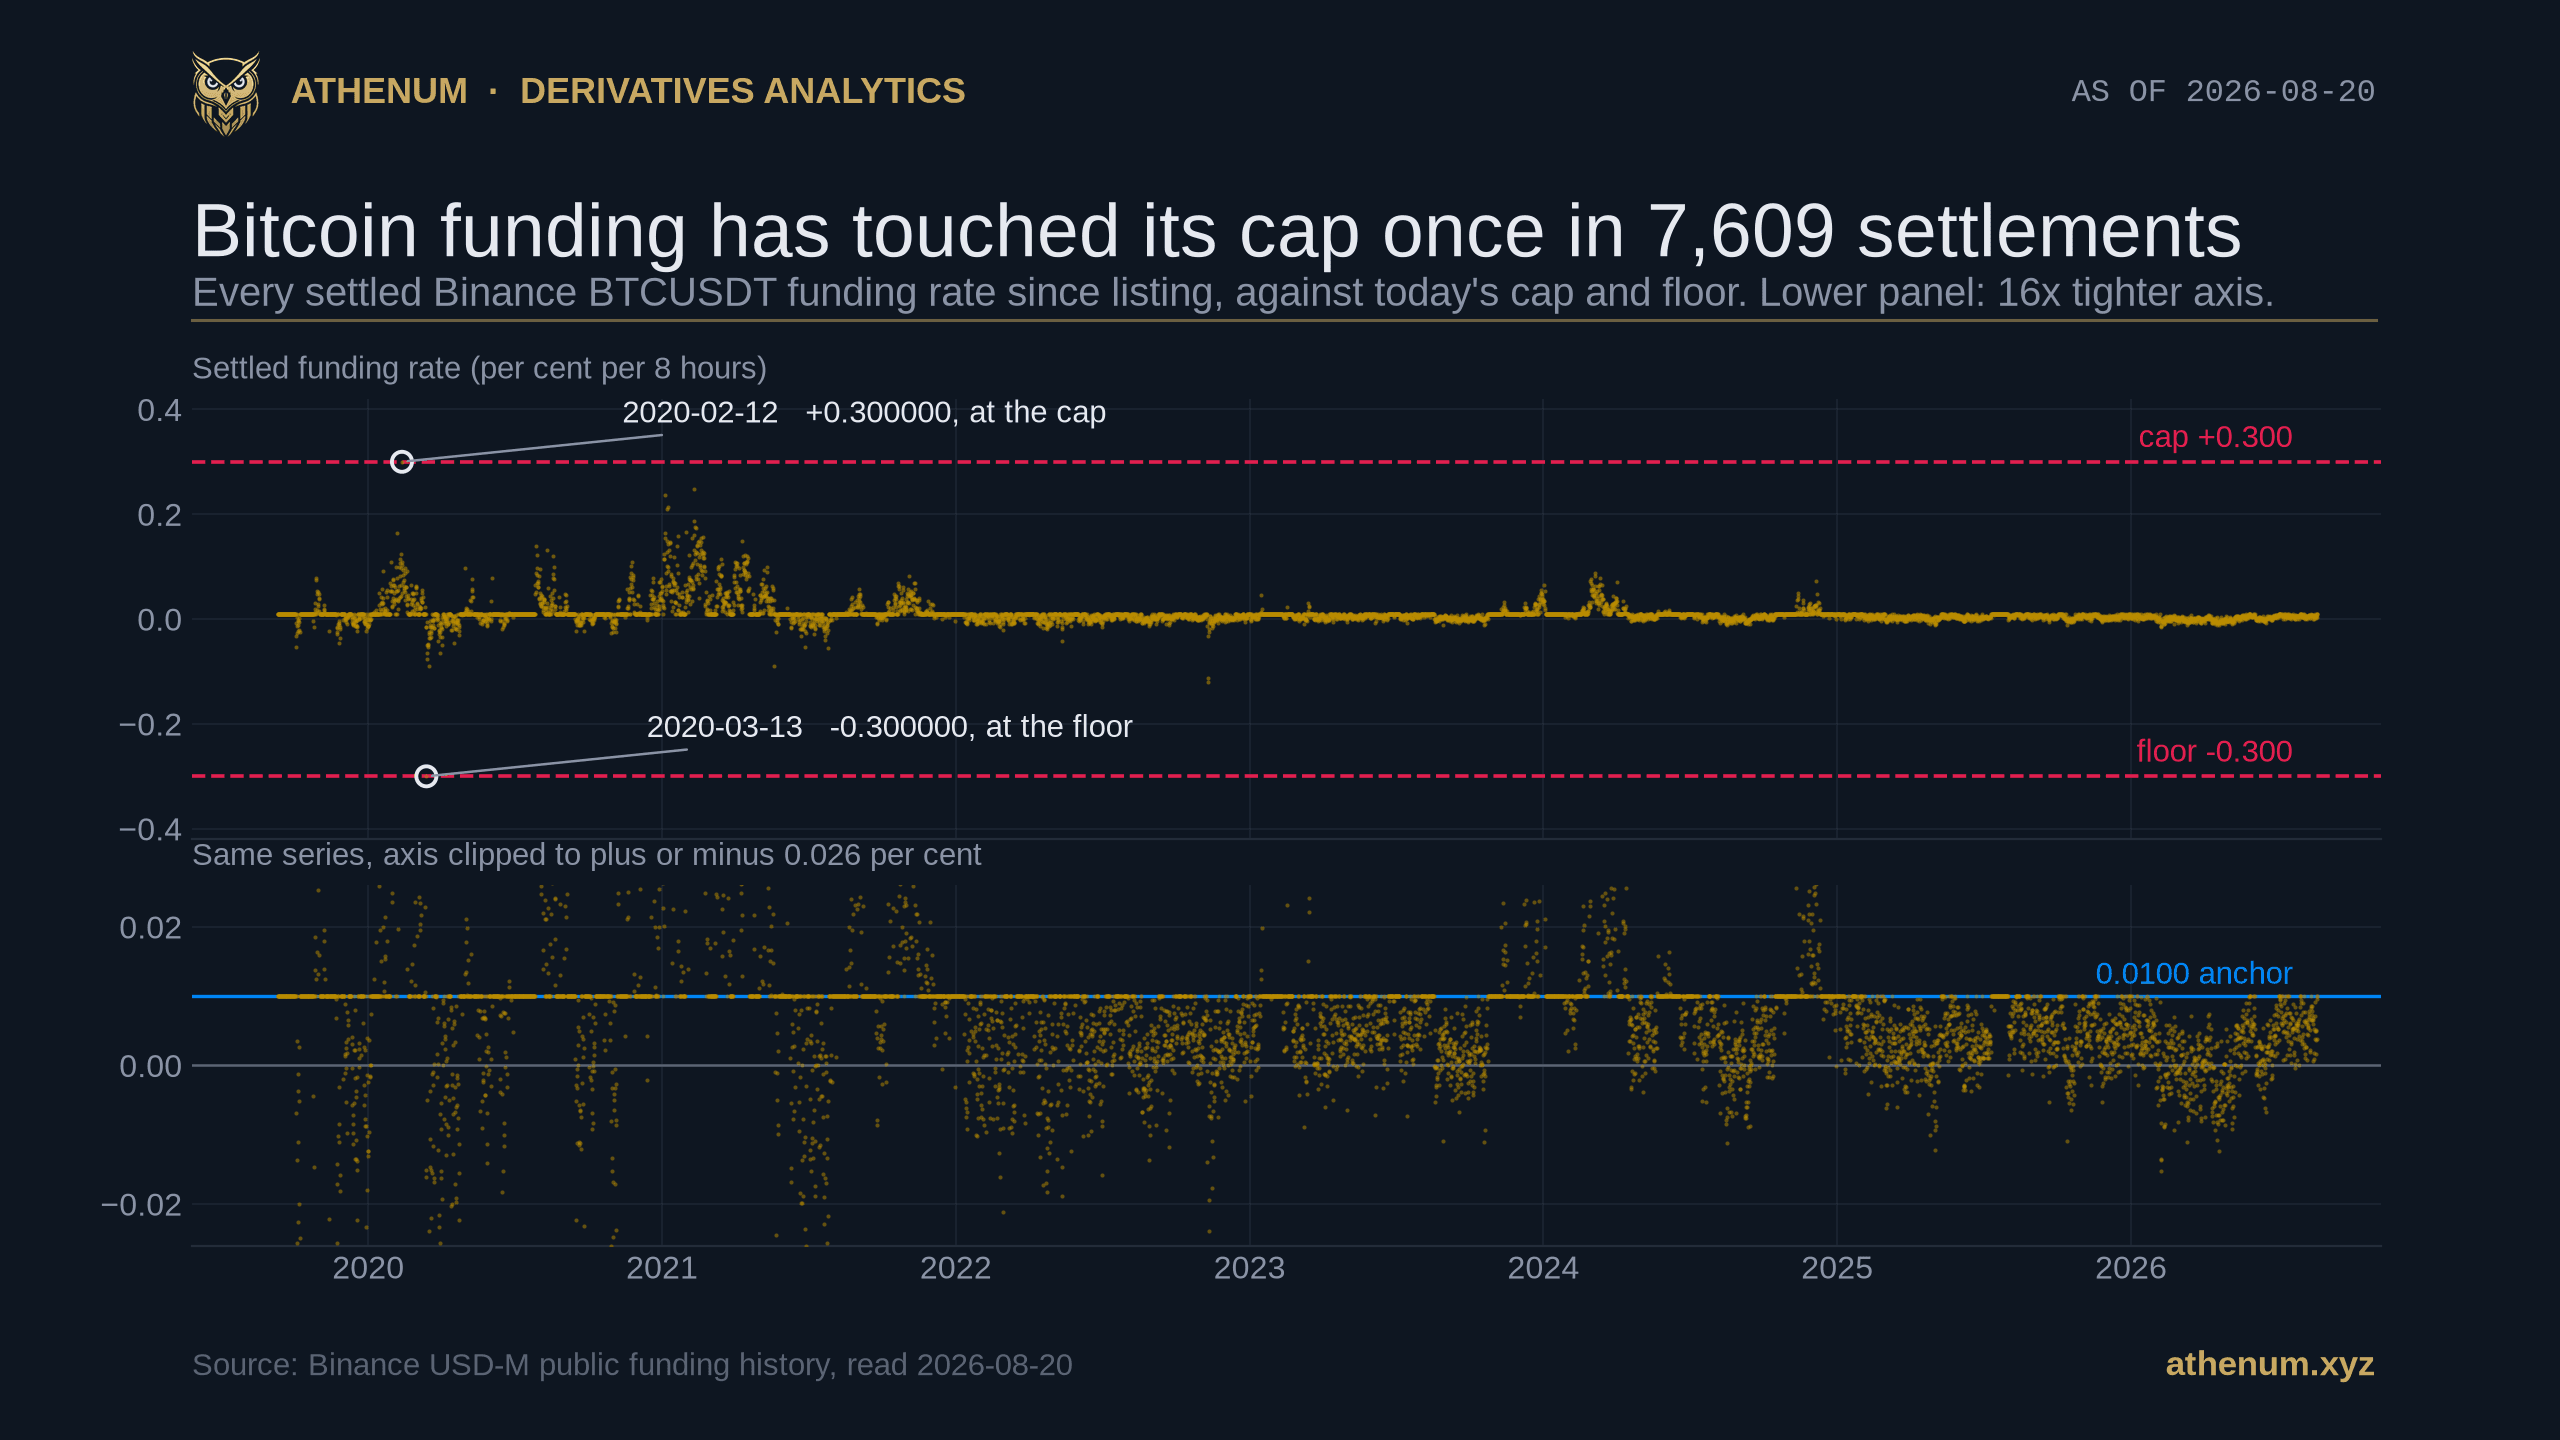
Once. Binance's BTCUSDT perpetual has settled funding 7,609 times between 2019-09-10 08:00 UTC and 2026-08-20 08:00 UTC, and exactly one settlement printed +0.300000%: 2020-02-12 00:00 UTC. Exactly one printed -0.300000%: 2020-03-13 08:00 UTC, inside that March's liquidity collapse.
Two settlements out of 7,609 is 0.026% of the contract's life, and both fall in a five week window more than six years ago.
The rest of the distribution is worth stating precisely rather than as "far away". The second-highest reading in the series is +0.248993% on 2021-02-08 16:00 UTC, which is 83.0% of the cap, and the third is +0.236482% on 2021-01-04 08:00 UTC, at 78.8%. Everything else in seven years sits below 79% of the ceiling. Past 30% of it there are 118 settlements, 1.55% of the series; past 50% there are 17.
The coin-margined board says the same thing from another angle. Binance's inverse BTCUSD perpetual has settled 6,602 times since 2020-08-10 and its highest reading is +0.186012%, on 2021-04-10 08:00 UTC.
Why does the answer change completely depending on which year you read?
Because funding is a regime variable, and a measurement taken inside one regime cannot fail. Split the same 7,609 settlements by calendar year and the result is not a noisier version of itself, it is a different picture.

The same contract, split by year. In 2021, 42.9 per cent of settlements paid more than the interest anchor. In 2022, 2025 and 2026, not one of 2,885 did. A measurement of how often the cap binds, run on any single one of those years, would have returned a confident and completely different answer.
Year | Settlements | Highest | Share of the cap | Lowest | Above 0.0100% | Negative |
|---|---|---|---|---|---|---|
2019 | 338 | +0.0784% | 26.1% | -0.0525% | 6.8% | 18.3% |
2020 | 1,098 | +0.3000% | 100.0% | -0.3000% | 26.8% | 14.3% |
2021 | 1,095 | +0.2490% | 83.0% | -0.0897% | 42.9% | 7.3% |
2022 | 1,095 | +0.0100% | 3.3% | -0.1192% | 0.0% | 22.1% |
2023 | 1,095 | +0.0552% | 18.4% | -0.0110% | 6.3% | 10.1% |
2024 | 1,098 | +0.0881% | 29.4% | -0.0112% | 19.4% | 8.4% |
2025 | 1,095 | +0.0100% | 3.3% | -0.0122% | 0.0% | 12.9% |
2026 | 695 | +0.0100% | 3.3% | -0.0152% | 0.0% | 29.9% |
Read 2021 alone and funding looks like a live, expensive variable: 42.9% of that year's settlements charged more than the interest anchor and the year peaked at 83% of the cap. Read 2022 alone and funding looks like a fixed fee: 0 of 1,095 settlements went above 0.0100%, and the same holds for 2025 and for 2026 so far. Three of the last five calendar years produced 2,885 settlements between them and not one exceedance.
That is why we are not publishing "the cap never binds" as a finding. It is true of everything from 2022 onward and false of 2020, and which one you believe is decided entirely by how far back you looked. The same trap sits at the other end: 2026 has the highest share of negative settlements in the whole series, 29.9%, in a year whose upside never once left the anchor.
Can you compare an old settlement against today's cap at all?
Not safely, and this is the part that surprised us. Extend the walk from one contract to 12 long-lived Binance USD-M perpetuals, 84,621 settlements, and compare each contract's all-time high against the cap that same contract publishes today.

Twelve contracts, 84,621 settlements. Seven have printed a rate strictly above the cap they carry today and BTCUSDT sits exactly on it. A bar past the line is not evidence that a cap bound; it is evidence that the cap was different then, because a settlement above a cap is impossible under that cap.
Seven of the twelve have settled a rate strictly above the cap their contract publishes today, and BTCUSDT sits exactly on it. AVAXUSDT's record of +0.518469% on 2021-02-13 is 138.3% of its current 0.375% cap. XRPUSDT's is 130.1%, ETHUSDT's 125.0%, LINKUSDT's 118.5%.
A settled rate cannot exceed the cap that was in force when it settled, so each of those seven bars says the cap in force then was wider than the cap in force now. BTCUSDT's exact 100.0% is the one that proves nothing either way: a settlement landing on the cap is equally consistent with an unchanged 0.300%. The floor side is starker, with 11 of 12 having settled at or beyond today's floor. SOLUSDT's low of -2.000000% on 2022-11-09 is 533% of the 0.375% floor it carries today.
The consequence is a rule, not a number. Binance publishes the cap that applies now and no history of its value, and its own FAQ says it reserves the right to adjust the parameters. There is a partial trail: `fundingInfo` carries an `updateTime` per symbol, and 703 of the 760 rows in today's response have one. But 57 are null, BTCUSDT is one of the 57, and even a populated `updateTime` gives you the date of the last change without the value before it. So a sentence of the form "this contract has never come within X of its cap" is meaningful only since its last configuration change, which for BTCUSDT is a date the endpoint does not carry. Every historical figure in this post is stated against today's cap and labelled as such, and none of them should be read as the limit that applied on the day.
One more thing the panel shows: every record high in it falls between 2020-01-06 and 2021-02-20, a 13.5 month window. Not one of the twelve has set a new high in the five and a half years since.
Which contracts actually reach the cap, and when?
Small ones, in short squeezes, and more often than the Bitcoin figure suggests. Three episodes from Binance's own settlement history, with the threshold written as a number rather than as "the limit", because what that contract's limit was on the day is exactly what cannot be recovered:
- ALPACAUSDT, 2025-04-24 18:00 UTC onward. Across 2025-04-20 to 2025-05-05 the contract settled 267 times and 27 of those landed at or past 2%, reaching -2.000000% exactly 22 times before the limits themselves were widened mid-episode, after which it printed -4.000000% on 2025-04-29 10:00 UTC and +4.000000% on 2025-04-30 10:00 UTC. - VOXELUSDT, 2025-04-19 04:00 UTC onward. 11 settlements at exactly -2.000000% inside 29 hours. - TRBUSDT, 2023-09-08 08:00 UTC onward. 18 settlements at or past 2% between 2023-09-01 and 2023-10-05, reaching -3.000000% and -2.500000%, on a contract that stayed on its 8 hour clock throughout. Those prints past 2% are themselves the clearest evidence that 2% was not TRBUSDT's limit in 2023.
Now the control, which is where we caught ourselves committing this post's own error. To ask whether a broad selloff binds caps we swept every Binance USD-M symbol across the 48 hours from 2025-10-10 00:00 UTC to 2025-10-12 00:00 UTC. The first pass tested each settlement against a flat 2% and returned zero hits, which is exactly the mistake the section above warns about: 40 of the live contracts carry a cap tighter than 2%, so that test could not detect a bind on any of them.
Re-run against each contract's own published limit, the 5,007 settlements on the 478 symbols that carry one produce 8 limit hits, not zero. Six of the eight are ONEUSDT against a 0.005% cap whose `updateTime` is 2026-08-14, ten months after the window, so those six are an artifact of the comparison rather than an event. The two that survive are LINKUSDC and SOLUSDC, both settling exactly -0.375000%, their floor, at 2025-10-11 00:00 UTC. The next closest were ETHFIUSDC at 88.5% of its floor and AEROUSDT at 88.4%.
So the honest version is narrower than "caps do not bind in crashes". In this one selloff, judged on today's parameters, 2 contracts of 478 reached a limit, both on the floor side, both USDC-quoted majors, in the same hour. The episodes that produce dozens of hits are still the single-contract squeezes above rather than the index-wide move. And we cannot rule out that other contracts bound against limits they no longer carry.
Our own live board points the same way. On 2026-08-20 08:43 UTC we walked the most recent 500 settlements of every live Binance USD-M perpetual, 569 of the 570 contracts, the one exception returning no history, and 281,101 settlements, a median window of 166.3 days for the 8 hour contracts and 83.3 days for the 4 hour ones. Counting every contract, 22 of them settled at their floor 82 times, and 1 settled at its cap 442 times. But 34 of those 82 floor hits and all 442 cap hits belong to ONEUSDT, the same reconfigured contract, whose cap and floor sit at 0.005%, inside where an 8 hour contract normally rests. Setting it aside on both sides, as consistency requires:
- 21 contracts settled at their floor, 48 times, in 2026-06 (18), 2026-07 (28) and 2026-08 (2). - 0 of the remaining 568 contracts reached a cap at all. - The most extreme negative settlement anywhere was -2.000000%, and 21 contracts are tied at exactly that number, which is the 2% floor. The most extreme positive was +0.575243%, on SIRENUSDT.
The band is published symmetrically, cap equal to minus the floor, on all 570 live contracts, and the market arrives at one end of it far more often than the other. Divide each contract's cap by the largest rate it actually printed in the window and the median is 200x; 83.3% of contracts sit at 30x or more, 97.5% at 10x or more.
What happens to your bill when a contract does hit the cap?
It goes up faster than the cap suggests, because reaching the cap changes the clock rather than stopping the charge.
Binance's settlement-frequency rule, in force since 2025-05-02 08:00 UTC, is that if a settlement reaches the cap or floor, the contract moves from an 8 hour or 4 hour schedule to hourly, with the same per-settlement cap. OKX escalates one level at a time down a ladder of 8, 4, 2 and 1 hours, and goes straight back to the contract's default only once every settlement in 12 consecutive hours has sat inside 0.20%. Bybit switches straight to hourly. Binance's and OKX's own texts are explicit that the per-settlement cap is unchanged when the interval shortens; we could not retrieve an equivalent sentence from Bybit, so read that part as covering the two.
The arithmetic is the whole point. A 0.300% cap on an 8 hour clock is a ceiling of 0.900% a day. The same 0.300% cap on an hourly clock is 7.200% a day. The cap number does not move; the maximum daily bill goes up eight times. On a 4 hour contract, which is 433 of Binance's 570 live perpetuals, the same escalation is a factor of four rather than eight. One qualification, which OKX's own documentation supplies: the 8/N divisor that shrinks each settlement's rate also makes each settlement roughly that many times harder to push to the cap, so escalation widens the ceiling without by itself raising the expected bill.
This is visible in the tape rather than only in the rulebook. Of ALPACAUSDT's 267 settlements in that April 2025 window, 230 came exactly one hour apart and only 28 were four hours apart, so the contract spent almost the whole episode on the escalated clock. VOXELUSDT shows 113 one-hour gaps in its window. TRBUSDT in 2023 shows 101 eight-hour gaps and no escalation at all, because the rule postdates it.
A cap read as "the most this can cost me per day" is therefore wrong by up to a factor of eight, and it is wrong in the direction that matters, at exactly the moment it starts to matter.
How far is funding from its cap right now?
A long way. Over the 24 completed hours to 2026-08-20 08:00 UTC, our own cross-venue Bitcoin perpetual feed puts funding more than an order of magnitude below the ceiling its venue publishes, at every venue whose cap we read live.

Athenum's cross-venue feed, 24 hourly readings per venue, all converted to a per 8 hour basis. The medians order the venues, but every interquartile band overlaps at least two others, so that ordering is inside the noise. What is not inside the noise is the distance to the right: the nearest published cap is 0.300 per cent, which is 30 times the widest median on this chart.
A note on the window, because it is the same discipline the rest of the post argues for. The most recent row of an hourly feed is the hour still in progress, so we drop it and read the 24 completed hours before it. Read at 09:24 UTC, the closed 08:00 hour differs at every venue in the feed from what that same row showed at 08:43 UTC, while the hour was still accumulating.
At the 08:00 UTC hour, once closed, Binance, OKX and Bitget each printed exactly 0.0100% per 8 hours on their Bitcoin perpetual, and Bybit printed 0.009996%. Hyperliquid printed 0.00125%, its native hourly rate, which is the same 0.0100% over 8 hours. Deribit printed 0.00204%.
Across the whole 24 hours, the per-venue medians on a common per 8 hour basis are 0.0100% (Binance), 0.0100% (OKX), 0.0100% (Hyperliquid), 0.0066% (Deribit), 0.0060% (Bybit) and 0.0047% (Bitget), with n = 24 each. Do not read that ordering as a ranking: every interquartile band overlaps at least two others. Every venue but Deribit shares the same maximum over the window, 0.0100%; Deribit is the exception at 0.0803%, which is also why its interquartile band is the only one reaching past the anchor. For the rest the spread lives at the bottom of each distribution rather than the top, because the anchor is where the formula lands whenever the premium term vanishes: a perpetual trading at its index returns the interest term exactly, and only one trading below it returns less.
Against the caps those venues publish today, on their Bitcoin perpetual:
Venue | Cap, read 2026-08-20 | Applies per | Rate at 08:00 UTC | Share of the cap used |
|---|---|---|---|---|
Binance BTCUSDT | 0.300% | 8 hour settlement | 0.0100% | 3.33% |
Bitget BTCUSDT | 0.300% | 8 hour settlement | 0.0100% | 3.33% |
Bybit BTCUSDT | 0.333% | 8 hour settlement | 0.009996% | 3.00% |
OKX BTC-USDT-SWAP | 0.375% | 8 hour settlement | 0.0100% | 2.67% |
Kraken PF_XBTUSD | 0.500% | hour | not in this feed | not comparable |
Hyperliquid | 4.000% | hour | 0.00125% | 0.03% |
The bottom two rows are the reason this table has an "applies per" column. Kraken publishes `maxRelativeFundingRate` 0.005 per hour on both its linear and inverse Bitcoin perpetuals, and Hyperliquid's documentation states a 4% per hour cap that does not depend on the asset, adding that this is "much less aggressive capping than CEX counterparts". Lining those up against Binance's 0.300% without the period attached would understate Kraken by 8 times and Hyperliquid by more than 100.
One correction against our own back catalogue, because leaving it would be dishonest. Our 2026-08-16 census recorded Bybit's BTCUSDT cap as 0.500% per settlement. Bybit's own `instruments-info` and `tickers` endpoints both returned 0.00333 on 2026-08-20, that is 0.333%. We are recording the new reading and flagging the change rather than quietly overwriting the old one, since two of our own readings four days apart do not agree and the endpoint carries nothing that says whether the parameter moved or our earlier read was wrong. The cross-venue cap figures we published alongside negative funding rates across exchanges should be re-pulled rather than quoted. Bybit's own published formula does not reproduce the live number either: its help centre gives the upper limit as 0.75 times the gap between initial and maintenance margin, capped at the maintenance margin, and its risk-limit endpoint returns 0.0066 and 0.0033 for the lowest tier, which yields 0.2475%, not 0.333%. Even at a coefficient of 1.0 the formula returns 0.330%, so no value in the 0.5 to 1.0 range Bybit says it adjusts within reproduces the 0.333% the endpoint publishes.
How should you size a position against a funding cap?
Five rules, in the order they bite.
1. Convert the cap before you compare it. A cap is quoted per settlement interval, and intervals differ per symbol on the same venue and per venue on the same symbol. Multiply by 24 / interval hours for a daily figure before putting two caps side by side. 2. Then remember the interval itself can change. Reaching the cap is what moves a contract to hourly settlement on Binance, OKX and Bybit, so the daily ceiling you computed in rule 1 is the floor of the real one. For a 0.300% cap on an 8 hour clock that is 0.900% a day before escalation and 7.200% after. 3. Do not size against the cap. On the median live contract it sits 200x above the worst rate that contract has actually charged in the last several months. A stress case built on the ceiling is not conservative, it is unfalsifiable. 4. Size against the observed distribution, and state the window and the n. Our own 2026 figure for BTCUSDT is a maximum of 0.0100% across 695 settlements. That is a real number with a real denominator and no forecasting power at all. 5. Re-read the cap on the day, and never score an old rate against a current cap. It is a venue setting, it moves, the endpoint publishes no history of its value, and 7 of the 12 contracts above have already settled past the one they carry now.
You can run the conversions on the free funding rate calculator, turn a per-interval rate into an annual figure on the APY calculator, and check what a funding stream does to a leveraged position on the liquidation calculator. None of the three asks who you are.
What does this post not say?
It does not say a funding cap is decorative. It bound on the largest perpetual in the market in February and March 2020, ALPACAUSDT settled at or past 2% 27 times in six days in April 2025, and 21 contracts settled at their floor 48 times in the last three months of our own board sweep. A limit reached in every genuine crowding event is doing its job precisely by sitting far away the rest of the time.
It does not say funding will stay where it is. Everything above measures settlements that have already happened. 2021 ran at 42.9% of settlements above the anchor and 2022 ran at zero, with nothing in the data at the boundary to warn you, which is the strongest available argument against reading any of these numbers forward.
It does not claim to know what any cap was on any past date. Binance publishes the cap that applies now, plus an `updateTime` on 703 of 760 rows that dates the last change without recording the value before it. Every share-of-cap figure here is measured against the 2026-08-20 value. Where a historical settlement exceeds it, the correct reading is that the setting changed; where a historical settlement lands on it exactly, the correct reading is that we cannot tell.
It does not cover every board. The 569-contract sweep is Binance's USD-M linear perpetuals. Its 20 coin-margined perpetuals, other venues' inverse and USDC boards and its non-crypto perpetuals are outside it, and the 12-contract history panel is a deliberate selection of long-lived contracts rather than a random draw, chosen because they are the only ones with enough history to span regimes.
It does not treat the venues' caps as one number. Deribit and dYdX publish caps in documentation rather than as an API field and we did not read them live, so the headroom claim above is scoped to the venues whose caps we did read, each one's main linear Bitcoin perpetual on a single day.
What the post does say is narrower. A funding rate cap is a live venue setting that has been tightened over time, it is reached far more often at the bottom than at the top, it is reached by small crowded contracts rather than by falling markets, and reaching it makes the clock faster rather than the charge smaller. If you are pricing carry, the distribution is the input; the cap is the boundary condition, and on a typical contract today those two numbers are two orders of magnitude apart.
Re-reading a parameter on the day you use it, instead of quoting one you cached, is the habit this whole post argues for. It is also how Athenum runs: one live cross-exchange derivatives feed, re-read continuously, with a free 7 day Pro+ trial and no card. The 34 calculators alongside it stay free whether or not you take it, and not one of them wants an account, an email address, or a cap on how often you run it.
One terminal. All the data.
Liquidations, orderbook depth, whale walls & open interest from 4 exchanges, all real-time, in one place.
No credit card required

Athenum Analytics
Athenum Analytics is our three-person editorial team covering crypto derivatives, market data and macroeconomic context.