Table of Contents5 sections
- What is a futures insurance fund, and what does it do after a liquidation?
- What is auto-deleveraging (ADL), and when does it kick in?
- How do you know if you are at risk of being auto-deleveraged?
- What does today's crypto leverage picture say about ADL risk on 2026-07-18?
- How do you read insurance fund and ADL risk yourself?
TLDR. When a leveraged crypto futures position is force-liquidated and cannot be closed in the market at its bankruptcy price, two backstops decide who eats the loss: the exchange insurance fund and, if that is not enough, auto-deleveraging (ADL). The insurance fund is a pooled buffer that collects the surplus from liquidations that close better than bankruptcy price and pays out the shortfall when they close worse, so the winning trader is still made whole. ADL is the last resort: when the fund cannot cover a gap, the exchange force-closes the most profitable and most highly leveraged traders on the opposite side, at the bankruptcy price, to socialize the loss. Your ADL risk is highest when you are the crowd's winning, high-leverage counterparty in a one-sided market. As of 2026-07-18, Athenum's live feed shows BTC perpetual open interest around $17.5 billion across the 14 exchanges, a long/short account ratio of 1.42 and positive funding near +0.0051% per 8 hours, so positioning leans long: in a sharp drop the crowded longs liquidate first, and the profitable, leveraged shorts are the ones ADL would reach for.
What is a futures insurance fund, and what does it do after a liquidation?
A liquidation does not happen at zero. Every leveraged position has a liquidation price, where maintenance margin runs out, and a slightly worse bankruptcy price, where the margin is fully gone. When the market touches your liquidation price the exchange's liquidation engine takes the position over and tries to close it. If it closes the position at a price better than bankruptcy, the leftover margin is a surplus; if it closes worse, because price gapped straight through the level, there is a shortfall the losing trader can no longer cover.
The insurance fund is the pool that reconciles those two cases. It banks the surplus from the well-executed liquidations and spends it covering the shortfalls from the bad ones, so the trader on the other side of a gap-through still gets paid in full instead of having their profit clawed back. Binance, Bybit and OKX each run and publicly report such a fund, and in calm markets the balances tend to grow because most liquidations close at or above bankruptcy price. The fund is not charity and it is not infinite: it is a shock absorber sized to the normal drip of small shortfalls, not to a market-wide cascade. When a move is violent enough to overwhelm it, the exchange reaches for its last tool.
What is auto-deleveraging (ADL), and when does it kick in?
Auto-deleveraging is what happens when the insurance fund cannot, or should not, absorb the shortfall. Instead of letting the fund go negative, the exchange force-closes positions on the opposite side of the bankrupt trade, at the bankruptcy price, until the loss is covered. If a long blows up and the fund is stretched, the exchange closes profitable short positions early to take over the other side of that trade. The winning trader did nothing wrong, but their position is closed for them, at a price they did not choose, and they lose the rest of the move they would have captured.
Exchanges do not pick those victims at random. They rank every account on the profitable side by a score that combines unrealized profit (return on the position) and effective leverage, and they close from the top of that queue down. The more profit you are sitting on and the more leverage you are using, the closer to the front you are. Most venues surface this as an ADL indicator, a small row of lights or dots on the position: more lights lit means you are higher in the queue and more likely to be deleveraged first if a cascade forces the exchange's hand.
Insurance fund | Auto-deleveraging (ADL) | |
|---|---|---|
Triggers when | A liquidation closes worse than bankruptcy price | The insurance fund cannot cover the shortfall |
Who absorbs the loss | The shared, pre-funded pool | Profitable, high-leverage traders on the opposite side |
Price you get | Not applicable, you are not touched | The bankrupt trade's bankruptcy price, not the market |
Warning you get | None, it is automatic and invisible | The ADL indicator lights on your position |
How to reduce exposure | Nothing to do, the fund protects you | Cut leverage, trim profit, or hedge on the crowded side |
How do you know if you are at risk of being auto-deleveraged?
The honest answer is that ADL risk is not about you in isolation, it is about which side of the market is crowded and whether you are the profitable, leveraged counterparty to it. Work it in three moves. First, find the crowded side: a long/short account ratio above 1 and persistently positive funding both say the book leans long, because longs are the ones paying to hold the position. Second, remember the sequence: if longs are crowded and price falls, the longs are liquidated, the fund pays the profitable shorts, and if the drop is violent the exchange auto-deleverages those same profitable, high-leverage shorts. The crowd gets liquidated; the crowd's winning counterparty gets ADL'd. Third, check your own position's ADL indicator and ask whether your profit and leverage put you near the front of that queue.
You can also reduce the risk deliberately, in four steps:
1. Cut leverage on a winning position once a move goes one-directional, since leverage is half of the ADL ranking score. 2. Take partial profit, because unrealized profit is the other half of the score and trimming it moves you down the queue. 3. Avoid being the last profitable short in a market that has already liquidated most of the longs (or the mirror image in a squeeze up). 4. Watch open interest and funding, not just price: rising open interest into a one-sided, high-funding market is exactly the fuel a cascade needs.
What does today's crypto leverage picture say about ADL risk on 2026-07-18?
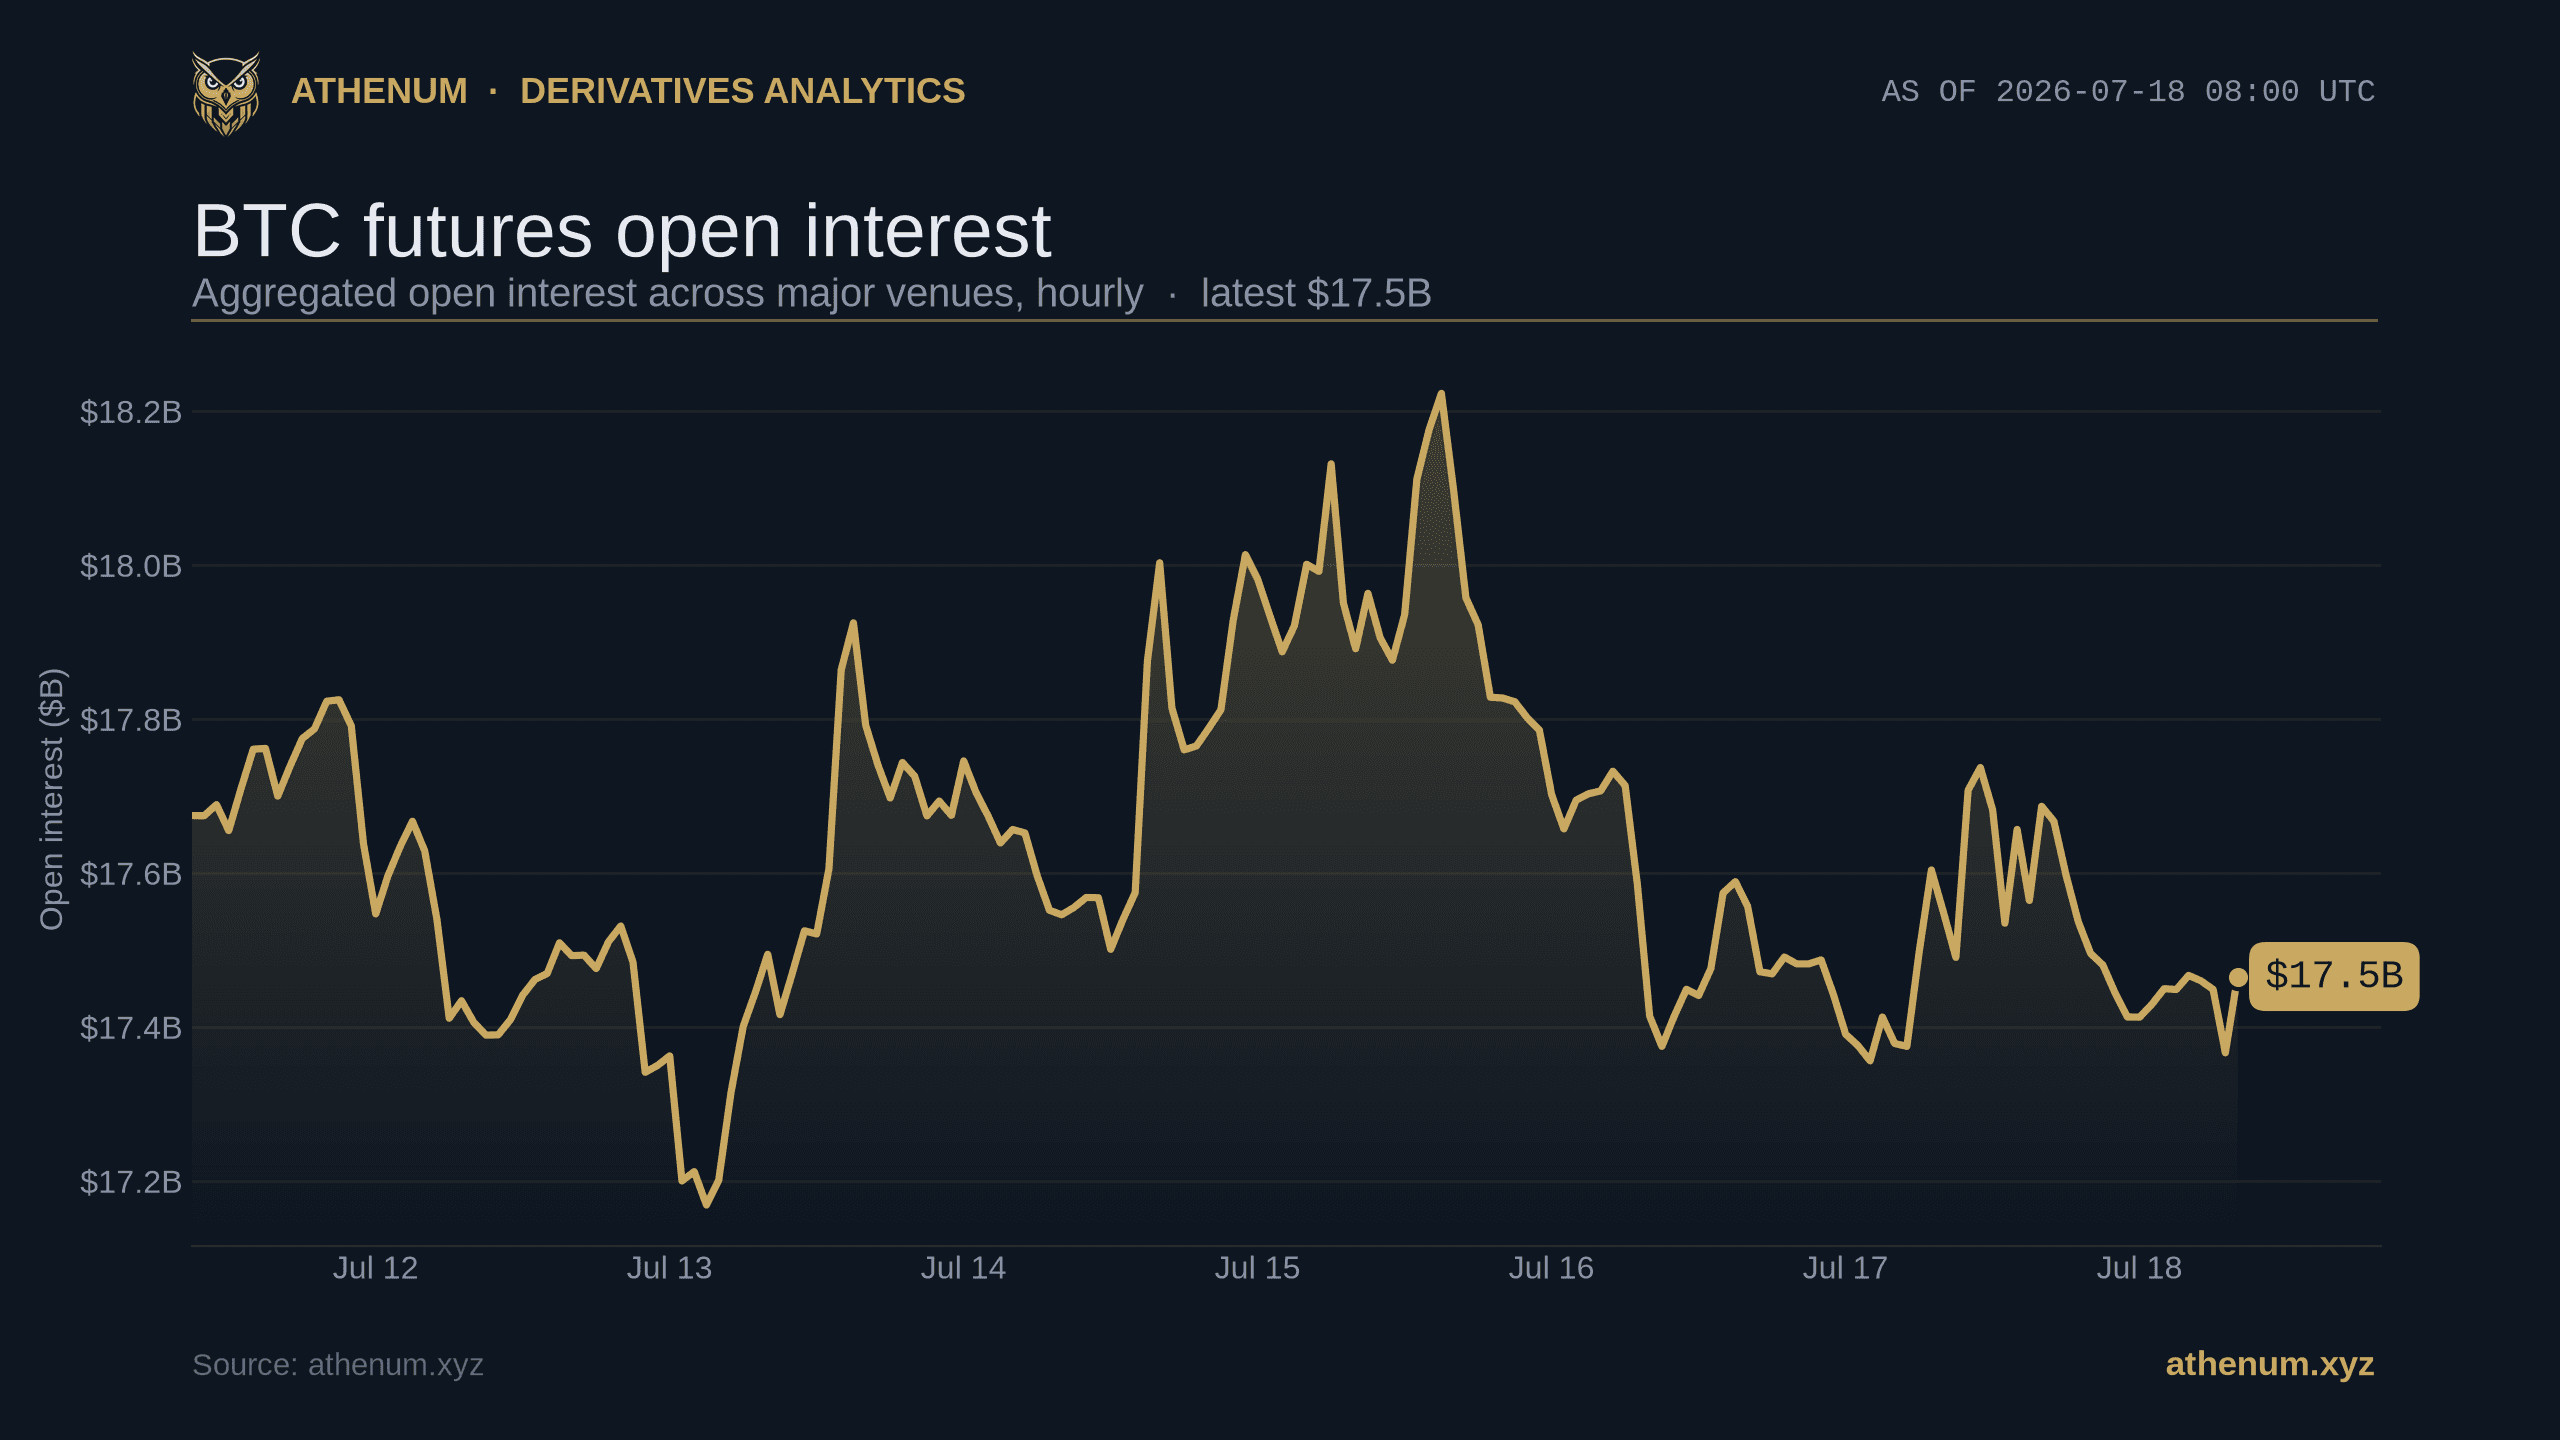
ADL is a tail event, so the useful question on any calm day is not "is it happening now" but "which side would it hit if a cascade started". On 2026-07-18, reading Athenum's live cross-exchange feed with BTC near $63,960, the picture leans long but is not yet stretched. Aggregate BTC perpetual open interest sits around $17.5 billion across the 14 exchanges (the cover chart above), roughly the middle of its own recent $17.2 to $18.2 billion range, so there is a large but not extreme pile of leverage that a sharp move would have to unwind.
Where that leverage sits matters as much as how much of it there is, because each venue runs its own insurance fund and its own ADL queue. On 2026-07-18 the named venues carry about $6.43B of that open interest on Binance (36.8%), $3.51B on Bybit (20.1%), $2.50B on Hyperliquid (14.3%), $2.19B on Bitget (12.5%), $1.97B on OKX (11.3%) and $0.75B on Deribit (4.3%), so the top three venues hold roughly 71% of it. A cascade does not have to be market-wide to trigger ADL: a violent enough move on one concentrated venue can exhaust that venue's fund and start deleveraging there first, even while the aggregate still looks calm.

Where the leverage sits on 2026-07-18: Binance holds 36.8% of the named open interest and the top three venues about 71%, so a per-venue cascade can trigger ADL locally.
The positioning tilt is what tells you which side ADL would reach for. On 2026-07-18 the aggregated long/short account ratio is 1.42, meaning noticeably more accounts are long than short, and it has swung between about 1.15 and 1.59 over the past week.

The BTC long/short account ratio was 1.42 on 2026-07-18, above the balanced 1.0 line: the book leans long, so longs liquidate first in a drop.
Funding confirms the lean. Aggregated perpetual funding is positive at about +0.0051% per 8 hours on 2026-07-18, near +5.5% annualized, which means longs are paying shorts to hold the position, the textbook sign of a crowded long. The crowding is not uniform across venues either: funding runs as high as +0.0074% per 8 hours on Binance and as low as +0.0008% on Deribit, so the most crowded, most funding-heavy venue is where a downside cascade would bite first.

Aggregated BTC funding was about +0.0051% per 8h on 2026-07-18, so longs are paying shorts: a crowded-long tilt that puts profitable shorts in the ADL line if price drops.
Put together, the read on 2026-07-18 is a moderately crowded long with room to unwind, not an imminent cascade: open interest is mid-range, funding is mildly positive rather than euphoric, and the ratio is elevated but off its highs. The value is in the method, not the alarm level. When open interest climbs, funding stretches and the ratio pins to one side, the same three readings tell you a cascade is closer and which side's winners are lining up for ADL.
How do you read insurance fund and ADL risk yourself?
Turn all of it into a repeatable check:
1. Read the crowded side from the long/short ratio and the funding sign. Above 1 with positive funding is a crowded long; below 1 with negative funding is a crowded short. 2. Remember the two-step: the crowded side liquidates first, then the profitable, leveraged other side is what the fund pays and, in a violent move, what ADL closes. 3. Watch open interest and its concentration by venue. A big, one-venue-heavy pile is more fragile than the aggregate suggests, because each venue's fund and ADL queue are separate. 4. Check your own ADL indicator and de-risk if you are a high-profit, high-leverage account on the winning side, by cutting leverage or trimming profit.
Liquidation is triggered off the mark price, not the last trade, which is why understanding mark price versus index and last price is the difference between a real liquidation and a wick that should never have hit you. When the crowded side unwinds all at once, the result is the market-wide domino this backstop exists to contain, the liquidation cascade. To see where the leverage is stacked before any of this fires, read open interest by exchange and the long/short ratio, and to price your own bankruptcy and liquidation levels before you size a trade, the free leverage and liquidation calculator and funding rate calculator do the arithmetic for you.
You can watch this same leverage picture move in real time: Athenum tracks live derivatives data across 14 exchanges and pairs it with 34 free calculators, none of which ask for an account or an email, and none of which impose a usage limit. Map your own bankruptcy and liquidation price first in the free leverage and liquidation calculator, then open the live Athenum terminal to see where open interest, funding and positioning sit right now.
One terminal. All the data.
Liquidations, orderbook depth, whale walls & open interest from 4 exchanges, all real-time, in one place.
No credit card required

Athenum Analytics
Athenum Analytics is our three-person editorial team covering crypto derivatives, market data and macroeconomic context.