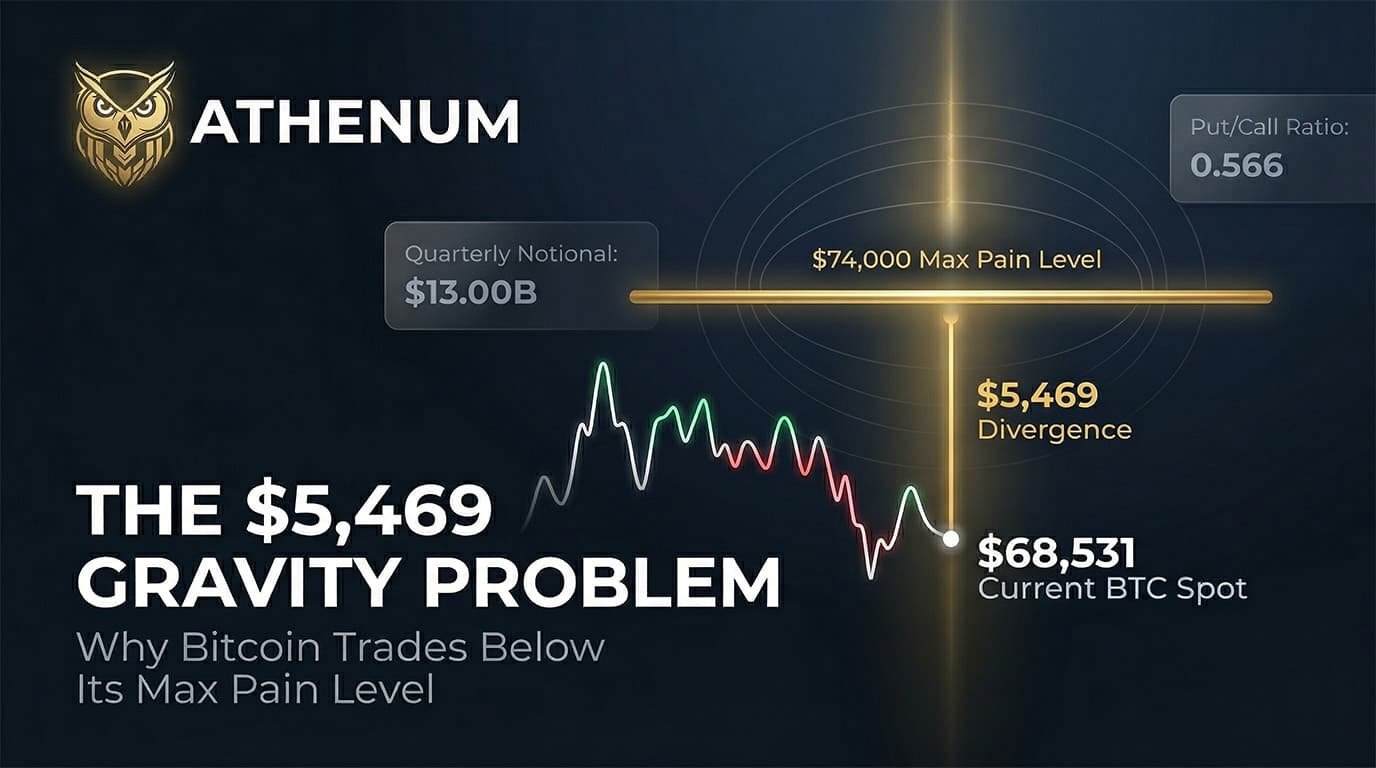
The $5,469 Gravity Problem: Why Bitcoin Is Trading Below Its Max Pain Level
Bitcoin is currently trading at $68,531, presenting a massive $5,469 divergence from the $74,000 max pain level for today's quarterly options expiry. This 7.98 percent gap occurs on a day when billions of dollars in notional value are set to settle, creating a severe mechanical tension between spot market supply and derivative market gravity. The Athenum snapshot recorded $13.00B notional for this expiry, slightly below the $14.16B widely cited by CoinDesk, likely reflecting a different snapshot timestamp. The structural reality remains the same: the market is stretched unusually far from the point of maximum pain for option buyers, forcing market makers into complex delta hedging positions.
The Primary Signal: Options Gravity and Gamma Exposure
The quarterly expiry is traditionally a high friction event. When spot prices deviate significantly from max pain, market makers who sold those options must dynamically adjust their spot and futures hedges. With spot at $68,531 and max pain at $74,000, the gravitational pull is theoretically upward. Market makers are typically short gamma in this scenario, meaning they are forced to buy as the price rises toward the strike, or sell if it falls further away, to remain delta neutral.
Athenum data shows a put/call ratio of 0.566 for today's expiry, indicating a heavy concentration of call options. A significant portion of these calls are currently out of the money. If the spot price remains suppressed below $70,000, these calls will expire worthless, rewarding the institutional writers who collected the premiums. The compression of implied volatility, with DVOL dropping recently, suggests that institutions have been aggressively overwriting their spot positions, capping the upside and banking premium while waiting for geopolitical uncertainties to resolve.
Expiry Date | Max Pain Price | Put/Call Ratio | Notional Value | Days to Expiry |
|---|---|---|---|---|
27.03.2026 | $74,000 | 0.566 | $13.00 B | 0 |
28.03.2026 | $70,000 | 0.722 | $324 M | 1 |
03.04.2026 | $69,000 | 0.629 | $1.20 B | 7 |
24.04.2026 | $70,000 | 0.694 | $5.53 B | 28 |
The table above illustrates the immediate pressure. The max pain level drops sharply to $70,000 for tomorrow's daily expiry and remains anchored near $69,000 to $70,000 for the subsequent weeks. Today's $74,000 level is an outlier, a remnant of bullish positioning established earlier in the quarter before the recent geopolitical shocks altered the macroeconomic landscape. The failure of spot price to converge with this $74,000 magnet indicates that external selling pressure is overwhelming the mechanical pull of the options market.
The Secondary Signal: Macro Regime and Geopolitical Friction
The divergence in the options market cannot be analyzed in isolation. The macroeconomic backdrop provides the necessary context for why spot buyers are absent. Athenum's live analytics show a macro regime classified as neutral, but with a confidence score of 0.45. A confidence score below 0.5 indicates a fragile regime, highly susceptible to transition. The market is effectively balancing on a knife edge between neutral consolidation and a definitive risk off posture.
The primary driver of this fragility is elevated volatility in traditional finance. The VIX, a standard measure of equity market volatility, currently sits at 25.33. This is firmly above the 25.0 threshold that typically signals risk off conditions. The elevation in the VIX correlates directly with recent geopolitical tensions, specifically the prolonged uncertainty surrounding the United States and Iran. As energy markets price in potential supply disruptions, the resulting inflationary fears constrain the Federal Reserve's ability to provide liquidity, keeping the Federal Funds rate anchored at 3.64 percent.
Macro Indicator | Current Value | Threshold | Signal |
|---|---|---|---|
VIX | 25.33 | 25.0 | risk-off |
High Yield Spread | 3.17% | 4.0% | neutral |
T10Y2Y | 0.46 | 0.0 | neutral |
Fed Funds Rate | 3.64% | 5.0% | neutral |
This fragile macro environment is directly reflected in institutional capital flows. Bitcoin exchange traded funds experienced a net outflow of $171.2 million on March 26, following a $74.5 million outflow on March 24. These outflows during a period of elevated VIX demonstrate that traditional finance allocators are de-risking their portfolios. The institutional selling pressure in the spot market acts as a heavy counterweight to the upward gravity of the $74,000 options max pain level.
Microstructure Context: Toxic Flow and Spoofing
Beneath the macro and options data, the orderbook microstructure reveals a highly toxic trading environment. Athenum's live orderbook analytics show an L5 imbalance that is oscillating rapidly between strong bullish and strong bearish classifications. Over a recent fifty minute window, the L5 signal flipped directions six times. This rapid oscillation is characteristic of a positioning phase rather than a trending market. High frequency traders and algorithmic market makers are probing for liquidity, but neither buyers nor sellers possess the conviction to initiate a sustained directional move.
This lack of conviction is further evidenced by the prevalence of deceptive order placement. Athenum data shows a spoof score of 63 on Binance Futures and 67 on Hyperliquid Perps, both classified as moderate to high. More critically, Athenum's live analytics show that 87.2 percent of all identified whale walls are classified as spoof suspect. The median lifespan of a large order in the current environment is just 3 seconds.
Lifespan Bucket | Percentage of Walls | Average USD Value | Fill Percentage |
|---|---|---|---|
0 to 30 seconds | 84.9% | $2.80 M | 0.12% |
30 to 60 seconds | 2.3% | $2.13 M | 0.01% |
1 to 5 minutes | 3.1% | $2.17 M | 0.05% |
15+ minutes | 1.2% | $4.76 M | 0.18% |
The data indicates that the vast majority of visible liquidity is illusory. Orders are placed to manipulate the L5 imbalance and force reactionary trading from retail participants, only to be canceled before execution. True conviction walls, those lasting longer than 15 minutes, account for only 1.2 percent of the orderbook activity. In a market dominated by toxic flow and fleeting liquidity, large spot buyers are naturally hesitant to deploy capital, further explaining the inability of the spot price to close the gap with the options max pain level.
Structural References: The CME Gap Magnet
While the immediate focus is on the upward pull of the $74,000 options expiry, a longer term structural reference exerts a downward gravitational force. A significant CME futures gap remains open at $65,880, originating from the weekend of February 27. This gap has been open for 607 hours and sits 7.58 percent below the current spot price.
Athenum's live analytics show that historical CME gaps have a 77.3 percent fill rate. While upward gaps fill at a 95.8 percent rate, downward gaps like the one at $65,880 still fill 55.0 percent of the time. The average time to fill a gap is 2,493 hours, meaning the current 607 hour duration is well within the normal lifecycle of structural price discovery. The presence of this untested liquidity void below the market provides a logical target for short sellers, especially if the fragile macro regime transitions fully into risk off territory.
The funding rate environment adds another layer of complexity to this structural picture. Following a period of negative funding where shorts were paying longs, the rates have flipped positive. Binance currently shows an annualized percentage rate of 1.80 percent, while Hyperliquid sits at an elevated 10.95 percent. This divergence suggests that speculative long positions are rebuilding, particularly on decentralized exchanges, despite the toxic orderbook and macro headwinds. The cost of carrying these long positions will become a headwind if the spot price continues its tight consolidation.
To further understand the mechanics of the options market, it is essential to analyze the behavior of gamma exposure. When market makers sell options, they take on the opposite risk of the buyer. To remain neutral, they must hedge their positions by buying or selling the underlying asset. As the expiration date approaches, the gamma, or the rate of change of the delta, accelerates significantly for options that are near the money. In the current scenario, with the spot price sitting near $68,500 and the max pain at $74,000, the gamma exposure for the $70,000 to $74,000 strikes is immense. If the spot price were to begin moving upward, the forced buying by market makers to hedge their short call positions could create a reflexive loop, accelerating the price increase. However, the heavy institutional overwriting of calls, as evidenced by the dropping implied volatility, suggests that large players have strategically capped this upside potential. They are comfortable collecting the premium, confident that the macroeconomic headwinds will prevent a sudden spot rally.
The ETF flow dynamics provide a stark contrast to the speculative positioning in the derivatives market. The consecutive days of outflows, particularly the $171.2 million exit on March 26, represent real spot selling pressure. These are not leveraged bets that can be squeezed; they are permanent capital withdrawals driven by risk management mandates in traditional finance. When a portfolio manager sees the VIX spike above 25.0 due to geopolitical instability, standard risk parity models dictate a reduction in high beta assets like Bitcoin. This persistent spot selling acts as a continuous dampener on any upward momentum generated by the options market. It creates a ceiling that the mechanical forces of delta hedging simply cannot break through without a fundamental shift in the macroeconomic narrative.
Furthermore, the divergence in funding rates across exchanges highlights the fragmented nature of the current market structure. While Binance maintains a relatively subdued annualized percentage rate of 1.80 percent, the 10.95 percent rate on Hyperliquid indicates aggressive long speculation by retail and crypto native participants. This cohort is essentially paying a premium to hold leveraged long positions, betting on a delayed convergence with the $74,000 max pain level. If the spot price fails to materialize this rally, the cost of carrying these positions will eventually force capitulation. This creates a latent pool of downside liquidity, as forced liquidations of these overleveraged longs could trigger a rapid descent toward the untested CME gap at $65,880. The market is thus caught in a precarious balance, with institutional spot selling capping the upside and retail leverage creating vulnerability to the downside.
The concept of toxic flow is critical to understanding why the spot price remains stagnant despite these massive mechanical forces. In a healthy market, large limit orders provide genuine liquidity, allowing buyers and sellers to execute significant volume without moving the price. In the current environment, the orderbook is characterized by phantom liquidity. High frequency trading algorithms deploy massive buy and sell walls, only to cancel them milliseconds before execution. This behavior, quantified by the spoof scores of 63 and 67, serves two purposes: it obscures the true depth of the market and it triggers reactionary trading from less sophisticated participants. When 87.2 percent of all identified walls are suspect, organic price discovery becomes nearly impossible. The market is essentially shadowboxing, reacting to orders that do not exist. This toxic microstructure prevents the efficient transfer of capital required to close the 7.98 percent gap between the spot price and the options max pain level.
What the Data Says
The current market architecture is defined by competing gravitational forces operating across different timeframes and instruments. The interaction of these forces creates the tight, fifty day consolidation range that currently defines the market.
Price and Positioning: The spot price is pinned near $68,500, caught between the immediate upward pressure of the $13.00 billion options expiry at $74,000 and the downward structural pull of the open CME gap at $65,880. The rapid oscillation of the L5 imbalance confirms that short term positioning is chaotic and devoid of directional conviction.
Flow: Institutional flow is currently a net negative. The recent $171.2 million outflow from spot exchange traded funds demonstrates a clear de-risking by traditional finance participants. This spot selling absorbs any upward delta hedging flows generated by the options market. Simultaneously, the orderbook is dominated by spoofing, with 87.2 percent of walls vanishing within seconds, ensuring that organic liquidity remains thin.
Regime: The overarching macro regime is fragile. With the VIX elevated above 25.0 and geopolitical tensions dictating energy prices, the broader financial ecosystem is defensive. This limits the probability of a breakout driven by exogenous capital injection. The confidence score of 0.45 indicates that the system is highly sensitive to the next macroeconomic data release.
Confluence: The failure of the spot price to converge with the $74,000 max pain level is not an anomaly, but a rational outcome of conflicting data vectors. The toxic microstructure and negative institutional flows are effectively neutralizing the mechanical pressures of the derivatives market. The market is trapped in a state of dynamic equilibrium, where deceptive orderbook liquidity and macro fragility prevent resolution of the massive divergence between spot and options pricing.
Sources
- CoinDesk. "There's a huge $14 billion bitcoin options expiry this Friday and it points to $75,000 as price magnet." March 25, 2026.
- CoinDesk. "Bitcoin has traded in a tight range for nearly 50 days but this is not a bear flag." March 26, 2026.
- Bitcoin.com. "VIX Jumps to 27 as $1 Trillion Leaves US Stock Markets on Iran Oil Shock." March 26, 2026.